

A single churn number, presented without a stage, a segment, or a definition, cannot support a board decision. Before your next board meeting, you should be able to state your logo churn, gross revenue retention, and net revenue retention for your ARR stage, know which of the three is your actual problem, and name the one lever you are pulling next quarter to move it. This article gives you the benchmark table by ARR stage, the math to place your own number on it, and the decision framework to act on the gap instead of debating it.
A 5% churn rate is not universally good or bad. A 20% churn rate is not automatically a crisis. Both answers depend entirely on your ARR stage, your contract structure, and which of the three churn metrics you are quoting. That context is the whole point of this piece.
Key takeaways
- Logo churn, gross revenue retention (GRR), and net revenue retention (NRR) answer three different questions. Quoting one when the board is asking about another is the most common source of confused churn conversations.
- Benchmark against your ARR stage, not the stage above you. A company under $1M ARR comparing itself to a $20M ARR peer set will chase a target that does not match its customer base or contract length yet.
- Annualized churn compounds faster than the monthly number suggests. A monthly rate that looks tolerable in a spreadsheet can erase close to half your customer base over a year.
- GRR is the more honest retention signal. High NRR with weak GRR usually means a handful of expansion deals are covering for a retention problem that surfaces the moment expansion slows.
- Rule of 40 and churn are connected: churn is one of the fastest levers you have to move your combined growth-plus-profit score, because retained revenue does not require new CAC spend to replace it.
- A benchmark tells you where you stand. It does not tell you what to do next. That requires a cohort view, an owner, and a decision cadence, which is the actual gap most $5-50M ARR companies have.
What churn rate actually measures, and why one number is not enough
"Churn rate" gets used as shorthand for three distinct metrics, and mixing them up is the single most common cause of unproductive churn conversations at the board level.
Logo churn (customer churn). The percentage of customers lost during a period, divided by customers at the start of the period. It counts a $500/month account and a $50,000/year account equally, which is exactly why it is not sufficient on its own.
Gross revenue retention (GRR). The percentage of recurring revenue retained from your existing customer base, excluding any expansion revenue. GRR caps at 100% and cannot go higher, which is what makes it the cleanest read on whether your product and onboarding are working.
Net revenue retention (NRR). GRR plus expansion revenue from upsells, seat growth, and usage growth, minus what was lost to churn and contraction. NRR can exceed 100%, and negative net churn (NRR above 100%) is the mechanism that lets a company grow revenue from its existing base even with zero new sales in a given month.
The reason this distinction matters for decision-making: a company can report 6% monthly logo churn and 2% net revenue churn in the same period, and neither number is wrong. They are answering different questions. If your board deck quotes NRR while your actual retention engine is weak, you are one slow expansion quarter away from a number that suddenly looks broken. We cover the full mechanics of the customer-level metric in our guide to customer churn rate in SaaS, and the retention-side counterpart in our logo retention rate breakdown.
How to calculate each churn metric
Use consistent time periods and a clean customer cohort (typically customers past 90 days post-activation, since including trial dropouts inflates the number by 2 to 3 times and does not match how public benchmarks report).
Two calculation details that change the answer more than most founders expect:
- Monthly versus annualized. Do not multiply a monthly rate by 12. Compound it: annualized churn equals 1 minus (1 minus monthly churn) to the 12th power. A 5% monthly rate compounds to roughly 46% annual customer loss, not 60%.
- Customer-weighted versus revenue-weighted. A blended churn rate across SMB and enterprise segments hides which segment is actually the problem. Segment before you benchmark, or the number will send you to the wrong fix.
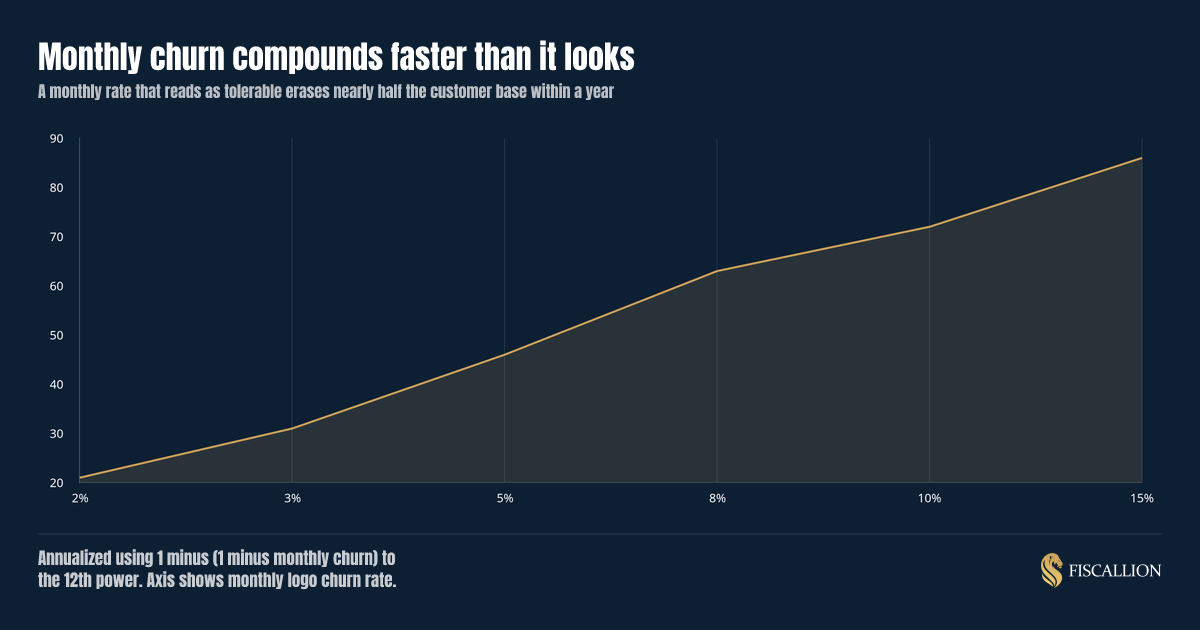
That compounding effect is why a small improvement in monthly churn moves your annual number more than intuition suggests. It is also why "we only lose 3% a month" is not the reassuring sentence founders think it is.
SaaS churn rate benchmarks by ARR stage
Benchmark ranges below are synthesized from public datasets, including ChartMogul's SaaS benchmarks, the Bessemer Cloud Index, SaaS Capital's private company survey, and Recurly's subscription data. Treat them as directional ranges, not exact targets, since vendor cohort definitions vary.
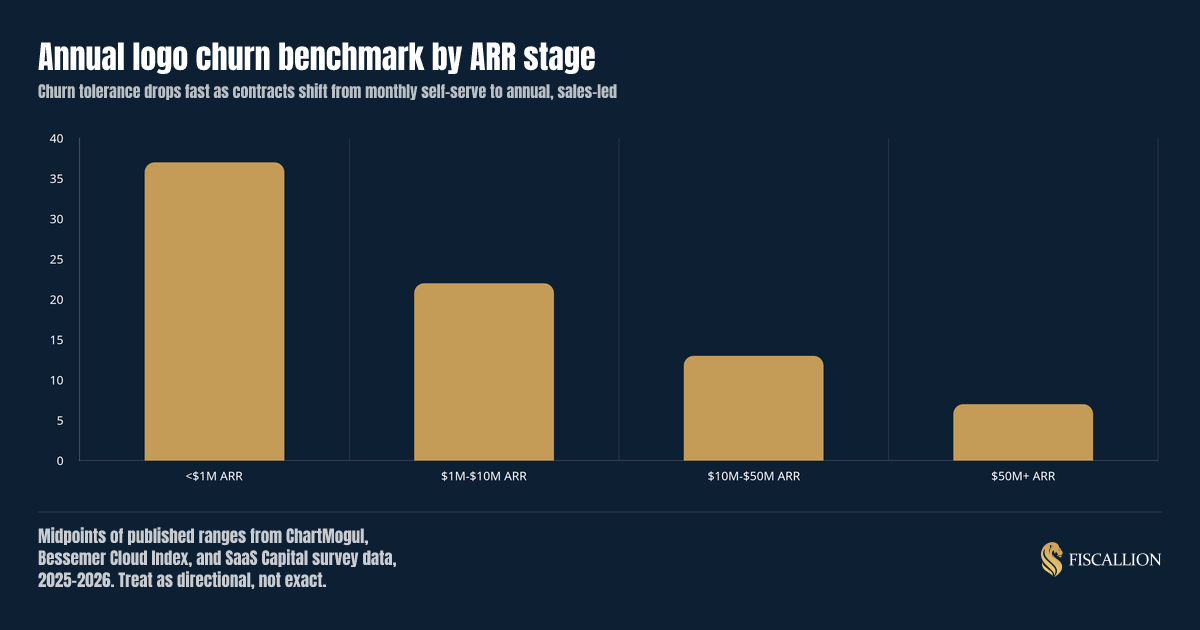
The Early-Stage Churn Spike: The massive gap between the sub-$1M row and the $10M+ rows is structural, not operational. Early on, you are still weeding out bad-fit customers and transitioning from monthly to annual commitments. Don't panic if early numbers look volatile.
Evaluating these volatile early-stage losses requires looking past the raw numbers to evaluate the health of the remaining cohort.
Net revenue retention benchmarks by ARR stage
Logo churn tells you how many customers you lost. NRR tells you whether your revenue base is shrinking or growing after accounting for both losses and expansion, which is the number most Series B and Series C investors weight more heavily in diligence.
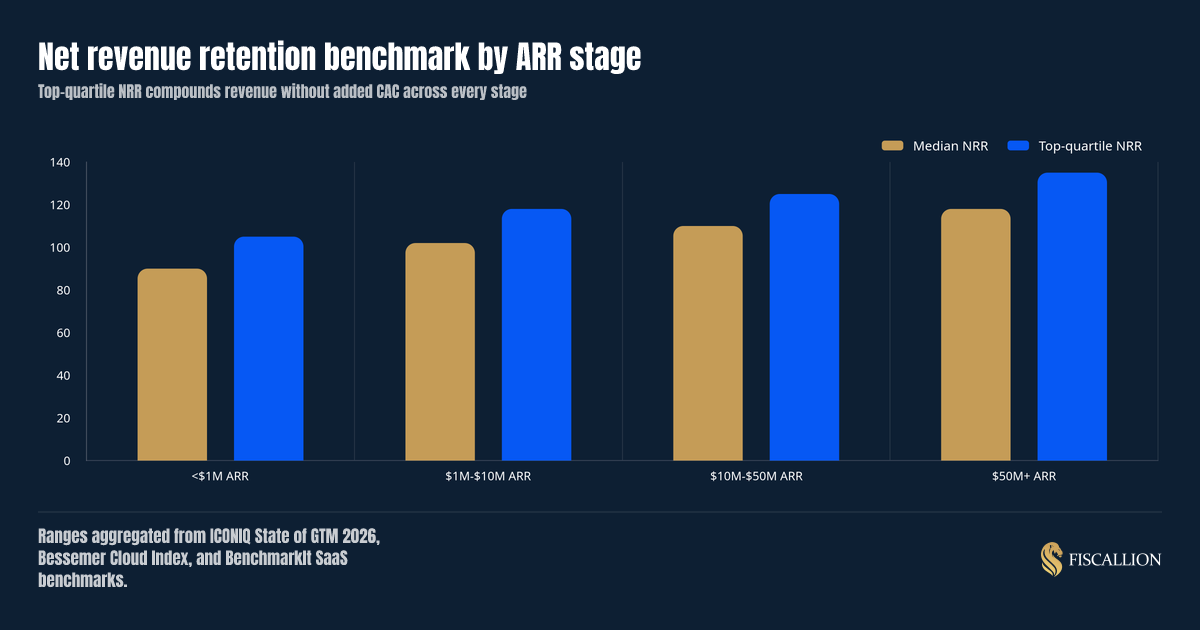
The Expansion Illusion: As you scale past $10M ARR, the spread between top-quartile and median NRR widens dramatically. If you are leaning on a few massive upsells to hit a healthy NRR while your baseline GRR degrades, you are one slow sales quarter away from an unexpected boardroom crisis.
How to interpret your number against these benchmarks
Placing your churn number on the table above is step one. Interpreting it correctly is the part that actually changes decisions.
Check GRR before you celebrate NRR. If GRR sits more than roughly 15 to 20 points below NRR, your growth is currently subsidized by expansion, not retention. That is a fragile position going into a slower sales quarter.
Segment before you conclude anything. Blend SMB and enterprise churn together and you will misdiagnose the fix. If SMB churn is running at 4-5% monthly and enterprise is under 1%, your average tells you nothing actionable. Pull the cohort table by segment before the board meeting, not during it.
Separate voluntary from involuntary churn. Roughly a quarter to a third of total churn at growth-stage companies is involuntary, meaning failed payments and expired cards rather than a customer choosing to leave. That share is fixable with dunning and payment recovery in weeks, not a product roadmap change.
Read the trend, not the snapshot. A single quarter's churn number is noisy, particularly below $5M ARR where customer counts are still small enough that one or two large accounts swing the percentage meaningfully. Three consecutive quarters moving in the same direction is a trend. One quarter is a data point.
What to do next: turning a benchmark into a decision
A benchmark tells you where you stand, but it won’t fix the leak. When your churn numbers miss the mark for your stage, execute this sequence:
- Tag by reason, not by size: Group churned accounts into five distinct buckets: wrong-fit customer, missing feature, price sensitivity, budget cut, or payment failure. A churn percentage without a reason-code taxonomy is just a symptom report, not a diagnosis.
- Quantify the leak in hard dollars: A "4% monthly revenue churn" sounds abstract in a slide deck. Saying, "$180K in ARR is leaking out through failed credit card retries" gets an automated dunning tool budget approved the same week.
- Isolate voluntary vs. involuntary churn: Up to a third of SaaS churn is mechanical (failed payments, expired cards). This can be cured by your finance or operations team in a few weeks, saving your product engineering team from wasting time on an unnecessary roadmap overhaul.
- Calculate your Rule of 40 shortcut: The Rule of 40 demands that your growth rate plus profit margin equal 40%+. Dropping your monthly logo churn from 5% to 3% frees up critical CAC spend that would otherwise be wasted replacing departed revenue, letting that capital flow straight to net-new growth or profitability.
Moving past these high-level symptom reports requires an operational framework that isolates actionable root issues.
This is the same discipline we described in our broader piece on FP&A for startups: the finance function's job is not to report the number, it is to translate the number into the next decision.
Common mistakes and the better move
Rule of 40 and where churn fits
The Rule of 40 states that a SaaS company's annual revenue growth rate plus its profit margin (most commonly EBITDA margin or free cash flow margin) should equal 40% or higher. A company growing 25% with a 15% EBITDA margin clears the bar. A company growing 15% with a 5% margin does not, and that gap is exactly the kind of trade-off conversation a board should be having explicitly rather than deferring.
Churn is one of the fastest levers connected to this score, because retained revenue does not require new customer acquisition cost to replace it. Cutting monthly logo churn from 5% to 3% at a $15M ARR company with a $15,000 average contract value does not just improve a retention slide. It reduces the new bookings required to hit the same growth number, which frees CAC spend that would otherwise be replacing lost revenue and lets that spend count toward net growth instead.
McKinsey's research on this metric found that only about a third of software companies achieve the Rule of 40 in a given year, and fewer sustain it across multiple years. The companies that do treat churn reduction and expansion revenue as growth levers in their own right, not as a retention team's side project separate from the growth conversation happening in the board room.
The practical asset: a churn benchmark scorecard
Before your next board meeting, build a one-page scorecard with these five rows filled in with your actual numbers, not a blended estimate:
- Logo churn (monthly and annualized) for your ARR stage, segmented by ACV band
- GRR and NRR side by side, with the gap between them flagged if it exceeds 15 points
- Voluntary versus involuntary churn split, with the involuntary dollar amount called out separately
- Your stage's benchmark range from the table above, with your number placed against it
- The one lever you are pulling next quarter, the owner's name, and the review date
That scorecard is the difference between a churn slide that reports history and one that tells the board what happens next. If your current reporting stops at the percentage and does not answer what you are doing about it, that is a decision-cadence gap, not a dashboard gap, and it is the specific problem Fiscallion's FP&A engagements are built to close for $5-50M ARR companies that need CFO-level judgment without a full-time finance hire yet.
Shifting the board narrative: from scorecard to strategy
Churn benchmarks are only useful when matched to your stage, segmented by customer type, and paired with the GRR number that keeps NRR honest. The number itself is diagnostic input, not the decision. The decision is what you do about the gap between your number and your stage's benchmark: which segment you fix first, which owner runs the fix, and what you report to the board when the number moves.
If your churn reporting currently stops at a percentage with no cohort view, no reason-code breakdown, and no clear next action, that is a sign your FP&A infrastructure has not caught up to your stage, not that your retention is necessarily broken. Audit your metrics definitions and forecasting model before your next board cycle, so the churn slide answers what changes next instead of just what happened last quarter.
FAQ
What is a good churn rate for a SaaS company?
There is no single good churn rate; it depends on your ARR stage, contract length, and customer segment. As a directional guide: under $1M ARR, 5-8% monthly logo churn is typical and not alarming on its own. At $1M-$10M ARR, healthy companies run 2-5% monthly. At $10M-$50M ARR, the range tightens to 0.8-2.5% monthly, and above $50M ARR, best-in-class companies sit under 1.5% monthly. The more useful question than "is my number good" is whether your number is improving relative to your own stage's trajectory and whether your GRR (not just NRR) supports the story your logo churn tells.
What is the Rule of 40 for SaaS?
The Rule of 40 is a heuristic stating that a SaaS company's annual revenue growth rate plus its profit margin should add up to 40% or higher. Growth is typically measured as year-over-year ARR or MRR growth, and profit margin is most commonly EBITDA margin or free cash flow margin. A company growing 30% with a 10% margin clears the bar; a company growing 15% with a negative 10% margin does not. It is a high-level check on whether a company is balancing growth investment with operational discipline, and boards use it to decide whether to push harder on growth spend or shift focus toward efficiency and retention. Churn reduction directly improves this score because retained revenue does not require new CAC to replace it.
Is a 5% churn rate good?
It depends entirely on whether that 5% is monthly or annual, and on your ARR stage. A 5% annual churn rate is strong performance at almost any stage, comparable to top-quartile enterprise retention. A 5% monthly churn rate is a very different statement: it compounds to roughly 46% annual customer loss, which is normal and expected under $1M ARR but would signal a real problem at $10M+ ARR where the benchmark range is closer to 0.8-2.5% monthly. Always confirm the time period before reacting to the number, and confirm whether it is logo churn or revenue churn, since those two 5% figures can describe very different underlying businesses.
What does a 20% churn rate mean?
Context determines whether 20% is a crisis or expected. A 20% annual logo churn rate is within the normal range for a $1M-$10M ARR company with a mix of monthly and annual contracts, and it is actually close to top-quartile performance for an early-stage company under $1M ARR. The same 20% figure at a $50M+ ARR company with annual, sales-led contracts would be a significant outlier warranting immediate investigation into segment, cohort, and reason-code data. If the 20% is a monthly rate rather than annual, that is a different and far more serious situation at any stage, since it compounds to over 90% annual customer loss and points to a structural product-market fit or onboarding failure that needs to be diagnosed immediately by reason code.