
Dollars lie; logos don't. In early-stage SaaS, an expansion-heavy NRR can easily paper over a product that users are abandoning. Logo retention rate is the ultimate truth-teller—it strips away expansion revenue to show you exactly how many customers actually find value in your software. If you aren't tracking customer counts separately from contract values, you're looking at a distorted cap table.
This article gives you the full picture: what logo retention rate measures, how to calculate it correctly, what benchmarks apply to your stage and segment, how it connects to NRR and GRR, and what decisions it should actually inform.
Key takeaways
- Logo retention rate counts the percentage of customers who renew. NRR measures the percentage of revenue retained. These are different questions with different answers.
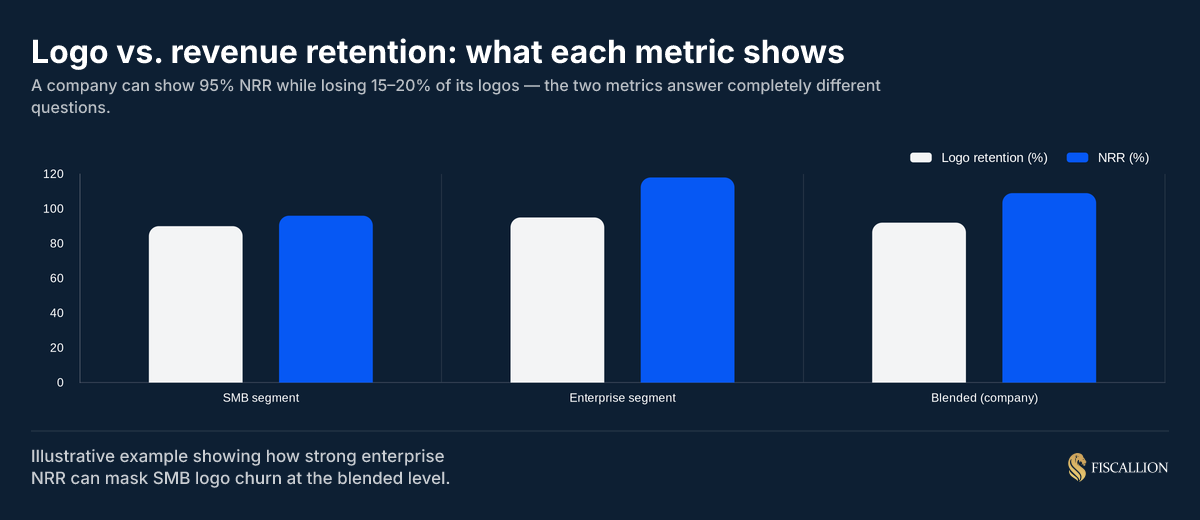
- Strong NRR can actively mask logo churn - especially when one or two large enterprise accounts generate enough expansion to offset significant losses in an SMB segment.
- The median logo retention rate for private B2B SaaS companies sits around 85%, but that number is nearly meaningless without segmenting by customer size, ACV, and acquisition channel.
- A 5% annual logo churn rate is a reasonable benchmark for enterprise-focused SaaS. For SMB-focused companies, 10-15% annual logo churn is common and does not automatically signal a problem.
- Logo retention becomes the more informative metric when ACV is below $10K. Above $10K ACV, gross revenue retention (GRR) is a stronger decision tool - but you need both.
What logo retention rate actually measures
Logo retention rate measures the percentage of customers who were active at the start of a period and are still active at the end. It is a count-based metric. Revenue is irrelevant to the calculation.
The formula:
Logo retention rate = (Customers at end of period who were customers at the start) / (Customers at start of period) × 100
If you started January with 200 customers and ended with 174 of those same customers (not counting new customers acquired during the month), your logo retention for the period is 87%.
The inverse is logo churn rate:
Logo churn rate = 1 - Logo retention rate
87% logo retention = 13% logo churn for the period.
That relationship is important because logo churn is the number investors often challenge first in SMB-motion businesses - where individual accounts are small but their departure signals product-market fit problems faster than revenue churn does. OpenView Partners frames logo (customer) churn as foundational precisely because it reveals whether your product is providing genuine value to the customers you are targeting - not just to the largest ones writing the biggest checks.
Why "logo" matters as terminology
The term "logo" refers to a customer account - a distinct legal or billing entity. In enterprise sales, it is literally the company's logo on your customer list. In SMB SaaS, it is a subscription or billing seat at the account level.
Define your boundary early: specify whether losing a subsidiary while retaining the parent entity counts as a churned logo, then apply that rule universally. Whatever you decide, write it down and apply it consistently.
Logo retention vs. NRR vs. GRR - understanding which metric answers which question
These three metrics are not interchangeable. They answer different questions and fail in different directions. Using only NRR - which most boards default to - is how structural retention problems hide for 12 to 18 months.
The failure mode that only logo retention catches: expansion from a handful of large accounts masking significant customer losses in a smaller segment.
Relying strictly on high revenue metrics can create a dangerous blind spot where massive customer erosion goes unnoticed until it threatens top-line stability. A clear example of this dynamic highlights the hidden vulnerability of concentration risk:
Consider this example. A company has two segments - SMB and enterprise. It starts the year with 1,000 SMB customers and 50 enterprise accounts.
- SMB logo retention: 90% - they kept 900 of 1,000 customers
- Enterprise logo retention: 96% - they kept 48 of 50 accounts
- Enterprise NRR: 118% - the enterprise accounts expanded heavily
Blended NRR: 109%. Looks strong. But 100 SMB customers walked out the door. The NRR number did not catch it because the enterprise expansion more than offset the SMB revenue loss.
This masking effect is well-documented. As SaaStr's Jason Lemkin has noted, high NRR can also hide a lot of problems — particularly when growth from upsells substitutes for the harder work of acquiring and keeping net new logos. Pre-IPO investors have increasingly shifted their scrutiny toward GRR and logo retention precisely because NRR alone can be engineered upward while underlying account health erodes.
This is why Fiscallion builds segment-level logo retention tables separately from blended NRR when reviewing a company's retention health. The SMB segment is almost always the early warning system - and it is almost always the segment where blended NRR is most misleading.
How to calculate logo retention correctly
The formula is simple. Getting the inputs right takes more discipline.
The correct formula
Logo retention rate = (Customers at end of period who were present at the start of the period) / (Total customers at the start of the period) × 100
Critical: do not count new customers acquired during the period in the denominator or numerator. Logo retention is a cohort metric. You are measuring what happened to the customers you had - not how many new ones you added.
What counts as a customer
Define this precisely before you calculate anything:
- Only include paying customers with an active subscription or contract
- Exclude free trial users, freemium accounts, and pilots that have not converted
- If you have usage-based pricing with variable usage, define the threshold below which a customer is considered inactive (e.g., zero paid transactions for 45+ days)
What counts as churn
This is where most teams introduce inconsistency:
- A customer whose renewal lapses by three days due to procurement timing - churned or not?
- A customer who cancels but reactivates within 30 days - does the gap count?
- A subsidiary that closes but the parent continues - is that churn?
Write down a single definition in one sentence. Apply it to every period, every segment, every cohort. If the definition changes, document the change and note the period it took effect. Definitional drift is one of the most common sources of retention metric confusion during investor diligence.
Calculation period: monthly vs. annual
For subscription SaaS, calculate logo retention both monthly and annually:
- Monthly logo retention: tracks immediate signals - good for identifying activation failure and early churn
- Annual logo retention: the benchmark standard most investors use; smooths out timing noise from delayed renewals
Annual logo retention formula:
(Customers at December 31 who were customers at January 1) / (Customers at January 1) × 100
Segment it or it tells you nothing
A blended logo retention rate represents no actual customer. Calculate it separately for:
- Customer size tier (SMB, mid-market, enterprise)
- Acquisition channel (inbound, outbound, PLG, referral)
- Plan or product line
- Cohort vintage (customers who started in the same quarter)
The variance between segments is where the actionable signal lives.
2025 logo retention benchmarks by ARR stage and segment
The closest available benchmark data for private B2B SaaS comes from RevOps Squared's B2B SaaS Benchmarks report and SaaS Capital's annual private company surveys. SaaS Capital's methodology follows a cohort of customers over time — the correct way to measure retention — and covers a broad cross-section of private B2B companies above $1M ARR.
By ARR band
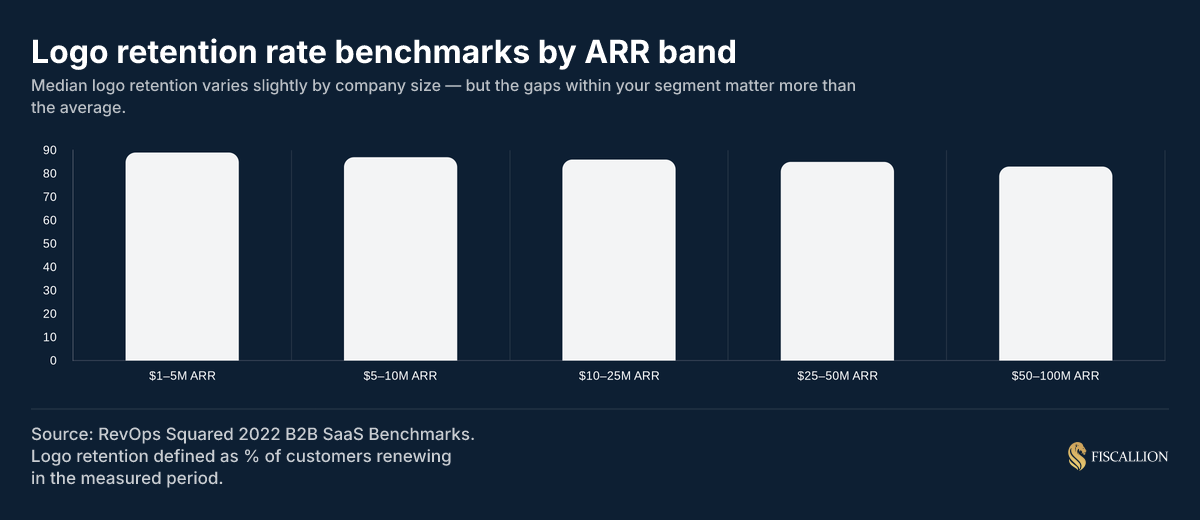
Source: RevOps Squared 2022 B2B SaaS Benchmarks. Note that logo retention rates have not changed dramatically from 2022 to 2025 according to subsequent SaaS Capital surveys - the medians remain broadly stable, while within-segment variance has grown.
By customer segment and ACV
ACV is a stronger predictor of what "good" looks like than ARR stage alone. SaaS Capital's 2025 data confirms this: the relationship between ACV and retention is more predictive than ARR band, because companies sharing a similar price point go to market similarly, support customers similarly, and face similar switching cost dynamics.
A 5% annual logo churn rate (95% logo retention) is strong for any segment. For enterprise, it is average. For high-velocity SMB, it would be exceptional and worth investigating whether it reflects a pricing model that prevents customers from leaving rather than genuine retention.
SaaStr puts the best-of-breed benchmarks at 80%+ logo retention for SMBs, 90% for mid-market, and 95% for enterprise — with ServiceNow at 99% logo renewal on primarily $1M+ ACV enterprise contracts setting the outer edge of what sustained retention looks like at scale.
When logo retention matters more than GRR
Logo retention is the more useful primary metric when:
- ACV is below $10K and individual accounts are roughly uniform in size
- You are diagnosing an ICP fit problem rather than a revenue problem
- You are tracking acquisition channel quality (which channels produce customers who stay)
- You need to surface concentration risk: is one large account doing the expansion heavy lifting?
When GRR becomes the stronger decision tool:
- ACV exceeds $10K and account sizes vary significantly
- You are making pricing, packaging, or expansion investment decisions
- You are preparing for investor diligence where revenue-based benchmarks apply
The right answer at most stages: track both, segment both, and use logo retention to check whether your NRR is hiding customer losses.
Is a 5% churn rate good? It depends entirely on the timeframe and segment
This is one of the most context-dependent questions in SaaS metrics. The answer requires three clarifications before the number means anything.
Monthly vs. annual churn
A 5% monthly churn rate is a serious problem for almost any SaaS business. That translates to roughly 46% annual customer loss. At that rate, you are replacing nearly half your customer base every year, which means your CAC spend is running to stay in place rather than compound growth.
A 5% annual churn rate is solid performance across most B2B SaaS segments. It translates to 95% annual logo retention.
Segment context
- For enterprise SaaS (ACV > $100K): 5% annual logo churn is approximately the 50th percentile. Top-quartile enterprise SaaS maintains 3-4% annual logo churn.
- For mid-market SaaS (ACV $25K-$100K): 5% annual logo churn is strong - top-quartile territory.
- For SMB SaaS (ACV < $25K): 5% annual logo churn is exceptional and worth investigating whether it reflects a pricing model that prevents customers from leaving rather than genuine retention.
- For high-velocity PLG or very low-ACV SaaS (ACV < $5K): 5% annual churn is excellent by any comparison.
The decision it should drive
A 5% annual churn rate should not trigger alarm in most cases. The more important question is whether churn is concentrated - in a specific cohort vintage, acquisition channel, customer segment, or plan tier. Evenly distributed 5% churn is manageable. Concentrated churn in your newest cohorts at 5% monthly is a different problem with a different cause.
Track the shape of churn, not just the headline rate.
How the 3-3-2-2-2 rule and Rule of 40 connect to logo retention
These two frameworks get invoked constantly in board meetings and fundraising conversations. Understanding where logo retention fits into both gives you a clearer picture of why the metric matters beyond the headline number.
What is the 3-3-2-2-2 rule of SaaS?
The 3-3-2-2-2 rule is a revenue growth benchmark for venture-backed SaaS companies. Starting from approximately $1M ARR, it maps a path to $100M+ ARR over five to six years by tripling revenue for two years, then doubling it for three:
- Year 1: 3x growth - $1M to $3M ARR
- Year 2: 3x growth - $3M to $9M ARR
- Year 3: 2x growth - $9M to $18M ARR
- Year 4: 2x growth - $18M to $36M ARR
- Year 5: 2x growth - $36M to $72M ARR
It evolved from the earlier T2D3 framework (triple, triple, double, double, double starting at $2M ARR), which assumed heavier capital deployment and accepted longer CAC payback periods. The 3-3-2-2-2 model is more capital-efficient by design and better suited to the post-2022 funding environment where growth efficiency is weighted more heavily. Bessemer Venture Partners' Scaling to $100 Million documents this trajectory in detail as the growth profile observed at the top tier of venture-backed SaaS companies.
Where logo retention connects: You cannot hit the 3-3-2-2-2 growth curve if logo retention is poor. At a 3x growth target, new logo acquisition carries most of the ARR growth. But high logo churn forces acquisition to subsidize replacement before it compounds. A company tripling revenue while churning 20% of its customers annually is burning CAC on a leaky bucket - payback periods extend, gross margin compresses, and the model becomes harder to defend in diligence.
The 3-3-2-2-2 rule works best when logo retention is strong enough that each cohort holds and expands. That is why SaaS Capital's research consistently shows the fastest-growing private SaaS companies combine high NRR with strong underlying GRR and logo retention - not just headline growth rate. You can go deeper on how this trajectory connects to capital efficiency in Fiscallion's ARR growth rate benchmark guide.
Note: this framework applies specifically to venture-backed SaaS pursuing aggressive growth. For bootstrapped companies or those targeting profitable, sustainable scaling, the rule is a useful reference point - not a required trajectory.
What is the Rule of 40 for SaaS?
The Rule of 40 combines revenue growth rate and profit margin into a single composite score:
Rule of 40 = Revenue growth rate (%) + EBITDA margin (%)
A score at or above 40 signals that the company is balancing growth and profitability effectively. A company growing at 35% with 10% EBITDA margins scores 45 - above the threshold. A company growing at 50% while running at -15% EBITDA margin also scores 35 - just below.
According to SaaS Capital's 2025 analysis of private B2B SaaS companies, Rule of 40 scores have contracted over the past two years, primarily driven by slowing growth rates. Bootstrapped companies still outperform equity-backed companies on this metric, but the gap is narrowing as equity-backed companies reduce burn. For a full treatment of the formula, quartile benchmarks, and what the number actually drives, see Fiscallion's guide to the Rule of 40 in SaaS.
Where logo retention connects to Rule of 40: Logo retention feeds both sides of the equation. High logo retention reduces the CAC spend required to maintain revenue, which improves margin. It also enables net revenue expansion through upsells into retained accounts - which contributes to the growth side without requiring proportional new acquisition spend. Companies with genuinely strong logo retention tend to have better Rule of 40 scores not because they are growing faster, but because they are not spending as much to stay in place.
An alternative framework - the Rule of X - weights growth at 2x relative to profitability. Under Rule of X, the same company growing at 25% with -10% EBITDA scores 40 (25×2 - 10), compared to a Rule of 40 score of 15. This reweighting benefits companies with strong growth metrics, including those with high logo retention driving strong ARR compounding.
What is the 10x rule in SaaS?
The 10x rule in SaaS most commonly refers to the LTV:CAC ratio benchmark. The general principle: customer lifetime value should be at least 3x CAC at minimum, with 10x being exceptional performance that commands premium investor multiples.
The specific math:
LTV = (Average MRR per customer × Gross margin %) / Monthly churn rate
If average MRR per customer is $2,000, gross margin is 75%, and monthly churn rate is 1.2%:
LTV = ($2,000 × 0.75) / 0.012 = $125,000
If CAC is $12,500, LTV:CAC = 10:1 - exceptional.
Where logo retention connects to LTV:CAC: Monthly logo churn rate is the denominator in the LTV calculation. Even a 0.3 percentage point improvement in monthly logo churn rate - from 1.5% to 1.2% - increases LTV by 25% with everything else held constant. That is not a small effect. It directly changes CAC ceiling calculations, payback period targets, and how aggressively you can grow acquisition spend. Fiscallion's guide to SaaS unit economics covers the full LTV formula, gross margin adjustments, and how to treat LTV as a range across cohort vintages rather than a single blended number.
The 10x LTV:CAC target is aspirational for most SaaS companies. The 3x benchmark is the practical floor investors use to assess whether unit economics are defensible. For companies in the $5M-$50M ARR range, a 3-5x LTV:CAC with a clear path to expansion is more useful than a 10x ratio built on assumptions that do not hold at scale.
Worth noting: like any blended ratio, a single LTV:CAC number hides more than it reveals. The Fiscallion approach is to treat LTV:CAC as a range across cohort vintages, not a single company-level figure - the same discipline that applies to NRR and logo retention.
What to do with your logo retention number: actions by owner
Once you have a clean logo retention number - segmented by customer tier, acquisition channel, and cohort vintage - here is the sequence of decisions it should drive.
1. Identify whether churn is concentrated or distributed (owner: finance or CEO)
Pull cohort-level logo retention for the last eight quarterly vintages. If the worst three cohorts are all from the same period, same channel, or same plan, you have a localized problem - not a product problem. The fix is targeted.
If churn is evenly distributed across all vintages, that signals a structural issue: ICP misfit, product depth, or pricing misalignment.
2. Audit the acquisition-to-retention connection (owner: finance + marketing)
Run logo retention separately by acquisition channel. Channels with 30%+ lower M12 logo retention than your best-performing channel are producing customers who do not stay.
Diagnosing why a particular channel underperforms requires checking exactly when the drop-off happens, as early usage drop-off signals a product or setup failure, while late-stage attrition points to bad sales targeting. The timeline of the churn reveals the true root cause.
Assign CAC payback calculations separately for each channel. Channels where payback period exceeds your target and retention is below median should receive reduced budget in the next planning cycle. The SaaS magic number is a useful companion here: a channel with a weak magic number and below-median logo retention is a double signal that acquisition spend is misallocated.
3. Check whether NRR is masking logo churn (owner: CEO or CFO function)
Build a segment-level table: logo retention by segment next to NRR by segment. If blended NRR exceeds 100% but logo retention in your SMB segment is below 82%, your enterprise expansion is subsidizing SMB acquisition that is not working. That is a capital allocation problem - not a retention success.
4. Use logo churn rate to set the LTV floor and CAC ceiling (owner: finance)
Recalculate LTV using your actual cohort-specific monthly churn rates - not a blended average. Then apply the 3x CAC ceiling per segment. Any acquisition channel spending above that ceiling is buying growth at a structural loss. This is the connection most growth-stage teams miss: logo retention is an input into your CAC budget, not just a customer satisfaction metric. Bessemer's CFO playbook makes the same point: metrics should drive decisive action, not just report history — and a retention input that isn't connected to CAC ceiling decisions is doing half the job.
5. Build logo retention into your runway model (owner: finance)
Replace flat monthly churn assumptions in your 18-month model with cohort decay curves. Most SaaS companies lose significantly more customers in months 1-3 than months 9-12. A flat churn assumption overstates near-term revenue and understates the compounding effect of early retention failure. The runway correction from using actual cohort decay curves is often more significant than the correction from more conservative growth assumptions.
6. Report logo retention alongside NRR in board decks (owner: CEO)
A board deck that shows only NRR is reporting history. Show NRR alongside logo retention by segment. Then frame the decision: if SMB logo retention is declining, the trade-off is between investing in customer success coverage to improve SMB retention, or deliberately contracting the SMB motion and concentrating on mid-market where retention is structurally stronger. That is a trade-off worth discussing. Pure NRR reporting does not surface it.
7. Set a named owner for the logo retention assumption in your model (owner: CEO)
Every input in your financial model should have a named owner. Logo retention - and the underlying churn definition it depends on - is one of the most consequential inputs in an ARR model. Someone should own it, review it monthly, and be able to explain the three most significant changes since the last review. If no one owns it, it is a lagging indicator with no correction mechanism.
Common mistakes and replacement moves
Mistake: calculating logo retention on signups instead of paying customers
What happens: free trial signups, freemium accounts, and pilots that never converted inflate your denominator. Your logo retention looks higher than it is because many of those accounts never had genuine churn risk.
Replacement move: calculate logo retention only on customers with an active paid subscription or contract. Track free trial conversion separately - it is a different metric with a different decision outcome.
Mistake: using a blended logo retention rate with no segment breakdown
What happens: you report 87% annual logo retention to the board. That number is an average of 93% enterprise retention and 78% SMB retention. The company is quietly losing SMB customers at a rate that will compound materially over 24 months - but the blended number creates a false sense of stability.
Replacement move: segment by customer size tier at minimum. If you have more than 200 customers and meaningful segment diversity, run separate tables for SMB and non-SMB. The decision is in the difference, not the average.
Mistake: treating logo retention as a customer success KPI only
What happens: logo retention sits in a CS dashboard and gets reviewed by the customer success team. Finance uses NRR. No one connects the two. The structural risk stays invisible until NRR deteriorates.
Replacement move: include logo retention in your monthly finance review alongside NRR and GRR. Build the connection explicitly: logo retention feeds the LTV calculation, which feeds the CAC ceiling, which feeds the acquisition budget model. When the CS team improves logo retention, quantify the downstream financial impact. That connection changes the priority that improvement receives. For more on how to structure deferred revenue and cohort accounting correctly alongside these metrics, see Fiscallion's guide to deferred revenue in SaaS.
Mistake: not connecting logo retention changes to cohort vintages
What happens: overall logo retention deteriorates from 88% to 83% over three quarters. You try to fix it by increasing customer success headcount. The real problem is that a specific cohort from 14 months ago - acquired through a paid channel that was later shut down - is hitting annual renewal and not renewing at high rates. The CS investment does not address the cause.
Replacement move: before any retention intervention, isolate which cohort vintages are driving the decline. Pull retention rates by quarterly cohort for the last 12 cohorts. The deterioration will usually be concentrated in one to three vintages. Those vintages share an acquisition period, a sales motion, or a product version - and that is where the fix lives.
Mistake: changing the churn definition mid-year without documenting it
What happens: finance updates the billing system query that feeds the logo retention calculation. The new query excludes a category of customers that was previously included. Logo retention jumps by 3 percentage points. Everyone celebrates without realizing the improvement is definitional.
Replacement move: document your churn definition in plain English in the model itself. Log any definition changes with the date and the effect. When presenting retention data to investors, disclose the definition and note any changes in methodology. Definition clarity is a professional marker - investors who have done serious SaaS diligence will ask for it.
Your logo retention dashboard outline
You do not need a full BI stack to track this. A spreadsheet with clean billing exports is enough to start. Here is the structure that gives you decision-grade visibility.
Tab 1 - Core logo retention table
- Rows: monthly or quarterly cohort vintages
- Columns: M0, M3, M6, M12, M18, M24
- Cell value: % of cohort still active in that period
- Color code: red below 75% in M3, green above 90%
- Data source: billing system export, first-payment date as cohort anchor
Tab 2 - Segment comparison
Tab 3 - Monthly review checklist
- Any new cohort at M3 below 75% retention?
- Has any segment's logo retention moved more than 3pp since last month?
- Does the blended logo retention align with GRR trends, or is there a divergence?
- Which acquisition channel had the lowest M12 logo retention in the trailing three cohorts?
- What changed in the go-to-market or product before the worst-performing cohort started?
Tab 4 - LTV and CAC ceiling recalculation
Using your actual segment-level monthly churn rates (not blended), calculate:
- LTV per segment = (Average MRR × Gross margin %) / Monthly logo churn rate
- CAC ceiling per segment = LTV / 3 (minimum defensible) to LTV / 5 (target)
- Compare to actual CAC per acquisition channel to identify out-of-ceiling spend
Review this quarterly. If a channel's CAC is above the ceiling for its segment, cut or reallocate before the next planning cycle.
Logo retention is not the headline metric in most board conversations. NRR gets that position. But logo retention is the metric that checks whether the NRR story holds up - or whether expansion from a few accounts is papering over a customer base that is eroding underneath.
At Fiscallion, we build this layer into every retention model we work on: not as a separate customer success exercise, but as an FP&A input that feeds the LTV calculation, the CAC ceiling, and the runway model. The goal is decision-grade clarity, not dashboard completeness.
If you want to audit your current retention definitions and build a segmented logo retention model against your actual customer data, that is a good place to start.
Unmask your retantion data
Logo retention rate answers the one question NRR does not: how many customers did you actually keep?
At the $5M-$50M ARR stage, that question matters more than most teams give it credit for. NRR is the right primary metric for investor conversations. But logo retention is the right check on whether NRR is telling the whole story.
The benchmarks give you a starting point. Median annual logo retention across private B2B SaaS sits around 85-87%, varying modestly by ARR stage. But the decision-useful version of this metric is not the blended number - it is the segment-level breakdown that shows you whether your SMB motion is working, whether your acquisition channels produce customers who stay, and whether your LTV assumptions are grounded in actual churn rates or convenient averages.
Build the table. Segment it. Review it monthly alongside NRR and GRR. Name an owner for the inputs.
That combination - not any single metric in isolation - is what gives you a retention picture you can make decisions from.
