

Most SaaS companies track ARR growth rate. Very few use it correctly as a benchmark - because they compare themselves to the wrong peer group, calculate the wrong number, or reach for a universal threshold that does not exist.
A 30% YoY ARR growth rate can signal strong performance at $30M ARR and underperformance at $3M ARR. Context is everything: your ARR band, funding type, and NRR profile all change what good means. Without those anchors, the number tells you almost nothing useful.
This article gives you the actual benchmarks by ARR band and stage, explains how to calculate your ARR growth rate correctly, unpacks the 3-3-2-2-2 rule and what it demands from your trajectory, and walks through the most common ways founders misread their own growth rate.
Key takeaways
- ARR growth rate benchmarks are stage-specific. Median growth for private B2B SaaS companies at $5M–$20M ARR is approximately 30%. At $20M–$50M ARR, that drops to 20–25%. Applying the wrong peer group produces false confidence or false panic.
- The 3-3-2-2-2 rule is a venture-scale trajectory target, not a universal standard. It describes triple-triple-double-double-double ARR growth from $1M, reaching $72M over five years.
- Growth rate deceleration is expected. Declining absolute ARR added is the real warning signal. Watch net new ARR per quarter, not just the percentage.
- NRR is the most underrated lever in ARR growth. SaaS Capital's 2025 data shows companies with NRR above 110% report median growth 83% higher than the overall population median.
- Your board wants to know if the growth rate is durable. A single YoY number does not answer that. Growth decomposition into new ARR, expansion ARR, churned ARR, and contraction ARR does.
What we will cover
- How to calculate ARR growth rate correctly
- ARR growth rate benchmarks by ARR band
- What good growth looks like at Series A, B, and C
- Is 30% revenue growth good?
- The 3-3-2-2-2 rule explained
- The NRR–growth connection most founders underweight
- How to decompose your ARR growth for board conversations
- Common mistakes and the replacement moves
How to calculate ARR growth rate correctly
The formula is straightforward. The inputs are where most companies introduce errors.
YoY ARR growth rate = (Current ARR - ARR 12 months ago) / ARR 12 months ago x 100
Example: ARR is $18M today and was $12M twelve months ago.
($18M - $12M) / $12M x 100 = 50% YoY ARR growth
The two inputs that get corrupted most often
Mixing ARR with GAAP revenue is the first common error. ARR and recognized revenue diverge when you have significant deferred revenue, annual upfront payments, or a material services component. For a detailed breakdown of where that divergence hits hardest, see deferred revenue in SaaS. Always calculate ARR growth on your contracted recurring revenue base, not your income statement revenue line.
Using MoM or QoQ rates annualized is the second. If you grew 7% in Q1 and annualize it to 28%, that is not the same as 28% YoY ARR growth. Investors will calculate TTM ARR growth from your actual figures. Present the trailing twelve-month number.
Compound monthly growth rate: the more honest metric at early stage
Before $10M ARR, your YoY ARR growth rate is highly sensitive to lumpy months. A single large enterprise deal can swing it by 20+ percentage points. CMGR smooths that out.
CMGR = (Ending ARR / Starting ARR)^(1 / number of months) - 1
Example: $2M ARR to $4M ARR over 12 months. (4/2)^(1/12) - 1 = 5.9% CMGR, equivalent to 100% YoY growth. Both numbers are correct - they answer different questions. Investors doing Series A diligence will often ask for 6-month CMGR because it is harder to dress up with one large deal month. For a full treatment of what ARR actually measures and where its inputs break down, see annual recurring revenue: definition, calculation, and what it actually tells you.
ARR growth rate benchmarks by ARR band
The most useful benchmark data comes from SaaS Capital's annual survey of more than 1,000 private B2B SaaS companies. Their 2025 report found the overall median growth rate at 25% - down from 30% in 2023. Segmented by ARR band, the picture is far more actionable.
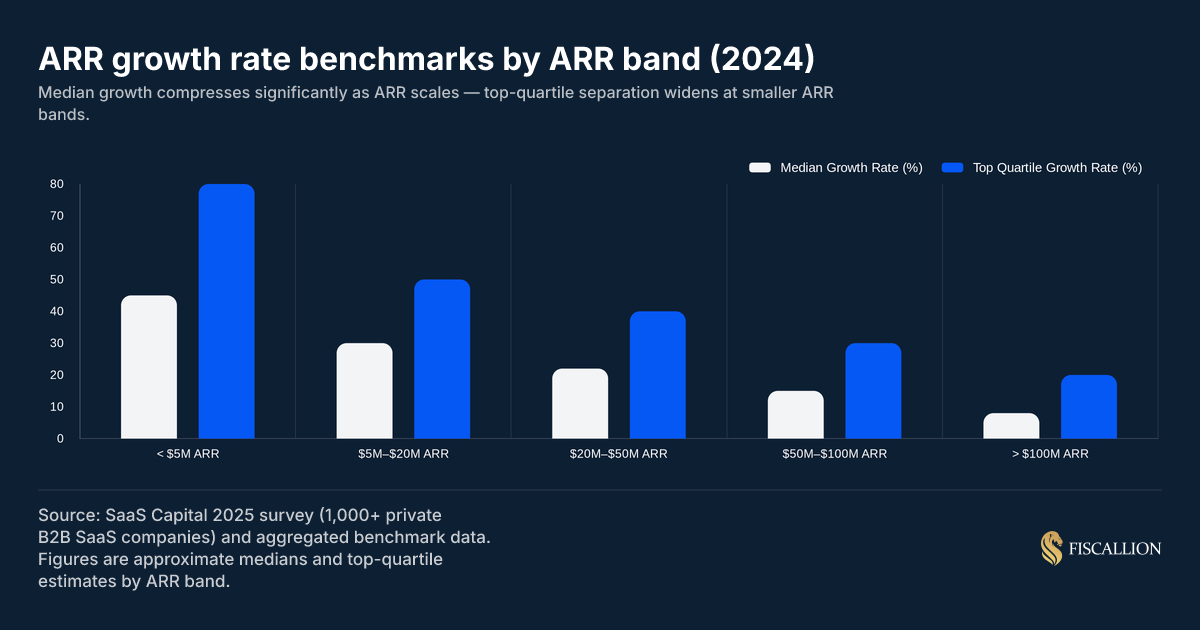
Source: SaaS Capital 2025 survey (1,000+ private B2B SaaS companies) and aggregated benchmark data.
Three patterns in this data that matter for decisions.
Top-quartile companies at each band grow roughly 2x the median. If you are at the median rate for your ARR band, you are not in a strong position heading into your next fundraise. Investors fund the right side of the distribution.
Growth deceleration by band is expected and healthy. A company moving from $5M to $20M ARR should expect its YoY growth rate to compress. The question is whether absolute ARR added per quarter is still increasing.
Bootstrapped vs. equity-backed diverges. SaaS Capital's 2025 data shows equity-backed companies at 25% median growth versus 23% for bootstrapped peers. Bootstrapped companies trade lower capital availability for better cost discipline - and that discipline increasingly shows up in the efficiency metrics investors now weight alongside raw growth.
What good growth looks like at each stage
Series A ($1M–$5M ARR): the growth rate has to be high
At Series A, a company in the $1M–$5M ARR band should be growing at 80–150% or more. The absolute ARR base is small enough that tripling is achievable if product-market fit is real. Investors at this stage are pattern-matching for 3-3-2-2-2 trajectory potential.
A company growing 120% with 85% GRR is in worse shape than one growing 90% with 95% GRR. Growth rate at Series A without retention context is incomplete information. ChartMogul's 2025 SaaS Growth Report, which analyzed thousands of SaaS businesses, confirms that retention quality is a stronger predictor of long-run ARR trajectory than new logo growth rate alone.
Series B ($5M–$20M ARR): 30–50% is the target range
Top-quartile companies are at 50%+ YoY growth. The median sits around 30%. A company at $10M ARR growing at 30% adds $3M net new ARR in a year. At 50%, it adds $5M. That $2M difference compounds forward materially, and investors doing Series B diligence price that gap into valuation.
At this stage, the rule of 40 score starts to matter. If your growth rate is 30% and you are running at -35% EBITDA margin, your rule of 40 score is -5 - a number that requires a strong trajectory narrative to overcome in a Series B process. McKinsey's research on the Rule of 40 found that SaaS companies scoring above 40 delivered roughly twice the total shareholder return of those that did not. For a full decision framework on how the metric works at $5–50M ARR, see SaaS unit economics: the complete guide to CAC, LTV, payback period, and the Rule of 40.
Series C ($20M–$50M ARR): 20–40% with an efficiency story
Top-quartile companies are at 40%+ growth, which requires either very high NRR, strong new logo acquisition, or both. The median of 20–25% sets you up for a Series C that will demand an efficiency story: burn multiple, NRR, gross margin, and CAC payback will all be scrutinized.
At Fiscallion, the companies we work with at this stage often find that their growth rate looks reasonable on paper but falls apart under decomposition. When you separate new ARR from expansion ARR and isolate churned and contracted ARR, the real story emerges - including whether growth is coming from a healthy engine or a leaky bucket.
Fundraising benchmarks by stage
For a comprehensive breakdown of what investors scrutinize at each of these stages, see due diligence checklist for startups: the CFO-level guide to passing investor scrutiny.
Is 30% revenue growth good?
The direct answer: it depends on where you are.
At $30M ARR, 30% YoY growth puts you at approximately the median for private B2B SaaS at your scale - reasonable performance, but not the growth profile that generates premium SaaS valuation multiples. Top-quartile companies at $30M ARR are closer to 40–50%.
At $5M ARR, 30% YoY growth is weak. The median at that band is 40–50%. 30% at $5M ARR signals that either market demand is limited, the go-to-market motion has not scaled beyond the first cohort of customers, or churn is offsetting new customer additions.
At $75M ARR, 30% YoY growth is strong. The median at that scale is around 15%, and 30% puts you in top-quartile territory.
The answer to "is 30% good?" is always another question: good relative to what peer group?
Two additional factors change the interpretation of any growth rate.
Funding type changes the context. A bootstrapped company growing 30% at $10M ARR is allocating that growth from internally generated cash. An equity-backed company posting the same 30% while burning $400K per month has identical percentage performance with very different unit economics.
NRR changes the picture entirely. A company with 115% NRR growing at 25% is in materially better shape than a company with 90% NRR growing at 35%. The high-NRR company is compounding an expanding base. The low-NRR company is churning 10% of its ARR annually and covering it with new customer acquisition. The 35% looks better until you model what happens when new logo acquisition slows. The mechanics of how churn erodes a growth rate are covered in depth in customer churn rate in SaaS: how to calculate, interpret, and act on it.
The 3-3-2-2-2 rule: what it actually demands
The 3-3-2-2-2 rule describes the growth trajectory that characterizes the fastest-scaling venture-backed SaaS companies. Starting from approximately $1M ARR, the target is:
- Year 1: 3x growth - $1M to $3M ARR
- Year 2: 3x growth - $3M to $9M ARR
- Year 3: 2x growth - $9M to $18M ARR
- Year 4: 2x growth - $18M to $36M ARR
- Year 5: 2x growth - $36M to $72M ARR
The framework is grounded in research from Bessemer Venture Partners' Scaling to $100 Million, which maps the growth profiles observed at companies that successfully scaled to $100M ARR and beyond. It reflects the growth pattern of the top tier of venture-backed SaaS, not the median.

The YoY growth rates implied by each step
The tripling years require 200% YoY ARR growth. That is not a company posting 30% at $3M ARR. It is a company adding $6M net new ARR in a single year from a $3M base - which typically means both low churn and strong new logo acquisition operating simultaneously.
What the rule tells you about your current position
For most companies, tripling in 12 months is not achievable - and that is not a failure. The 3-3-2-2-2 rule is the benchmark for the top handful of percent of venture-backed SaaS companies. It is not a median expectation.
Where it becomes useful: as a calibration tool when making headcount, go-to-market, and capital deployment decisions. A company that cannot plausibly reach 3-3-2-2-2 milestones should be thinking harder about capital efficiency, payback period, and sustainable growth rates rather than replicating the spending patterns of companies on a fundamentally different trajectory.
Is the 3-3-2-2-2 rule still relevant?
The framework is still referenced by investors, but the environment has changed. Post-2022, the emphasis on capital efficiency has shifted the trade-off. Bessemer Venture Partners introduced the Rule of X as an evolution of the Rule of 40, explicitly weighting growth more heavily than margin — a direct response to the observation that tripling ARR while burning aggressively is a much harder story today than it was in 2021.
The practical update: aim for the 3-3-2-2-2 trajectory, but track burn multiple alongside it. If your burn multiple is above 2x during the tripling years, you are spending more than the growth justifies.
Chasing explosive, triple-digit growth milestones without a watchful eye on capital efficiency is a dangerous carryover from past market cycles. Modern growth investors view an over-indexed burn rate with heavy skepticism, meaning top-line growth can easily become a fundraising liability if the underlying unit economics don't hold up.
The NRR-growth connection most founders underweight
SaaS Capital's 2025 research found that companies in the highest NRR bracket (110%+) report median growth that is 83% higher than the overall population median.
NRR compounds the base. A company with 115% NRR adds 15% to its ARR from existing customers before acquiring a single new logo. At $10M ARR, that is $1.5M in expansion ARR per year. A company with 90% NRR loses $1M from its $10M base before new customer acquisition covers the churn hole. The mechanics of how expansion revenue is built and measured are covered in detail in Expansion MRR: definition, formula, benchmarks, and what to do with it.
At Fiscallion, we treat NRR as one of three inputs that determine whether a growth rate is durable - the other two being CAC payback period and gross margin. A company growing at 40% with strong NRR, a sub-18-month CAC payback, and 75%+ gross margin is building a compounding machine. A company growing at 40% with 88% NRR, a 28-month payback, and 65% gross margin is running a treadmill.
The growth rate looks the same. The underlying quality does not. High Alpha and OpenView's 2024 SaaS Benchmarks Report makes this concrete: companies with NRR above 106% and CAC payback under 10 months post a median growth rate of 71% — versus 10% for companies with NRR below 98% and payback above 15 months. Same percentage growth headline; radically different unit economics underneath.
How to decompose your ARR growth for board conversations
A single YoY ARR growth percentage on a board slide does not answer "what do we do next?" It reports history. Decision-ready reporting requires decomposition.
Net new ARR = New logo ARR + Expansion ARR - Churned ARR - Contracted ARR
Break each component out quarterly and track the trend:
In this example, total ARR growth is slowing - but the new logo engine is still functioning. The problem is on the retention side: churn and contraction are both accelerating. The fix is not a sales investment; it is a retention and expansion investment. SaaS cohort analysis is the tool that surfaces exactly which customer segments are driving that churn acceleration — and which ones are not.
Three questions the decomposition must answer
Where is growth coming from? If 80% of your net new ARR is new logos and 20% is expansion, your growth engine is entirely dependent on sales. That is a concentration risk.
What is the churn trend doing to your ARR base? If churned ARR is growing faster than new ARR, your growth rate will compress regardless of sales performance.
Is expansion revenue growing as a percentage of net new ARR? As you scale, expansion should contribute more. Companies with strong expansion motions require less sales spend to sustain ARR growth.
Common mistakes and the replacement moves
Relying on top-line growth metrics without accounting for vintage, cohort variance, or capital consumption often masks underlying scaling friction. Reviewing these common benchmarking missteps ensures your growth trajectory withstands board-level analysis and strategic planning.
Benchmarking against public company growth rates
The $1B+ public SaaS companies that appear in growth benchmarking articles grew at their headline rates during market windows that no longer exist. McKinsey's research on efficient growth in software confirms that growth-rate compression at scale is structural, not cyclical - making public company comparisons actively misleading for sub-$100M ARR companies.
Replacement: Use private company cohort data by ARR band. SaaS Capital's annual survey is the most reliable source. Your relevant peer group is private companies at your ARR band and funding type.
Reporting a single YoY ARR number without context
A board slide that shows "ARR growth: 38% YoY" tells the board you are tracking the metric. It does not tell them whether growth is accelerating or decelerating, what is driving it, or where the risk is.
Replacement: Report ARR growth alongside the four-component decomposition and show four quarters of trend. The narrative becomes: "Growth was 38% YoY, driven by expansion ARR increasing from 18% to 24% of net new ARR, while new logo adds held flat. Churn rate has ticked up two quarters in a row - that is the watch item."
Using growth rate deceleration as the only warning signal
Growth rates naturally decelerate as the ARR base grows. The warning signal is not the declining percentage - it is declining absolute ARR added per quarter.
Replacement: Track net new ARR added per quarter as your primary momentum indicator. If net new ARR per quarter is growing, your growth engine is intact even if the percentage is compressing.
Boardrooms frequently overreact to percentage-based growth deceleration, misinterpreting a mathematically natural compression as a fundamental sales crisis. Shifting the primary governance focus to absolute net-new revenue gains alters the executive conversation entirely, transforming a panic over slowing percentages into an expansion playbook.
Treating 25% median growth as the benchmark to match
The median is the midpoint of a distribution, not a pass/fail threshold.
Replacement: Identify your ARR band's top-quartile growth rate and use that as your fundraising benchmark. Use the median as a floor, not a target.
Ignoring growth rate in the context of burn
Growth rate tells you how fast ARR is expanding. Burn multiple tells you what it cost. A company growing 50% at $10M ARR while burning $8M per year (burn multiple 1.6x) is at the same capital efficiency as a company growing 25% while burning $4M (same 1.6x). The growth rates look different; the efficiency is identical. The distinction between burn rate and burn multiple — and why conflating them is one of the most expensive finance mistakes at growth stage — is covered in full in burn rate vs burn multiple: what the difference actually costs you.
Replacement: Present ARR growth rate and burn multiple together. "We are growing at 45% YoY with a 1.3x burn multiple" is a complete statement.
Relying on blended CAC without channel-level attribution
At 40–50%+ growth rates, the mix of where new ARR comes from matters as much as the total. Organic, paid, and partner channels carry different unit economics. A blended CAC that averages across all channels makes efficient channels subsidize inefficient ones — and makes the growth rate look more durable than it is. The full breakdown is in why your blended CAC payback is lying to you.
Replacement: Report new logo ARR by acquisition channel alongside the growth rate. If 60% of new ARR is coming from paid channels with a 24-month payback and 90% NRR, your growth rate has a specific fragility that the percentage alone does not surface.
Your ARR growth rate dashboard: a working outline
Most companies at $5M–$50M ARR are not missing the metrics - they are missing the ownership model. When no one is accountable for the inputs to NRR or the definition of "new logo ARR," the output number is reliable only by accident.
Frequently asked questions
What is a good ARR growth rate?
There is no universal threshold. For private B2B SaaS companies, approximate targets by ARR band are:
- Under $5M ARR: 80%+ YoY to be competitive for Series A; 40–50% is the median
- $5M–$20M ARR: 50%+ to be top quartile; 30% is the median
- $20M–$50M ARR: 40%+ is top quartile; 20–25% is the median
- $50M–$100M ARR: 30% is top quartile; 15% is the median
Benchmark against your ARR-matched peer group, not a universal number and not public company benchmarks. SaaS Capital's 2025 private company survey is the most reliable source for private B2B SaaS benchmarks segmented by ARR band.
Is 30% revenue growth good?
It depends on scale. At $5M ARR, 30% is below the median and would raise questions in a Series A fundraise. At $30M ARR, it is roughly the median - solid but not exceptional. At $75M ARR, 30% puts you in the top quartile. Evaluate growth rate in context: ARR band, NRR, and burn multiple together tell a more complete story than the percentage alone.
What is the 3-3-2-2-2 rule of SaaS?
Starting from approximately $1M ARR, the 3-3-2-2-2 rule targets tripling ARR in Year 1 and Year 2, then doubling in Years 3, 4, and 5 - producing a five-year path from $1M to $72M ARR. The implied YoY growth rates are 200% in the tripling years and 100% in the doubling years. These are the growth profiles observed at the top tier of venture-backed SaaS companies, not the median. The framework is documented in Bessemer Venture Partners' Scaling to $100 Million. A bootstrapped company optimizing for capital efficiency is not on a 3-3-2-2-2 path - and that is a deliberate trade-off, not underperformance.
What is a good benchmark for revenue growth?
For private B2B SaaS companies, the overall median YoY ARR growth rate was approximately 25% in 2024 (SaaS Capital survey, 1,000+ companies). The top quartile was approximately 50%. More useful benchmarks by band: 30% at $5M–$20M ARR (median), 20–25% at $20M–$50M ARR (median), and 50%+ at either band for top-quartile positioning. Use the SaaS Capital annual private company survey as your primary reference - it segments by ARR band, funding type, and NRR cohort.
Calibrating your true venture trajectory
ARR growth rate is the metric that gets reported the most and contextualized the least. The number on its own - without ARR band, funding type, NRR, and burn multiple alongside it - is incomplete information. It tells your board that revenue is increasing. It does not tell them whether the growth is durable, what is driving it, or what decision it implies.
Use the benchmarks in this article to calibrate your position within your actual peer group. Use ARR decomposition to understand which components of growth are working and which are not. Use burn multiple alongside growth rate to understand what the growth is actually costing.
At Fiscallion, the first thing we do with a new client at $5M–$50M ARR is build a clean ARR bridge: new logo, expansion, churn, contraction, and the net result - by quarter, going back eight quarters. In almost every case, the growth rate they have been reporting looks different once the components are visible. The problems become obvious. So do the opportunities.
If your ARR growth rate is a number you report but cannot fully explain, that is the gap worth closing first.
Audit your metrics definitions and forecasting model with Fiscallion - and leave the engagement knowing exactly which inputs are fragile and which assumptions need an owner.