
Pricing is a finance decision that gets treated like a marketing one. That is the mistake behind most of the margin and growth problems we see in companies between $5M and $50M ARR.
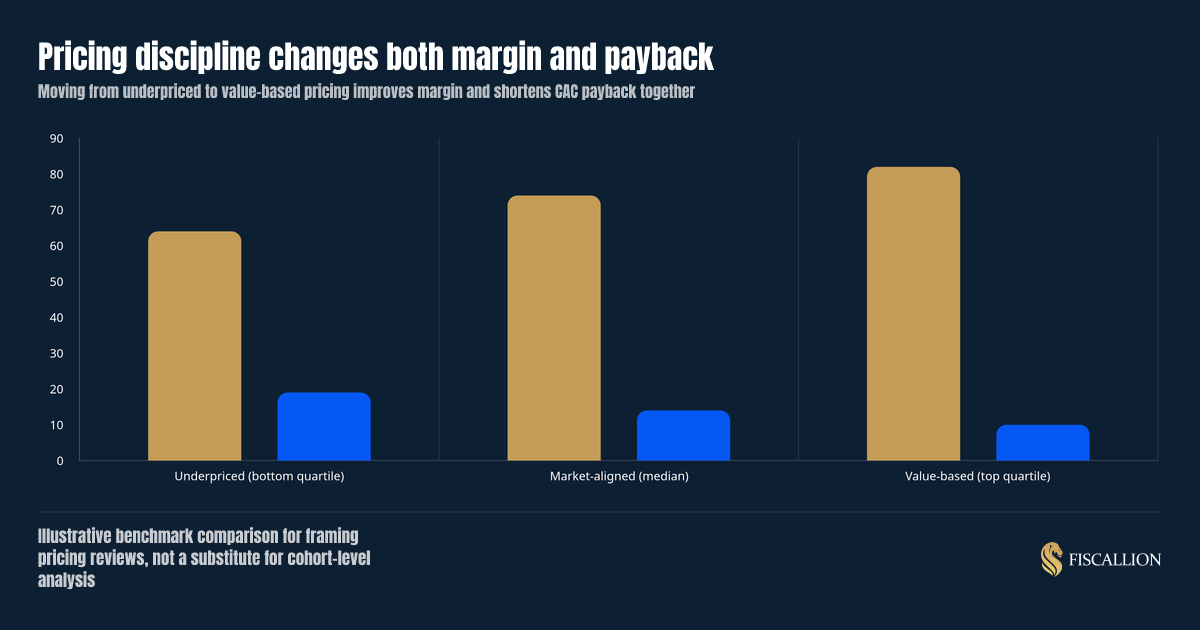
Get the pricing model, packaging, and discounting discipline right, and you improve gross margin, shorten CAC payback, and lift net revenue retention at the same time, without touching the product. Get it wrong, and no amount of reporting polish fixes the trade-offs you are quietly absorbing every renewal cycle.
This article gives you the framework we use in Fiscallion FP&A reviews: the four core pricing models, the five variables (the "5 C's") that should drive any pricing decision, the formulas for testing pricing changes before you ship them, and the specific mistakes that show up in board decks as unexplained margin erosion.
Key takeaways
- Pricing strategy is a margin and retention lever, not a packaging exercise. The model you choose changes gross margin, CAC payback, and net revenue retention simultaneously.
- The four core SaaS pricing models are flat-rate, per-seat (per-user), usage-based, and tiered/hybrid. Each has a different expansion ceiling and a different cost-to-serve profile.
- The 5 C's of pricing (cost, customer value, competition, channel, and company objective) are the inputs to a pricing decision, not a checklist you complete once.
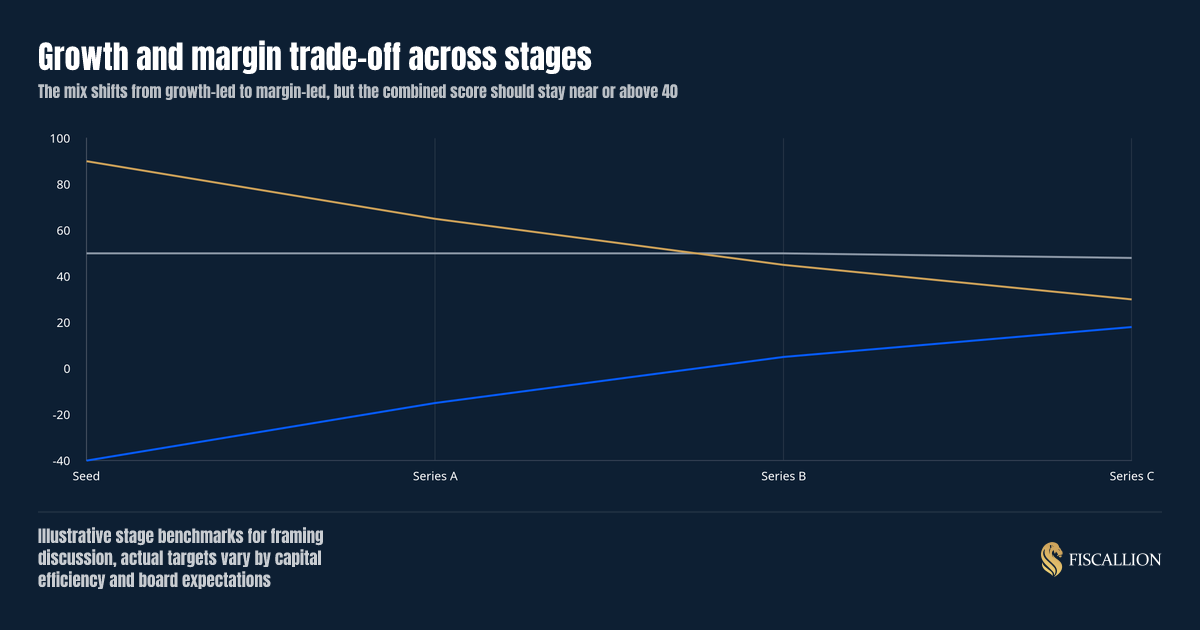
- Rule of 40 (growth rate + profit margin, both as percentages) is a portfolio health check, not a pricing formula. Pricing strategy is one of the few levers that can move both sides of that equation at once.
- Most pricing problems are not "wrong price." They are missing willingness-to-pay data, discounting without a floor, and packaging that does not match the buyer's actual usage pattern.
- The practical output of this article is a pricing decision worksheet you can run before your next renewal cycle or board meeting.
What we'll cover
We move in the order you should actually use this: what pricing strategy means as a finance decision, the four models and how to pick one, the formulas for testing a price change, how to read the resulting margin and retention data, what to do next in your pricing cadence, and the mistakes we see most often in $5-50M ARR companies along with the replacement move for each.
Pricing strategy is a margin decision before it is a product decision
Most founders inherit their pricing model from whatever the first ten customers agreed to pay. That is normal. It is also why pricing rarely gets revisited with the same rigor as a hiring plan or a fundraising model.
Here is the reframe: your pricing model determines three things simultaneously.
- Gross margin. Usage-based pricing built on infrastructure-heavy features costs more to serve as you scale. Flat-rate pricing on a low-usage feature set protects margin but caps expansion.
- CAC payback. How fast a new logo pays back its acquisition cost depends on the average contract value your pricing model produces at signature, not at year three.
- Net revenue retention. Pricing models that scale with the customer's usage or seat count capture expansion revenue automatically. Flat-rate models require a sales-led upsell motion to capture the same growth.
That is why we treat pricing strategy as an FP&A decision, not a go-to-market one. It belongs in the same review as your SaaS gross margin benchmark work and your contribution margin analysis, because a pricing change moves both.
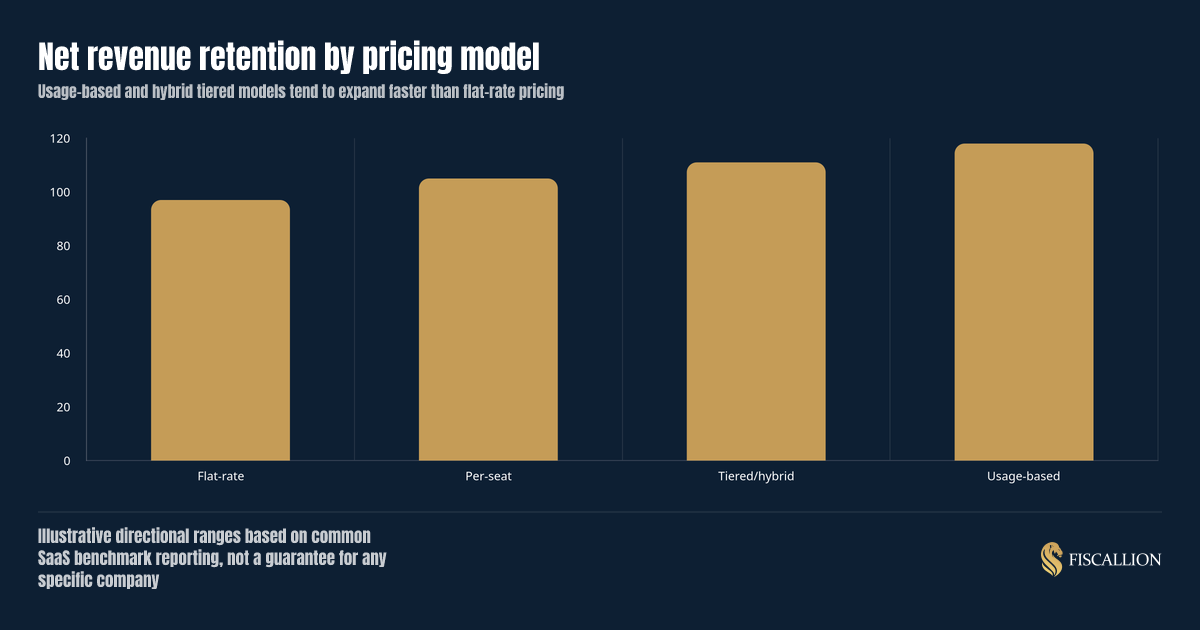
The pattern above is directional, not universal. But it holds in most cohorts we review: models that let revenue grow with customer usage outperform flat-rate agreements on expansion, because the pricing model does the upsell work that would otherwise require a customer success rep to notice and negotiate. ChartMogul's analysis of 2,100+ SaaS businesses reinforces the shift: expansion revenue now accounts for over 32% of total ARR growth, up from 28.8% in 2020.
The four core SaaS pricing models, and when each one fits
There are four base models. Most companies run a hybrid of two, which is fine, as long as the hybrid is intentional and not the accumulated result of ten years of one-off deals.
| Model | How it works | Best fit | Main risk |
|---|---|---|---|
| Flat-rate | One price, one package, no variation by usage or seats | Simple products, short sales cycles, early-stage companies validating willingness to pay | Caps expansion revenue; leaves money on the table with power users |
| Per-seat (per-user) | Price scales with number of licensed users | Collaboration tools, tools with clear "one license per person" usage | Discourages seat expansion once budget owners notice the line item; can incentivize under-licensing |
| Usage-based | Price scales with consumption (API calls, data volume, transactions) | Infrastructure, data, and platform products where usage tracks value delivered | Revenue is harder to forecast; can spike cost-to-serve if margin per unit isn't modeled |
| Tiered/hybrid | Packages bundle a feature set and a usage or seat allowance, with tiers stepping up | Most mature B2B SaaS companies, especially those selling to both SMB and mid-market | Tier boundaries need constant tuning or they create margin dead zones |
A few decision rules we apply in client reviews:
- If your cost-to-serve is flat regardless of customer usage, flat-rate or per-seat protects margin better than usage-based.
- If your infrastructure cost scales directly with customer activity, usage-based pricing keeps margin stable as you grow, because the customer pays for the marginal cost you incur. OpenView's State of Usage-Based Pricing found that companies using consumption-based models consistently outperform subscription-only peers on net dollar retention and CAC payback.
- If you sell to both SMB and enterprise from the same product, a tiered model is close to mandatory. A single flat price either overcharges SMB or undercharges enterprise.
- If you are inheriting legacy per-seat pricing but your product has shifted to a usage-heavy workflow, that mismatch is very likely showing up as margin compression you have not diagnosed yet.
How to calculate whether a pricing change is worth making
Before you touch pricing, model the change the same way you would model a hiring decision: as a trade-off with a number attached, not a hypothesis.
Step 1: Model the revenue impact per cohort, not in aggregate.
Segment customers by contract size and usage pattern. A 15% price increase on your smallest tier behaves completely differently than the same increase on your top quartile of accounts.
Revenue impact = (New price - Old price) x Renewal volume x Expected retention rate
Expected retention rate matters more than the price delta. A price increase that holds retention at 92% beats a larger increase that drops retention to 80%, in almost every case once you run the math past 18 months.
Step 2: Model the margin impact, not just the revenue impact.
Gross margin impact = (New price - New cost to serve) / New price minus (Old price - Old cost to serve) / Old price
If a pricing change increases revenue but cost-to-serve grows faster (common with usage-based tiers that unlock more consumption), your margin can go down even while revenue goes up. This is the single most common blind spot we find in usage-based pricing reviews.
Step 3: Model the CAC payback shift.
CAC payback (months) = CAC / (Monthly recurring revenue per account x gross margin %)
A pricing change that raises average contract value shortens payback directly, assuming close rates hold. If close rates drop because the new price is above the market's willingness to pay, payback can lengthen even though the formula looks better on paper. This is why pricing changes should always be piloted on new logos before being rolled to the full base.
Step 4: Run the Rule of 40 lens on the combined effect.
Rule of 40 score = Revenue growth rate (%) + Free cash flow margin (%)
A pricing change that trades 5 points of growth for 8 points of margin is, on paper, a net positive to the Rule of 40 score. Whether it is the right trade depends on your fundraising timeline and board expectations, which is a judgment call, not a formula output. Bessemer's Rule of X framework argues that growth should be weighted 2-3x more than FCF margin for late-stage companies, which changes how you read that trade-off.
How to interpret the results: margin and retention move together, not separately
Reading pricing data in isolation is where most teams get stuck. A price increase that lifts average contract value but tanks logo retention is not a win, even if next quarter's revenue number looks fine.
Use this interpretation grid when you review a pricing change:
| Signal | What it likely means | What to check next |
|---|---|---|
| ACV up, retention flat or up | Pricing change was within willingness to pay | Confirm the change holds at the next renewal cycle, not just the first one |
| ACV up, retention down | Price exceeded perceived value for at least one segment | Segment the churn by tier; the problem is probably isolated to one package, not the whole base |
| ACV flat, cost-to-serve up | Usage tiers are letting customers consume more without paying more | Rebuild the tier boundaries around actual usage data, not assumptions from 18 months ago |
| Gross margin down, growth rate up | You are trading margin for logos, which can be a deliberate strategy | Confirm this is intentional and time-boxed, not a drift nobody decided on |
| Discount rate rising quarter over quarter | Sales is pricing the deal, not the product | This is a pricing governance problem, not a pricing model problem |
That last row deserves emphasis. We see it constantly: the published price list looks fine, but the effective price (after discounting) has drifted 20-30% below list with no floor and no approval workflow. At that point, the pricing strategy on paper is disconnected from the pricing strategy in practice, and your gross margin benchmark work will look wrong until someone catches it. Simon-Kucher's Global Software Study of 500 B2B SaaS companies found that nearly 30% never raise prices for existing customers at all, and 38% cite a lack of confidence in justifying increases as the primary barrier — not competitive pressure.
What to do next: build a pricing review cadence, not a one-time project
Pricing is not a project you finish. It is a cadence you run, the same way you run a monthly forecast review.
- Quarterly: review discount rate by segment. If effective price is drifting away from list price, that is a governance fix, not a pricing model fix.
- Twice a year: review tier boundaries against actual usage data. Tiers built on assumptions from launch rarely match how customers actually use the product two years later.
- Annually: test willingness to pay with a subset of new logos. Do not raise price on the existing base blind. Pilot it on new deals first, measure close rate and time-to-close, then decide whether to extend it to renewals.
- At every fundraising or board cycle: run the Rule of 40 lens on any proposed pricing change. A margin-accretive pricing move can materially change your growth-efficiency story heading into a raise.
- Whenever ASC 606 allocation gets complicated by a new pricing model: loop in your revenue recognition process early. Multi-element arrangements (platform fee plus usage plus professional services) change how you recognize revenue, not just how you charge for it, and this is covered in more depth in our breakdown of revenue recognition in SaaS.
This is also where pricing connects to your broader unit economics work. A pricing change is, functionally, a change to your SaaS unit economics inputs: CAC payback, LTV, and gross margin all move together. Treat pricing decisions inside the same model you use for CAC and LTV, not as a separate spreadsheet that nobody reconciles back to the financial model.
Common mistakes and the replacement move for each
Mistake: pricing based on competitor list prices instead of your own cost structure and value delivered.
Replacement: build the price from your cost-to-serve and the value the customer captures, then check it against competitors as a sanity check, not a starting point. Competitor pricing tells you what the market will tolerate; it does not tell you what you should charge. Tomasz Tunguz's SaaS pricing guide makes the same case: value-based pricing built on your own cost structure and customer outcome is the right starting point, with competitors used as a reference, not an anchor.
Mistake: letting sales discount without a floor or an approval workflow.
Replacement: set a minimum effective price by tier and require a second approval below it. Track discount rate as a monthly metric, the same way you track churn.
Mistake: treating usage-based pricing as automatically margin-accretive.
Replacement: model cost-to-serve per unit of usage before you ship a usage-based tier. Usage-based pricing only protects margin if the price per unit scales with the true infrastructure cost per unit, not just with a growth narrative.
Mistake: raising price across the entire existing base at once.
Replacement: pilot the increase on new logos, measure the effect on close rate and time-to-close for one to two quarters, then decide how and when to extend it to renewals with clear grandfathering rules.
Mistake: keeping the same tier boundaries for years without checking them against usage data.
Replacement: pull actual usage distribution by account every six months and rebuild tier boundaries around where customers actually cluster, not around where they clustered at launch.
Mistake: treating pricing as a sales and marketing decision with finance reviewing it after the fact.
Replacement: run pricing changes through the same model you use for headcount and runway decisions, because the trade-offs (margin, retention, payback) are the same category of decision. This is the core argument in our SaaS financial model template work: decisions that touch cash and margin belong in one model, not scattered across a pricing deck, a sales comp plan, and a separate forecast.
A practical asset: the pricing decision worksheet
Before your next pricing review, run every proposed change through five questions. Answering these with real numbers, not confidence, is what separates a decision-grade pricing review from a debate.
- What is the expected retention rate at the new price, by segment, not in aggregate?
- What is the cost-to-serve at the new price point, and does margin actually improve?
- What does the change do to CAC payback, assuming close rates hold and assuming they drop 10%?
- What does the combined effect do to your Rule of 40 score, and is that trade-off intentional?
- What is the floor price sales can offer without a second approval, and who owns that approval?
If you cannot answer all five with numbers pulled from your own data, the pricing change is not ready to ship. This is the same discipline we bring into every Fiscallion FP&A engagement: a pricing decision, like a hiring decision or a runway decision, needs an owner, an assumption set, and a number attached to the trade-off, not just a recommendation.
FAQ
What are the pricing strategies for SaaS?
SaaS companies generally choose from four base pricing strategies: flat-rate, per-seat, usage-based, and tiered/hybrid. Flat-rate pricing charges one price for the full product regardless of usage or seats, which is simple to sell but caps expansion revenue. Per-seat pricing scales with the number of licensed users, which fits collaboration tools well but discourages seat growth once a budget owner notices the line item. Usage-based pricing scales with consumption, such as API calls or transaction volume, and works best when cost-to-serve scales with usage in a similar way. Tiered or hybrid pricing bundles a feature set and a usage or seat allowance into packages that step up in price and value, which is the most common structure for companies selling across SMB and enterprise segments from a single product. Most mature SaaS companies run a deliberate hybrid, for example a per-seat base fee with usage-based overage charges, rather than a pure version of any single model.
What are the 5 C's of pricing strategy?
The 5 C's are the inputs you should weigh before setting or changing a price: cost, customer value, competition, channel, and company objective. Cost is your cost-to-serve, including infrastructure, support, and onboarding, and it sets the margin floor below which a price destroys value. Customer value is what the buyer perceives the product is worth relative to the outcome it delivers, which is the ceiling on what you can charge. Competition tells you what alternatives exist and what the market has already trained buyers to expect, which is useful context but should not be the starting point for your own price. Channel refers to how the product is sold, self-serve, sales-assisted, or enterprise sales, because each channel supports a different price point and negotiation dynamic. Company objective is the trade-off you are optimizing for right now, such as growth rate, margin expansion, or market share, and it determines how aggressively you price relative to the other four inputs. None of the 5 C's works as a standalone formula; they are the variables a pricing decision needs to reconcile.
What are the 4 types of pricing strategies?
The four core types are flat-rate, per-seat (per-user), usage-based, and tiered/hybrid pricing, as detailed in the pricing models table above. Some frameworks outside SaaS also reference four strategic postures such as cost-plus pricing, value-based pricing, competitor-based pricing, and penetration pricing. In a SaaS context, we recommend value-based pricing as the primary posture, built on top of one of the four structural models (flat-rate, per-seat, usage-based, or tiered), because cost-plus pricing tends to underprice the value delivered and competitor-based pricing anchors you to someone else's margin structure instead of your own.
What is the rule of 40 for SaaS?
The Rule of 40 states that a healthy SaaS company's revenue growth rate and profit margin, added together as percentages, should equal or exceed 40%. For example, a company growing revenue at 50% year over year with a negative 10% free cash flow margin scores 40 and is considered balanced, even though it is not yet profitable. A company growing at 20% with a 25% free cash flow margin also scores 45 and is considered healthy, despite growing much more slowly. The rule is a portfolio-level health check used heavily by investors evaluating capital efficiency, not a target to hit in any single quarter. McKinsey's analysis of 200+ SaaS companies found that barely one-third achieve it consistently. Pricing strategy is one of the more direct levers you have to move a Rule of 40 score, because a well-modeled pricing change can improve gross margin and free cash flow without requiring a corresponding cut to growth investment, which is why we treat pricing reviews as a Rule of 40 lever inside FP&A work rather than a separate go-to-market exercise.
Conclusion
Pricing strategy at $5-50M ARR is not a one-time packaging decision. It is a recurring finance decision that touches gross margin, CAC payback, net revenue retention, and your Rule of 40 score every time you change it, and every time you fail to review it.
The founders who get this right do not necessarily charge more. They know, with numbers, what a proposed price change does to margin and retention before they ship it, and they run pricing on the same cadence and the same rigor as their hiring plan and their runway model.
If your last pricing change was a debate in a Slack thread instead of a modeled trade-off, that is the gap to close first. Get the template and run your next pricing decision through the same worksheet we use in Fiscallion FP&A engagements, before it shows up as unexplained margin drift six months from now.