

CAC payback period is one of the few metrics where a wrong input doesn't just give you the wrong answer - it gives you the wrong decision. Companies scale paid acquisition confidently, freeze headcount to protect runway, or tell investors a capital efficiency story, all from a payback number that's built on the wrong gross margin, the wrong ARPU cohort, or a blended denominator that hides where the real problem lives.
This article covers how to calculate payback correctly, which benchmarks actually apply to your ACV and retention profile, and the three decisions the metric should drive on a quarterly cadence.
Key takeaways
- The standard payback formula has three inputs. Two are wrong in most implementations - and the errors extend apparent payback by 20-40%.
- A single blended payback number across channels and segments hides which parts of your acquisition motion are above threshold and which are running efficiently.
- NRR is the modifier that makes or breaks whether a given payback period is acceptable. A 24-month payback at 130% NRR is fundamentally different from the same number at 95% NRR.
- Payback drives three specific decisions: how much to invest in acquisition, whether to fix CAC or improve gross margin first, and whether pricing needs to move before you scale headcount.
What CAC payback period actually measures
CAC payback period is the number of months it takes to recover the sales and marketing cost of acquiring a new customer through the gross margin that customer generates each month.
It is not a profitability metric. A short payback with high churn is not a sign of a healthy business. It is not the same as LTV:CAC - LTV:CAC tells you the return on acquisition investment over time; payback tells you when the cash actually comes back.
The distinction that matters: you can have a healthy LTV:CAC ratio and still have a cash problem if payback is 24+ months and you're growing fast. At $10M-$30M ARR, growth is fast enough to generate significant unrecovered CAC, but the business isn't yet generating enough free cash flow to absorb it. That gap needs to be funded somehow.
What it is not:
- It's not a valuation metric - investors care about it, but it signals capital efficiency, not terminal value.
- It's not a single company-wide number - blending across channels, segments, and ACVs masks more than it reveals.
- It doesn't account for churn by default - the standard formula assumes the customer stays through the payback window, which most implementations don't validate.
The formula - and the two inputs that are usually wrong
The correct formula is straightforward:
CAC Payback (months) = CAC ÷ (New cohort MRR per customer × Subscription gross margin %)
Where:
- CAC = Total sales and marketing spend in period ÷ New customers acquired in that period
- New cohort MRR = Average MRR of customers acquired in the measurement period only - not total book ARPA
- Subscription gross margin = Subscription revenue gross margin only - not blended company gross margin
The formula looks simple. The inputs are where most companies go wrong.
Mistake 1: using total ARPA instead of new cohort MRR
Your total ARPA blends legacy customers who signed at different price points - often lower ones. New customers typically carry a higher ACV than your existing book average. Using total ARPA understates the MRR from new customers, which makes payback appear longer than it actually is.
The fix: use the average MRR of customers acquired in the specific measurement quarter. If your new cohort ACV has been rising, payback should be improving. If your formula uses blended ARPA, it won't show that improvement.
Mistake 2: using blended gross margin instead of subscription gross margin
Blended gross margin includes professional services, implementation, and other non-recurring revenue streams - all of which carry lower margins than subscription. Using blended gross margin artificially shortens payback by inflating the denominator.
High Alpha's SaaS benchmarks put median subscription gross margin at approximately 80% for companies in the $5-20M ARR range. If your blended margin is 65% because you have a significant services component, you cannot use 65% as the payback denominator. You will substantially understate how long it takes to recover acquisition cost.
The fix: isolate subscription revenue gross margin. Use that number in the formula, and separately track the margin profile of professional services if it's material.
Failing to isolate your core subscription data from low-margin services can heavily distort your financial modeling. When a business relies on a combined gross margin to judge acquisition health, it completely obscures the true, extended timeline required to recover cash layout.
A third error that compounds both
Many companies exclude SDR and BDR headcount costs from CAC entirely because those costs sit in a "sales development" budget line rather than direct sales. If your SDRs are generating the pipeline that converts to new logos, their fully-loaded compensation belongs in CAC. Omitting it understates acquisition cost from the start.
As OpenView's Kyle Poyar notes, this is one of the most consistent calculation errors across SaaS companies at the growth stage - teams ignore areas of spend that don't sit in the obvious "sales & marketing" bucket but are clearly part of the acquisition motion.
Worked example with corrected inputs
The same business, with corrected inputs, shows a 4.5-month difference in reported payback. The direction of the error matters: using blended gross margin shortens payback (making you look more efficient than you are), while using total book ARPA lengthens it. Depending on your numbers, these errors can partially cancel or compound.
Edge case: annual prepay contracts
If customers pay annually upfront, cash payback can technically occur in month one - the full year's revenue lands on signing. But recognized-revenue payback and cash payback diverge significantly in this scenario.
For board reporting, track both. If annual prepay represents more than 30% of new bookings, reporting only one number will mislead capital planning decisions. Your board should see cash payback (when does the money arrive?) and GAAP payback (when is it recognized?) side by side.
Benchmarks by ARR band and ACV
The commonly cited benchmark is under 12 months. That threshold is useful as a general orientation, but it fails to account for the two variables that matter most: your ACV and your customer retention profile.

The jump at $20-50M ARR reflects a structural shift: most companies at this stage are moving upmarket into segments with longer sales cycles and higher-touch requirements. Many teams don't reset their payback expectations when they shift motion. The result is that a 20-month payback that would have been alarming at $8M ARR becomes normalized at $35M ARR - sometimes correctly, sometimes not.
Benchmarks by ACV
The ARR-band view is a starting point. ACV tells you more about the structural floor for payback than ARR does.
These are ranges, not targets. The right threshold for your business depends on three things: your NRR profile, your capital position, and whether you're pre- or post-product-market fit on the segment you're acquiring.
The 18-month threshold and why it exists
Below 18 months, most companies with reasonable revenue visibility can fund growth from operations or existing capital without payback becoming a liquidity issue. Above 18 months, you're funding a growing gap between acquisition spend and cash recovery. That gap compounds at higher growth rates and gets painful at anything above 15% monthly new logo growth.
Context shifts the threshold. At 120%+ NRR, a 24-month payback is defensible - the cohort value compounds quickly and lifetime economics are strong. At 95% NRR or below, you need faster recovery because the second-year expansion that normally offsets longer payback simply isn't there.
Decision rule: if payback is above 18 months and NRR is below 100%, you have an acquisition efficiency problem that compounds. You cannot fix that combination by adding acquisition spend.
NRR is the modifier that changes everything
The standard payback formula assumes flat monthly revenue per customer. Most SaaS businesses don't work that way. When customers expand - through seat growth, usage-based pricing, or upsells - the effective payback period compresses, sometimes dramatically.
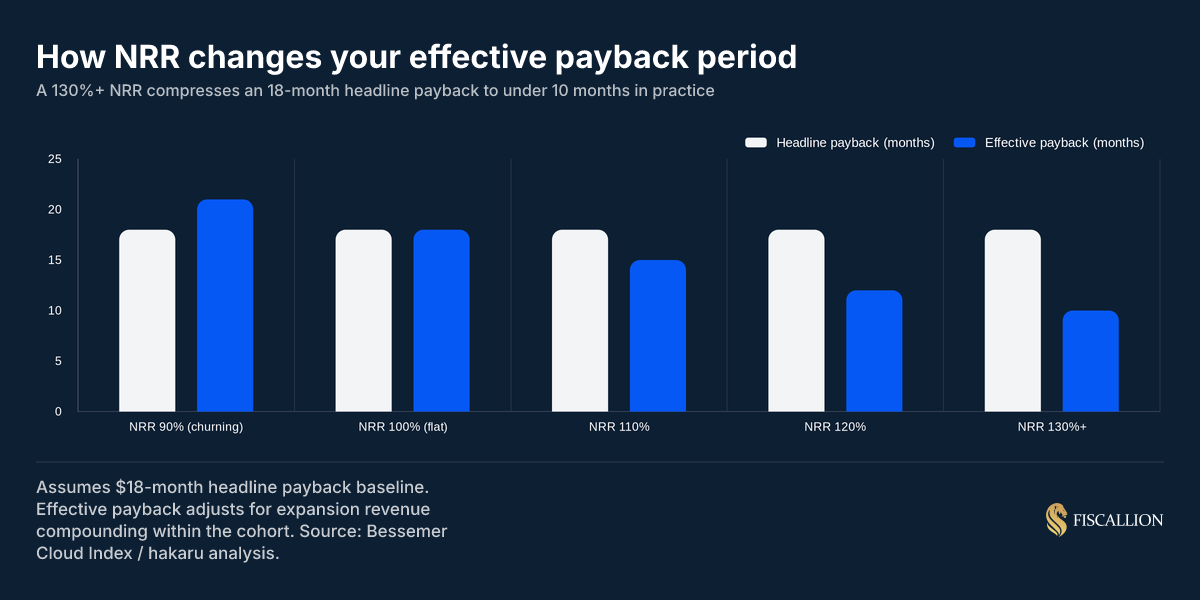
McKinsey's analysis of 55 B2B SaaS companies found that top-quartile NRR companies (those averaging 113% NRR) consistently outperformed peers on growth efficiency and reported shorter effective payback periods - confirming that the two metrics are structurally linked, not independent. At the bottom quartile, NRR averaged just 98%, and both payback and valuation multiples reflected it.
OpenView's benchmark framework makes the NRR-payback relationship actionable: below 100% NDR, target payback under 12 months; at 100-120% NDR, 12-18 months is defensible; above 150% NDR, longer payback can be justified given compounding expansion value. This isn't a soft guideline - it's the right way to set a written payback threshold for your business.
This is why reporting payback without NRR in the same view is incomplete. The two numbers require each other to be interpretable. For a deeper look at how to track NRR by cohort and connect it to payback trends, the SaaS cohort analysis guide covers how to isolate the retention data that makes payback benchmarks meaningful.
A blended number across channels is not actionable
There are three structural reasons why a single blended payback number fails as a decision input:
Organic acquisition has near-zero CAC. Including content, SEO, and referral in a blended number makes paid channels look more efficient than they are. When you need to make a paid acquisition budget decision, a blended payback inflated by organic volume will point you in the wrong direction.
SMB and enterprise deals have different CAC, cycle length, and MRR profiles. Blending them masks where payback is breaking. If you're running a dual-motion GTM and payback is 14 months blended, it's entirely possible that your enterprise motion is at 22 months and your SMB motion is at 8 - and the blended number tells you nothing about which to scale.
New logo and expansion CAC are structurally different. Expansion revenue from existing accounts should not be in the new logo payback calculation. According to Benchmarkit's 2025 B2B SaaS Performance Metrics Report, expansion ARR now represents 40% of total new ARR across B2B SaaS, and over 50% for companies above $50M ARR. If your CAC calculation blends new logo and expansion costs, you are significantly understating how expensive pure new logo acquisition actually is.
When expansion performance from existing cohorts gets pulled into the calculation, it can falsely validate an entirely inefficient top-of-funnel strategy. Unblending these figures frequently reveals that net-new logo acquisition costs far more than leadership realizes, completely changing where capital should be allocated.
Minimum viable segmentation
At minimum, segment payback by acquisition channel before you use it in any decision. Here's what that typically looks like:
The blended number looks healthy. The outbound channel is running above the company's target. If this team scales outbound without segmenting, the blended number deteriorates and the cause is invisible until it's already compounded across multiple quarters of spend.
Decision rule: before approving a budget increase for any channel, confirm that channel's standalone payback against your written target threshold. Not the blended number - the channel number.
For a more detailed breakdown of why blended CAC payback hides the real acquisition efficiency story - and how to reconstruct it by channel - this deep-dive on blended CAC payback walks through the segmentation mechanics and common mistakes that compound when you scale the wrong channels.
How churn silently extends payback past your target
The standard formula assumes every customer you acquire stays through the end of the payback window. That assumption is wrong for most companies, and the gap between nominal payback and effective payback compounds quickly at higher churn rates.
When a customer churns before you've recovered their CAC, you've lost the remaining unrecovered balance. The next customer you acquire must now cover its own CAC plus a portion of the unrecovered cost from churned customers.
Worked example: A company with a 16-month nominal payback and 12.5% annual logo churn acquires 100 customers in Q1 at $20,000 CAC each. That's $2M in acquisition spend.
At roughly 1% monthly churn, approximately 15 of those 100 customers will leave before month 16. If the average churned customer exits at month 8 - halfway through the payback window - $10,000 of their $20,000 CAC is unrecovered.
15 churned customers × $10,000 unrecovered = $150,000 in CAC that never comes back.
That $150,000 gets distributed across the 85 remaining customers. Their effective CAC is now $23,529, not $20,000. The effective payback for the surviving cohort stretches from 16 months to approximately 18.8 months.
This is a 16-month target that functionally operates near 19 months. The gap grows at higher churn rates and with larger cohorts.
Practical rules of thumb:
- If annual logo churn exceeds 10%, treat any payback target above 12 months as high-risk.
- If NRR is above 110%, payback up to 24 months can be financially sound - but model the expansion curve explicitly, not as an assumption.
- Downgrades and partial refunds have the same directional effect. If they exceed 5% of cohort revenue, include them in the model.
Three decisions payback should drive on a quarterly cadence
Most companies track CAC payback. Fewer use it to make a specific decision within 30 days of seeing the number. The gap is almost always in how the metric is connected to a budget or headcount decision, not in the metric itself.
Here are the three decisions payback should drive, the owner for each, and what the decision process looks like.
Decision 1: how much to invest in acquisition this quarter
CAC payback sets a natural constraint on self-funded growth. If your payback is 15 months and you're adding $500K/month in new MRR, you're carrying approximately $7.5M in unrecovered CAC at any given time. That balance needs to be funded - by existing cash, by new capital, or by slowing growth.
Don't do this: Increase acquisition budget quarter over quarter without modeling the cash impact of the extended payback period on runway.
Do this instead: Build a payback cash model once and refresh it each quarter. The formula is straightforward: (new customers added per month × CAC) minus (monthly CAC recoveries from existing cohorts) equals net cash tied up in acquisition at any given time. Put that number next to your runway number before budget decisions.
Owner: Finance and CEO together. Finance builds the model; CEO makes the trade-off call between growth rate and cash position.
Decision 2: whether to fix CAC or improve gross margin first
When payback is too long, most teams default to cutting sales and marketing spend or improving conversion rates - both of which reduce CAC. But for many SaaS businesses in the $5-50M ARR range, subscription gross margin has more room to move than CAC does.
A gross margin improvement from 72% to 78% on a $2,200 MRR customer moves monthly gross profit contribution from $1,584 to $1,716. On a $20,000 CAC, that shortens payback from 12.6 months to 11.7 months - without touching the sales and marketing budget at all.
The modeling question is: which lever is faster and cheaper to pull? Infrastructure cost reduction, renegotiated vendor contracts, and support efficiency all affect margin without requiring a change in GTM motion. That's worth modeling before defaulting to CAC reduction.
Owner: Finance models the trade-off. CEO and CTO make the margin improvement call. VP Sales makes the CAC reduction call. Finance owns the model that connects both.
Decision 3: whether to adjust pricing before scaling acquisition
If payback is above your target and you're considering scaling headcount or acquisition budget, pricing should be modeled before headcount is approved. A 10-15% price increase on new logos, with no change in CAC, improves payback proportionally. A single pricing adjustment can shorten payback by 1-2 months without adding a single dollar of sales and marketing spend.
This is especially relevant before Series B or Series C fundraising, where investors will ask about capital efficiency trends across cohorts. If payback has been improving because of pricing changes, that story is worth telling explicitly.
Owner: CEO and Head of Product/Pricing own the pricing decision. Finance models the payback impact of each price point option before the decision is made.
Common mistakes and what to do instead
These appear consistently across companies in the $5-50M ARR range. Most are formula or process errors, not data problems. They're correctable in a single quarter.
A note on the cohort view: this is the version of payback that matters most for fundraising conversations. Investors don't want to know what your payback is today - they want to know whether it's getting better or worse across successive cohorts. The 2024 SaaS Benchmarks Report from High Alpha and OpenView - based on data from 800+ companies - shows that early-stage companies with improving cohort payback metrics consistently outperformed on growth rates and capital efficiency ratios. If you can show three consecutive quarters of improving cohort payback, that's a far more compelling narrative than a single current number.
The SaaS unit economics framework covers how payback sits alongside LTV:CAC and gross margin in a complete capital efficiency model. For companies where contribution margin is the right starting point for payback analysis, the contribution margin in SaaS guide covers how to isolate the correct gross margin inputs by segment.
CAC payback audit checklist
Run this once per quarter. It takes 20-30 minutes and surfaces the errors that distort the number before you take it to a board or budget conversation.
Formula inputs
- CAC uses fully-loaded sales and marketing spend, including SDR / BDR headcount and any marketing technology allocated to acquisition
- MRR in the denominator is new cohort MRR for the period - not total book ARPA
- Gross margin in the denominator is subscription gross margin only - professional services excluded
- Annual prepay contracts tracked separately as cash payback vs. GAAP payback
Segmentation
- Payback is reported by acquisition channel (not blended only)
- Payback is reported by customer segment or ACV band if you run a dual-motion GTM
- New logo payback is calculated separately from expansion - no blending of new logo and expansion CAC
Churn and retention
- NRR is tracked alongside payback in the same reporting view
- If annual logo churn exceeds 10%, payback target has been adjusted down accordingly
- Cohort-level payback is tracked for the last four quarters
Decision rules
- A written payback threshold exists for each channel - not just a company-wide number
- Payback is connected to the acquisition budget model and reviewed before budget decisions
- Finance, CEO, and relevant functional owners have reviewed payback together in the last quarter
If more than three of these are unchecked, the payback number you're reporting is unreliable enough to make the wrong call on a budget or headcount decision.
Aligning Payback Formulas with Growth Decisions
CAC payback period is not a reporting metric - it's a capital allocation input. When the formula is wrong, the decisions that come from it are wrong too: acquisition spend scales into channels running at 2x the acceptable threshold, headcount gets added before pricing is adjusted, and board decks report a blended number that looks fine while one segment quietly burns cash.
The fix is not complicated. Correct the two formula inputs - new cohort MRR and subscription gross margin. Segment by channel before you report. Set a written decision rule for when each channel's payback triggers a review. Track it alongside NRR, not independently.
If your payback number is blended and unaudited, the most useful first step is to run the audit checklist above, identify the errors, and recalculate before your next board meeting.
To work through the segmentation and connect payback to your cash model and headcount plan in a single session, book a working session with the Fiscallion team.
