

A 4% monthly churn rate tells you something went wrong. It does not tell you where, when, or in which segment - and that gap is what makes it useless for decisions.
Most SaaS companies track churn. Far fewer have a clear answer to: which cohort is driving it, how it compounds against acquisition, and what specific change would move it. The number sits in a dashboard and gets acknowledged in board meetings without translating into a decision or a trade-off.
This guide closes that gap. You will leave with a precise definition, the right formula, stage-calibrated benchmarks, and a short list of actions ranked by impact.
Key takeaways
- Monthly churn compounds fast. A 2% monthly churn rate annualizes to roughly 22% - not 24%. That difference matters when you are modeling runway or LTV.
- Blended churn hides the real problem. Segment by cohort, by ACV tier, and by customer segment before drawing any conclusion or presenting to a board.
- The correct benchmark is your ARR stage and your industry category. Comparing a $10M ARR SMB-tools company to a $50M ARR DevTools benchmark will always make you look worse than you are.
What customer churn rate actually measures
Customer churn rate (also called logo churn rate) measures the percentage of customers who cancelled or did not renew in a given period, relative to the number of customers at the start of that period.
It is a count metric. A $500/month customer and a $50,000/year customer each count as one churned logo. That is why logo churn and revenue churn are different numbers, and why you need both.
Three related metrics you will always use alongside it:
Logo churn tells you how many accounts you lost. GRR tells you the revenue impact of those losses plus any downgrades. NRR tells you whether expansion is more than covering the losses.
A company with strong NRR and weak GRR looks fine until expansion slows. You need all three to make a complete picture. The relationship between these metrics also feeds directly into your SaaS financial model template - MRR projections that ignore churn by segment will be wrong before the quarter is out.
How to calculate customer churn rate
The standard formula
Customer churn rate = Customers lost during period / Customers at start of period × 100
Example:
- Customers at the start of the month: 400
- Customers who cancelled during the month: 12
- Customer churn rate: 12 / 400 × 100 = 3.0%
Simple. But three input decisions will change the number before the math does.
Input decision 1: who counts as "a customer at the start"
Include only customers who were fully onboarded and past any trial or grace period at the start of the measurement window. Public benchmarks exclude trial dropouts and customers in their first 90 days post-activation. If you include them, your number will look 2-3x worse than any industry comparison - not because your retention is worse, but because your measurement is contaminated.
Input decision 2: the period boundary
Decide if you are measuring monthly, quarterly, or annually. Monthly is standard for most $5-50M ARR SaaS companies because it aligns with MRR reporting. But monthly and annual figures are not interchangeable, and the compounding math means a 2% monthly rate is not simply "2% × 12 = 24% annual." It is:
Annual churn = 1 - (1 - monthly churn rate)^12
At 2% monthly: 1 - (0.98)^12 = 21.5% annually.
At 3% monthly: 1 - (0.97)^12 = 30.6% annually.
Run this calculation before presenting monthly churn numbers to a board. The annualized figure is what investors and acquirers use, and it compresses faster than most founders expect.
Input decision 3: customer-weighted vs. revenue-weighted
Customer churn rate is customer-weighted by definition - every logo counts equally. Revenue churn (GRR) weights by the revenue each account was generating. Both are correct, but they answer different questions. If your churn is concentrated in small accounts, logo churn looks bad and GRR looks fine. If it is concentrated in large accounts, logo churn looks fine and GRR looks bad. You need to know which one is true.
Churn rate is also one of the three inputs that drives your LTV calculation. A 1-percentage-point improvement in monthly churn rate has an outsized effect on LTV:CAC ratio - because LTV is essentially ARPU × gross margin divided by churn rate. When churn falls, lifetime value rises non-linearly.
How to interpret your churn rate: benchmarks by stage and segment
The single most common mistake in churn benchmarking is comparing against the wrong peer. A $5M ARR company comparing itself to a $50M ARR benchmark will almost always look like it has a problem - because the benchmark is set by a company with older contracts, higher ACV, and more deeply embedded integrations. The correct reference is your ARR stage, your industry, and your customer segment.
SaaS Capital's 2025 retention benchmarks, based on an annual survey of private B2B companies, confirm this point directly: benchmarking by ACV is the most reliable starting point - more predictive than company age, revenue level, or industry alone.
Benchmarks by ARR stage (monthly logo churn)
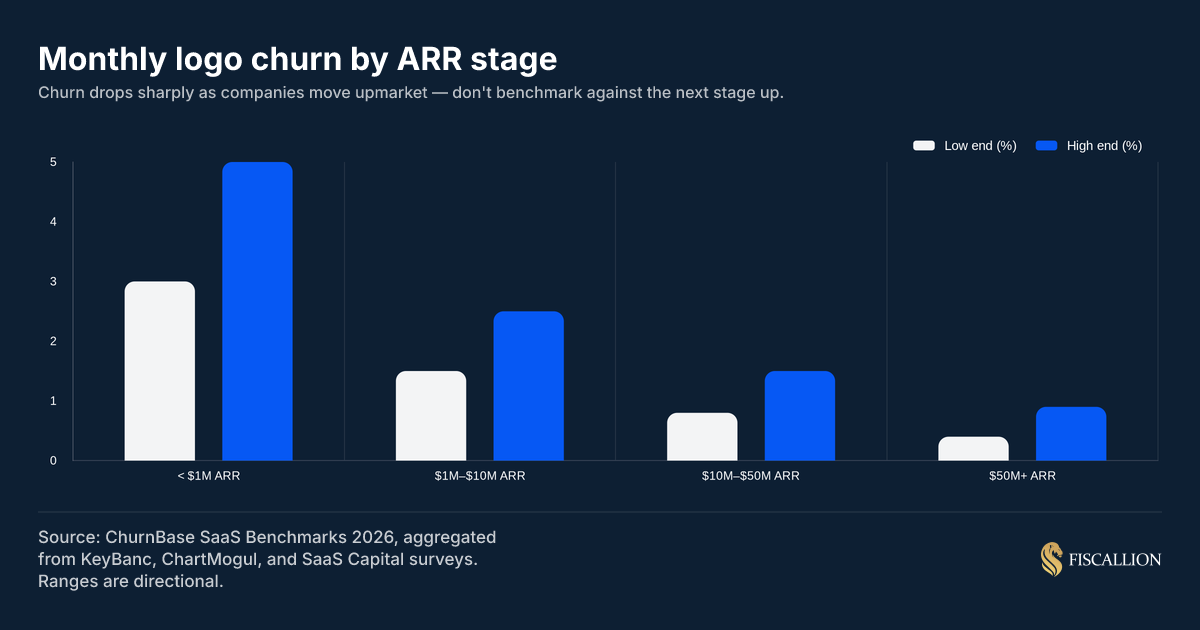
Source: ChurnBase 2026, aggregated from KeyBanc, ChartMogul, and SaaS Capital surveys.
If you are at $15M ARR and tracking 1.2% monthly churn, you are within the normal range for your stage. That does not mean you should accept it - but it does mean the intervention you need is operational, not structural.
A flat, stable logo churn metric can easily lull leadership into a false sense of security while severe revenue degradation happens right under the surface. If the accounts leaving skew heavily toward your highest contract values, healthy looking top-line numbers are actually masking a critical structural bleed.
Benchmarks by customer segment (annual logo churn)

Source: ChurnBase 2026.
A blended company-wide NRR of 102% can conceal a 130% NRR in the enterprise book and an 80% NRR in the SMB book. Those are two different businesses inside one P&L - and they require completely different playbooks. Reporting blended churn to your board is reporting a number no one can act on.
Benchmarks by industry (annual NRR)
Source: ChurnBase 2026.
Industry effects are often larger than stage effects. An SMB-tools company at $20M ARR will structurally underperform a DevTools company at $5M ARR on NRR. That gap is not a management problem - it is the nature of the customer base. Diagnose the right thing.
It is worth noting that the AI-native category is emerging as its own benchmark tier. ChartMogul's 2025 AI churn wave research, covering 3,500 software companies, found that AI-native products had median GRR of just 40% - far below B2B SaaS. The key differentiator: AI products priced above $250/month saw 70% GRR and 85% NRR, essentially in line with traditional B2B SaaS. Below $50/month, GRR collapsed to 23%. If you are building or acquiring AI-adjacent SaaS, price point is not a positioning decision - it is a retention decision.
What movements in the number signal
A churn rate that is stable does not mean there is no problem - it may mean you are replacing churned customers with new ones of similar quality. Watch for these directional signals:
Voluntary vs. involuntary churn: separate them before you diagnose
Not all churn has the same root cause, and treating it as one problem will steer you toward the wrong fix.
Voluntary churn is customer-initiated. The account decided to leave - because of value perception, a competitor, a budget cut, or a change in the buyer's situation. This requires product, onboarding, or positioning changes.
Involuntary churn is payment-initiated. The card failed, the subscription lapsed, or the account was deactivated by a billing system. The customer may have intended to stay. Data from Recurly (compiled from over 2,000 businesses) shows that involuntary churn is the most underestimated—and entirely recoverable—loss in SaaS. It is a pure execution problem, fixable with automated card updates, smart dunning workflows, and retry logic.
The distinction matters for prioritization. If 30% of your churn is involuntary and you invest your next quarter building a customer success motion to reduce voluntary churn, you fixed the harder problem and left the cheaper one untouched.
Because failed billing loops rarely have a dedicated internal owner at earlier growth stages, massive amounts of revenue are quietly dropped without the customer ever intending to cancel. Rectifying this doesn't require a fundamental shift in product strategy, but rather a simple execution framework around automated billing escalations.
Before your next churn review, tag every churned account in the past 90 days as voluntary or involuntary. It is a 20-minute spreadsheet exercise. The split will likely surprise you.
What to do about churn: actions ranked by impact
The following actions are ordered by the size of their likely impact on churn at a $5-50M ARR company. They assume you have already separated voluntary from involuntary churn and have at least 90 days of account-level data.
1. Fix cohort measurement before you fix churn
The single highest-leverage action is knowing which cohorts are actually churning. A 12-month cohort retention table - showing what percentage of each monthly signup cohort is still active at months 1, 3, 6, 9, and 12 - will show you more than any blended rate. It answers: is churn front-loaded (onboarding problem) or back-loaded (ongoing value problem)?
If you do not have this table, build it before making any other churn-related investment. The structure and decision logic for building it is covered in the SaaS cohort analysis guide - cohort tables are the tool that turns a churn percentage into a diagnosis.
Owner: Head of Finance or CEO.
Timeline: 1-2 weeks to pull from your billing system.
2. Segment churn by ACV tier and report all three rows
Separate your churned accounts into SMB, mid-market, and enterprise. Calculate churn rate within each segment. If the blended rate is 2.5% monthly but your SMB cohort is at 4.5% and your mid-market cohort is at 0.8%, those are two different conversations requiring two different interventions.
SaaS Capital's survey data reinforces this directly: companies with ACVs between $25K and $50K show a median NRR of 102%, with the top quartile reaching 111%. If you are in that ACV band and reporting a blended NRR of 95%, the segment breakdown will tell you where the drag is coming from.
Owner: Finance + Customer Success lead.
Timeline: Same data pull as cohort analysis.
3. Track and target time-to-first-value in onboarding
Front-loaded churn - the kind that shows up at months 1-3 in the cohort table - almost always traces back to onboarding. Customers who do not reach a meaningful first outcome within 30 days are 3-5x more likely to churn in the first 90 days. Define one specific milestone that represents "customer has received value" for your product category. Then measure the percentage of new customers who hit it within 30 days.
This metric - sometimes called time-to-value or activation rate - is the leading indicator of churn. Your lagging churn rate tells you what already happened. Time-to-value tells you what is about to happen.
Owner: Product + Customer Success.
Timeline: 4-6 weeks to instrument and baseline.
4. Build a churn-risk health score with explicit assumptions
A health score that nobody owns is not a health score. Before building a model, decide which three to five signals predict churn with the most accuracy in your product. Common candidates: login frequency, feature adoption depth, support ticket volume, and contract renewal date proximity.
Assign weights. Write down the weights. Assign a person to review accounts that drop below a threshold. The score only works if there is a named owner who acts on it within a defined response window.
Owner: Customer Success lead.
Timeline: 4-8 weeks.
5. Automate involuntary churn recovery
Configure automated card update requests 30, 15, and 7 days before a card expiration. Set up smart retry logic for failed payments (retry on day 3, day 7, day 14 before marking as churned). Add a grace period of at least 7-14 days. Use dunning email sequences that are transactional and direct, not marketing-toned.
Involuntary churn that gets fixed here costs almost nothing relative to any retention motion. It is the only churn category where the customer likely did not intend to leave. Recurly's failed payment recovery data shows that retry timing and sequencing materially affect recovery rates - making this a pure execution problem, not a strategy problem.
Owner: Engineering + Finance ops.
Timeline: 2-4 weeks.
6. Tie pricing tiers to a natural usage ceiling
One of the most effective structural levers against churn is ensuring your pricing model creates a clear upgrade path tied to actual usage. Customers who bump against a usage ceiling and see a meaningful incremental value at the next tier are less likely to churn and more likely to expand. That dynamic also shows up in NRR - a metric the net revenue retention benchmarks guide covers in detail. If pricing feels arbitrary to the customer, it creates churn risk at renewal time rather than expansion opportunity.
The data on annual vs. monthly contract structure also matters here. ChartMogul's research found that the median NRR is 10 to 20 percentage points higher for annual plans compared to monthly ones - a structural difference that compounds at renewal. Moving customers from monthly to annual is not just a billing change; it is a churn intervention.
Owner: CEO + Product.
Timeline: 1-2 quarters if a pricing change is required.
7. Separate forecasted churn assumptions from Customer Success operations
While the Customer Success team naturally owns the day-to-day operational motion to improve retention, they should not single-handedly own the churn inputs in your financial model. When CS completely controls the metric, companies often fall into a trap where the forecast uses a flat, stale assumption that hasn't been verified against real cohort trends in over a year.
To build a resilient retention engine, separate the strategic forecast from operational execution. Finance must own the baseline churn input assumption within the corporate model, reviewing and updating it quarterly against actual historical cohort data. CS then owns the tactical playbook required to hit or beat that benchmark. Every update to the forecasting assumption must have an explicit, data-driven rationale—ensuring your unit economics remain anchored in reality.
- Owner: Head of Finance + VP of Customer Success.
- Timeline: 1–2 weeks to establish the quarterly review framework.
A churn rate dashboard checklist
Before your next board meeting or investor update, verify that your reporting covers these elements:
- Monthly logo churn rate (calculated using post-onboarding denominator)
- Monthly revenue churn (GRR equivalent, separate from logo rate)
- NRR for the same period
- Churn segmented by at least one dimension (ACV tier, acquisition cohort, or segment)
- Voluntary vs. involuntary churn split for the trailing 90 days
- 12-month cohort retention table with at least 6 months of data
- Time-to-first-value or activation rate for new customers in the period
- Annualized churn rate calculated using compound formula, not linear multiplication
- Named owner for each churn input assumption in the financial model
- One specific change being made this quarter, with a named owner and a 90-day expected impact
The first five items take about a day to pull if you have clean billing data. The cohort table adds another two days. If any of these are currently absent from your monthly review, you are making retention decisions without the inputs that would change them.
Moving from churn data to retention strategy
Customer churn rate is not the metric you want to watch. It is the output of a set of decisions - about ICP, onboarding, pricing structure, and customer success resourcing - that were made months earlier. The number you see today reflects choices that are already in the past.
What you can change is the decision quality behind the next set of inputs: cleaner cohort data, correctly segmented, with named owners on the assumptions. That is the difference between a churn rate that gets reported and one that gets reduced.
If your churn metrics are currently reported at the blended level without cohort or segment breakdown, start there. The diagnosis that comes out of a properly structured cohort analysis will redirect your next three operational investments more precisely than any single retention tactic.
Audit your metrics definitions and forecasting model - reach out to Fiscallion to work through the structure with a fresh set of eyes.
