
If you're running a SaaS business, you've probably heard "unit economics" in every board conversation and fundraising deck. But the term gets used loosely - sometimes to mean CAC payback, sometimes to mean LTV:CAC ratio, sometimes to mean gross margin contribution per customer.
This guide cuts through that ambiguity. You'll get precise definitions, calculation methods, benchmark ranges, and - most importantly - what to do when a metric is moving in the wrong direction. The goal is not a better dashboard. The goal is sharper decisions on acquisition spend, pricing, headcount, and runway.
What you'll learn
- What SaaS unit economics actually measures and why most teams get the definition wrong
- How to calculate CAC, LTV, payback period, and the Rule of 40 with the right inputs
- Benchmark ranges by growth stage and what movements in each metric signal
- The five most common unit economics mistakes at $5–50M ARR - and the replacement moves
- How to build a decision-ready unit economics framework your board can use
What we'll cover
- What SaaS economics is and why it differs from other business models
- What a "SaaS unit" actually is
- Core metrics: CAC, LTV, gross margin, and payback period
- The LTV:CAC ratio and how to interpret it as a range, not a number
- The Rule of 40: what McKinsey's research actually says
- How AI-native products change the unit economics calculation
- Common mistakes and replacement moves
- A decision-ready unit economics checklist
What SaaS economics is - and why it's structurally different
SaaS economics refers to the financial dynamics that determine whether a subscription software business creates or destroys value at the unit level. The central question is simple: does the lifetime revenue generated by a customer exceed the cost of acquiring and serving that customer?
But the structural difference from traditional businesses is what makes SaaS economics distinct. In a product business, you sell something once and collect cash upfront. In SaaS, you spend the acquisition cost on day one and collect revenue in small monthly or annual increments over months or years. That lag is the core tension in SaaS finance.
Three structural features make SaaS economics a separate discipline:
- Revenue is deferred. You sign a customer in January but only recognize revenue monthly. A fast-growing SaaS business can look profitable on a cash basis while destroying economic value.
- Churn is compounding. A 2% monthly churn sounds modest. Over 12 months, it means you lose roughly 22% of your customer base. The model penalizes you for slow churners just as much as fast ones.
- Gross margin is a multiplier. A company with 80% gross margins and a 3:1 LTV:CAC ratio is in a fundamentally stronger position than one with 50% gross margins and the same ratio - because the actual dollar return per dollar spent is far higher.
Understanding SaaS economics means understanding these three structural forces together - not tracking each metric in isolation on a dashboard.
SaaS economics vs. traditional business economics
What a SaaS unit actually is
This is a question that sounds basic but causes real confusion when teams start calculating CAC and LTV.
A "unit" in SaaS unit economics is typically a customer - but it needs to be defined clearly before you run any numbers. Different definitions produce materially different results.
The three most common unit definitions:
- A customer account. The most common starting point. One contract = one unit. Works well if you have homogeneous customers.
- A customer cohort. A group of customers acquired in the same period (month, quarter, year). This is the correct level for measuring churn behavior and LTV over time.
- A seat or user. Used in per-seat pricing models. CAC per seat can be calculated, but LTV per seat requires assumptions about seat expansion and churn that get complicated quickly.
At Fiscallion, when we work with a $10M–$30M ARR company, we typically start by defining the unit at the customer account + acquisition cohort level. This gives you both a point-in-time number for investor conversations and a trajectory view for internal decisions.
The unit definition matters because it determines:
- Whether you include expansion revenue in LTV (you should)
- Whether your CAC denominator is "new logos" only or includes expansion spend (it should be new logos only for acquisition CAC)
- Whether a "churned unit" is a full account cancellation or a seat reduction (different cash flow implications)
If your team argues about CAC during board prep, the disagreement is almost always upstream - it's about unit definition, not math.
A case from a Fiscallion engagement shows exactly how this plays out: A CFO and a VP of Sales arrived at the same board meeting with two different CAC numbers — $18,400 and $11,200 — for the same time period. Neither was wrong. The CFO was calculating fully-loaded acquisition cost including SDR salaries and allocated marketing time. The VP was calculating direct sales commissions and program spend only. The fix was a two-row table with both definitions written out explicitly.
Core metrics: how to calculate the numbers that actually matter
Customer acquisition cost (CAC)
Definition: The total cost required to acquire one new paying customer.
Formula:
CAC = Total sales and marketing spend ÷ Number of new customers acquired
Both figures should use the same period. If you spent $200K on S&M in Q3 and acquired 40 new customers in Q3, CAC = $5,000.
What to include in the numerator:
- All sales salaries, commissions, and variable comp
- Marketing salaries and contractor costs
- Paid media and demand generation spend
- Sales tools, CRM, and attribution software costs
- Allocated overhead for customer-facing roles (fractional)
Common input errors that inflate or deflate CAC:
CAC benchmarks by stage:
These are ranges, not targets. A $3,000 CAC at a $50/month product is very different economics from a $3,000 CAC at a $500/month product.
Customer lifetime value (LTV)
Definition: The total gross profit contribution a customer generates from acquisition through churn.
Simple formula:
LTV = (Average MRR per customer × Gross margin %) ÷ Monthly churn rate
More complete formula that includes expansion:
LTV = (ARPU × Gross margin %) ÷ (Churn rate - Expansion rate)
Where ARPU is average revenue per user/account, and expansion rate reflects net revenue from upsells and cross-sells.
Why gross margin, not revenue:
LTV calculated on revenue looks fine but tells you nothing about cash. Gross margin LTV tells you the actual contribution available to cover S&M spend, G&A, and R&D. At 60% gross margins, an LTV of $30,000 (revenue basis) becomes $18,000 in contribution - a materially different picture for capital allocation.
LTV is a range, not a number. Treat it as a confidence interval across your cohort history:
- Best-case LTV: top retention cohort, high expansion
- Base-case LTV: median cohort behavior
- Stress-case LTV: cohorts with 20-30% higher churn than current median
A company that reports a single LTV number to its board is presenting false precision. The correct presentation is: "Our base-case LTV is $18,000, with a range of $12,000–$24,000 depending on cohort vintage."
The LTV:CAC ratio
Definition: How many dollars of gross margin contribution you generate for each dollar spent acquiring a customer.
Formula:
LTV:CAC ratio = LTV ÷ CAC
What the ratio tells you:
The 3:1 benchmark is widely cited, but it's a starting point for a conversation, not a pass/fail grade. Context matters: a 2.5:1 ratio with a 9-month payback period and 120% NRR is a better business than a 4:1 ratio with a 36-month payback and 95% NRR.
The cohort view matters. If you calculate a blended LTV:CAC of 3.2:1 but your most recent cohort shows 1.8:1, your headline number is hiding a deteriorating trend. Most companies that come to Fiscallion arguing about their CAC figure are actually looking at a blended number that masks cohort-level decay.
CAC payback period
Definition: How many months it takes to recover the cost of acquiring a customer through gross profit contribution.
Formula:
CAC payback period = CAC ÷ (ARPU × Gross margin %)
Why payback period matters more than LTV:CAC for runway decisions:
LTV:CAC is a long-horizon ratio. It tells you eventual return, not cash timing. If you're managing cash runway at $8M ARR and your payback period is 28 months, you are effectively pre-financing 28 months of customer value before seeing a dollar of gross profit back. That has a direct effect on cash burn and fundraising timing.
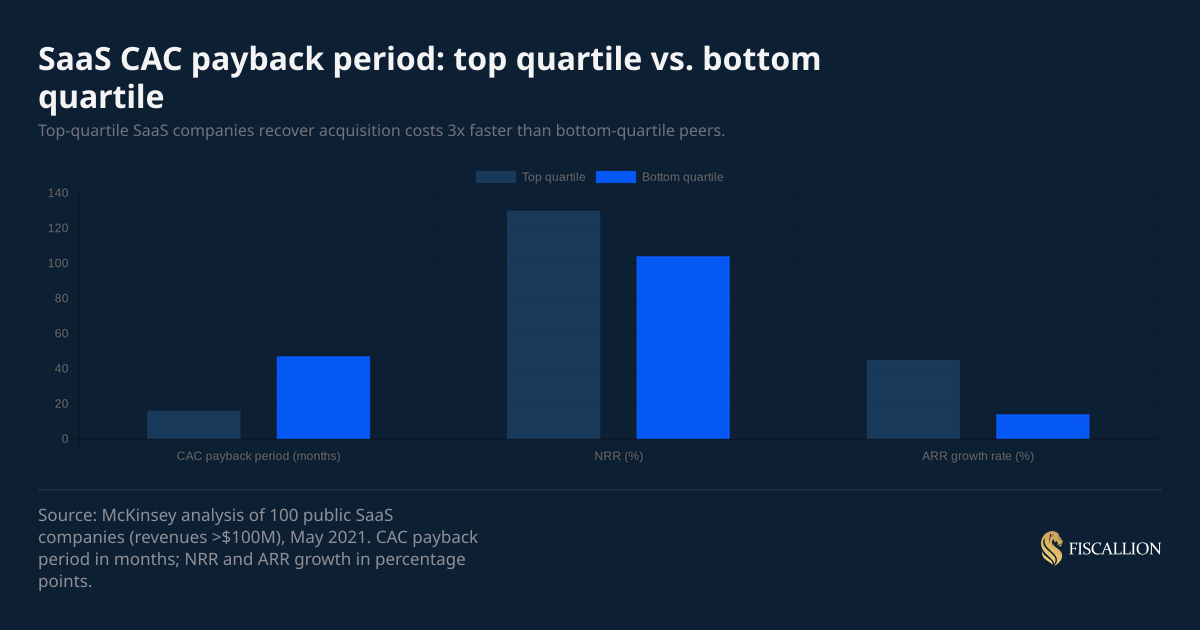
Payback benchmarks from McKinsey's analysis of 100+ public SaaS companies:
- Top-quartile companies: median payback of 16 months
- Bottom-quartile companies: median payback of 47 months
At the $5–20M ARR stage, you should be targeting a payback period of 12–24 months for SMB-focused products and 18–36 months for mid-market or enterprise. Anything above 30 months at the SMB level is a warning signal that either CAC is too high, ARPU is too low, or gross margins need attention.
Gross margin: the metric that modifies everything else
SaaS gross margin is not a standalone metric - it's a multiplier that changes the meaning of every other unit economics figure.
Formula:
Gross margin % = (Revenue - COGS) ÷ Revenue × 100
What belongs in SaaS COGS:
- Cloud infrastructure and hosting costs
- Third-party API and data costs
- Customer support costs (personnel and tools) — specifically teams focused on retention and satisfaction, not upsell/cross-sell
- Payments processing fees
- Allocated amortization of capitalized development costs (where applicable)
What does NOT belong in COGS:
- Sales and marketing
- R&D/product development
- G&A
- Customer success activities focused on renewals, expansion, or account management (those belong in S&M)
SaaS Capital, which has reviewed thousands of SaaS company financial statements, notes that GAAP does not clearly define what belongs in a SaaS company's Cost of Sales — meaning each company is largely left to its own judgment. Their recommendation, consistent with the most common practice they observe: gross margins on pure SaaS license revenue should fall in the 80–85% range for well-structured businesses.
Gross margin benchmarks:
If your gross margin is below 60% and you're reporting unit economics to investors using revenue-based LTV, you are overstating the quality of your economics. Gross margin is the filter through which all unit-level returns must pass.
Net revenue retention: the compounding engine behind good unit economics
Net revenue retention (NRR) - sometimes called net dollar retention (NDR) - measures how much revenue you retain and expand from your existing customer base over a 12-month period, expressed as a percentage.
Formula:
NRR = (Starting MRR + Expansion MRR - Contraction MRR - Churned MRR) ÷ Starting MRR × 100
Why NRR changes the unit economics picture:
A company with 120% NRR is growing 20% per year without signing a single new customer. That changes the denominator of your CAC efficiency calculation entirely - every dollar of acquisition spend gets multiplied by the expansion behavior of the cohort over time.
McKinsey's analysis of 40 public B2B SaaS companies found that those with NRR of 120%+ had a median EV/revenue multiple of 21x compared to 9x for those below 120%. That's not a marginal difference - it's the single metric with the strongest correlation to valuation. Top-performing companies such as Twilio (139%), CrowdStrike (128%), and Elastic (130%) demonstrate this in practice.
It's worth noting that NRR benchmarks have shifted in recent years. OpenView's 2023 SaaS Benchmarks Report, based on 710 operator responses, found that even top-quartile expansion-stage companies saw NRR compress from 119% to 107% year-on-year — a signal that expansion revenue is harder to sustain than it was in 2021–2022. Your benchmarks should reflect the current environment, not the peak.
NRR benchmarks:
The Rule of 40 in SaaS: what McKinsey's research actually says
The Rule of 40 is one of the most quoted metrics in SaaS, and also one of the most misunderstood at the $5–50M ARR stage.
Definition: A SaaS company's revenue growth rate plus its free cash flow (FCF) margin should equal 40% or higher.
Formula:
Rule of 40 score = Revenue growth rate (%) + FCF margin (%)
Example:
- Revenue growing at 25% YoY
- FCF margin of 18%
- Rule of 40 score = 43 - above threshold
McKinsey's 2021 analysis of 200+ software companies found that companies exceed Rule of 40 performance only 16% of the time. Fewer than one-third consistently achieved it. Yet investors reward those that do with consistently higher EV/revenue multiples — top-quartile Rule of 40 companies generated nearly 3x the multiples of bottom-quartile peers. McKinsey's research covered 100 public US SaaS companies with revenues above $100M, with the median revenue growth rate at just 22% — well below the "hypergrowth" narrative most teams benchmark against.
Three valid interpretations of "FCF margin" in the formula:
Different analysts substitute different profitability metrics. Know which version your board or investors are using:
What the Rule of 40 means at the $5–50M ARR stage:
The Rule of 40 was designed for larger public SaaS companies (McKinsey's study focused on companies with revenue above $100M). At your stage, it functions as a directional health check, not a pass/fail gate.
At $5–15M ARR, a Rule of 40 score of 20–30 with improving trajectory is more meaningful than a static 40+ score achieved by cutting headcount. The direction and the inputs matter more than the composite number.
The more actionable question at your stage: Is your growth rate declining faster than your margin is improving? If yes, you have a structural problem that no dashboard will solve.
McKinsey identified four metrics most highly correlated with Rule of 40 performance across their sample: LTM free cash flow percentage, CAC payback period (top-quartile median: 16 months), net revenue retention (top-quartile median: 130%), and ARR growth rate (top-quartile median: 45%). Of roughly 20 operational metrics assessed, these four had the strongest relationship with EV/revenue multiples — most commonly tracked metrics showed almost no correlation.

Is ChatGPT considered SaaS?
This question comes up regularly as AI tools reshape how companies categorize software products - and it has a direct bearing on how you think about unit economics for AI-powered products in your own stack or portfolio.
The short answer: yes, ChatGPT is a SaaS product by most working definitions.
ChatGPT (specifically the consumer and business subscription tiers) meets the core criteria:
- Delivered over the internet via web browser and API - no software installed locally
- Subscription-based pricing (ChatGPT Plus at $20/month, Team and Enterprise at higher tiers) with pay-per-use API access
- Multi-tenant architecture hosted and maintained by OpenAI - customers access shared infrastructure
- No version management required by the customer - OpenAI handles all updates and model changes
Where ChatGPT gets complicated for pure-SaaS classification:
- Usage-based pricing at the API layer. ChatGPT's API pricing is consumption-based (per token), which is closer to Infrastructure-as-a-Service (IaaS) economics. The SaaS subscription wrapper sits on top of an underlying usage model. This means unit economics behave differently - gross margins are more variable, cost of revenue scales with usage intensity, and LTV modeling requires usage assumptions.
- The product itself is a platform that powers other SaaS products. Many $5–50M ARR SaaS companies are building on top of OpenAI's APIs. If you are one of them, the relevant unit economics question is: what does your AI-driven COGS do to your gross margin, and does your pricing model absorb it?
- For B2B subscribers: ChatGPT Business and Enterprise are clearly SaaS - seat-based pricing, centralized admin, contract terms, and data governance. The unit economics analysis (CAC, LTV, payback, NRR) applies directly.
The practical implication for founders: If you are benchmarking your unit economics against "SaaS averages" but your product has embedded AI costs that scale with usage, your gross margin targets need adjustment. A 75% gross margin benchmark assumes relatively fixed COGS. An AI-native SaaS product might structurally land at 55–65% gross margin — and that changes every LTV and Rule of 40 calculation downstream. OpenView's benchmarks found that AI-native companies monetizing AI (not just featuring it) were 1.5x more likely to be outlier performers — but their unit economics require a separate model, not a copy-paste from traditional SaaS benchmarks.
Common unit economics mistakes - and the replacement moves
Most teams at $5–50M ARR don't have bad intentions around unit economics. They have bad habits - most of which were inherited from investor decks rather than built from operational reality.
Mistake 1: Treating CAC and LTV as single numbers
What happens: You calculate one blended CAC and one LTV figure, put them on a slide, and present a 3.2:1 ratio. The board nods. Nothing changes.
The problem: A blended number hides segment-level decay. Your enterprise segment might show a 5:1 ratio while your SMB segment is destroying value at 0.8:1. You're cross-subsidizing bad economics with good, and reporting the average.
Replacement move: Break CAC and LTV by acquisition channel, customer segment (by ACV tier), and cohort vintage. Present as ranges, not points. Assign someone specific ownership of the inputs, not just the outputs.
Mistake 2: Using revenue-based LTV instead of gross margin LTV
What happens: LTV = ARPU ÷ churn. Looks great at $18,000. Then you close a fundraising conversation and the investor asks: "What's your gross margin?" The numbers don't connect.
Replacement move: Always calculate LTV on gross margin contribution. Run it on both bases in a model, note the difference, and present the gross margin version as your operating number.
Mistake 3: Ignoring payback period when making hiring decisions
What happens: You're at 18 months payback, burning $400K/month, with 14 months of runway. The head of sales asks for two more AEs. The model doesn't exist to evaluate the decision, so you hire on intuition.
Replacement move: Model payback period impact before approving headcount in S&M. If adding two AEs increases S&M spend by 30% but you don't have a pipeline model showing proportional new logo growth, the effective payback period extends - and runway shortens.
Mistake 4: Reporting gross margin without separating customer success costs
What happens: CS costs get loaded into COGS because they're "customer-facing." Gross margin drops to 55%. You report that as a structural floor. In reality, a well-run company at your scale should be at 70%+.
Replacement move: Separate CS costs into two buckets: onboarding costs (arguably COGS) and ongoing success management (closer to retention spend, which belongs in S&M or a separate retention cost category). SaaS Capital's COGS framework is direct on this: if a CS team member is focused on renewal, revenue, or persuasion, they belong in S&M — not COGS. Calculate gross margin both ways and know which version you're using when.
Mistake 5: Treating the Rule of 40 as a target instead of a diagnostic
What happens: You're told to "hit Rule of 40." You cut R&D headcount by 20%, FCF margin improves by 8 points, and you technically cross 40. Investors seem satisfied. Then NRR drops six months later because you gutted the product roadmap.
Replacement move: Decompose Rule of 40 into its causal drivers. If you're below 40, determine whether the gap is a growth problem, a margin problem, or a capital efficiency problem. Each has a different fix. Cutting headcount to chase a composite number is the most expensive way to improve a ratio temporarily.
One engagement shows what that trade-off costs in practice: A company at $19M ARR was under pressure to improve their Rule of 40 score of 28 before a Series C process. They cut two CS roles and paused a planned R&D hire. The score moved to 34 for one quarter. Six months later NRR had dropped from 107% to 99%, two enterprise expansion conversations had gone quiet, and the product roadmap had slipped a quarter on a feature three customers had been promised.
What to do next: seven actions in order of impact
The decisions below are ordered by the frequency with which they change outcomes at $5–50M ARR. Each has a named owner because metrics without ownership are decoration.
- Define your unit and lock the definition in writing. (Owner: Head of Finance or Founder) Decide whether "unit" means a customer account, a cohort, or a seat. Document inclusion/exclusion rules for CAC and LTV inputs. Do this before recalculating anything.
- Rebuild CAC from fully-loaded costs. (Owner: Finance) Pull every S&M cost for the last four quarters - salaries, commissions, tools, paid media, contractor fees. Divide by new logos only. Compare to your previously reported figure.
- Calculate LTV on gross margin, by cohort. (Owner: Finance + RevOps) Run LTV for customers acquired in each of the last six quarters using actual retention and expansion data. Map the range. If the most recent cohort shows declining LTV, name the cause.
- Calculate payback period and map it to cash runway. (Owner: CFO or Founder) Payback period tells you how long you're pre-financing customer value. If that number is approaching or exceeding your available cash runway, it is the most urgent item in your next board deck.
- Track NRR monthly, not quarterly. (Owner: RevOps + Finance) If NRR is declining, it will show up in monthly data 60–90 days before it damages your annual headline number. Early signal requires monthly tracking.
- Calculate your Rule of 40 score for the last four quarters. (Owner: Finance) Track trend, not just the current number. Is it improving or deteriorating? If improving, what's driving it - growth or margin? If deteriorating, which component is moving faster?
- Present unit economics as a range with stated assumptions. (Owner: Founder + Board prep) In your next board deck, replace the single-number slide with a table showing base case, upside case, and stress case. Assign each input an owner. This is the difference between reporting history and framing decisions.
Decision-ready unit economics: a working checklist
Most unit economics failures are not calculation errors. They are definition and ownership problems. This checklist is designed to catch both before your next board meeting.
Definitions and inputs
- Unit defined in writing (account, cohort, or seat) with inclusion/exclusion rules
- CAC calculated on fully-loaded S&M costs, new logos only
- LTV calculated on gross margin contribution, not revenue
- Gross margin calculated with appropriate COGS classification (CS costs separated)
- Expansion revenue included in LTV calculation with explicit assumption
Calculations
- LTV:CAC ratio calculated by segment (not just blended)
- CAC payback period calculated and mapped to cash runway
- NRR calculated for last 12 months and tracked monthly
- Rule of 40 score calculated using FCF margin (not EBITDA)
- Cohort-level LTV calculated for last 4–6 acquisition cohorts
Interpretation and action
- LTV:CAC presented as a range (stress / base / upside)
- Trend identified: are unit economics improving or deteriorating quarter-over-quarter?
- Named owner for each key input (not just the output metric)
- Payback period stress-tested against a 20% increase in CAC
- Rule of 40 decomposed - growth component vs. margin component trend
Board and investor readiness
- Metrics definitions written down and consistent with prior period presentations
- Cohort data visualized - not just the blended number
- Trade-off framed: what would it cost to improve each metric by 10 points, and what does that do to runway?
Your unit economics model is only as useful as the decisions it changes
SaaS unit economics is not a reporting exercise. It is the analytical foundation for every major capital allocation decision you make - whether to hire in S&M, which customer segment to double down on, whether your payback period is compatible with your cash position, and how to position growth vs. profitability for your next raise.
The companies that get this right at $5–50M ARR don't have more metrics. They have better-defined inputs, ownership at the assumption level, and a consistent practice of presenting economics as ranges rather than single numbers.
The most common failure mode Fiscallion sees is not incorrect math - it's a mismatch between what the metrics say and what decisions they're actually informing. CAC and LTV get calculated for the deck. They don't get used to decide whether the next two AE hires extend or compress payback period. That's the gap worth closing.
If you want to audit your current metrics definitions and see where your unit economics model has implicit assumptions that nobody owns, start with the checklist above - and get the working template to run the numbers in a format your board can interrogate.
Get the unit economics template and run your CAC, LTV, payback period, and Rule of 40 in one place - reach out to Fiscallion to get it set up against your actual numbers.
Frequently asked questions
What is SaaS economics?
SaaS economics describes the financial mechanics that determine whether a subscription software business creates value at the individual customer level. It encompasses how much it costs to acquire a customer (CAC), how much gross profit that customer generates over their lifetime (LTV), how quickly those costs are recovered (payback period), and how efficiently the business balances growth and profitability (Rule of 40, NRR). The defining structural feature of SaaS economics is the time lag between upfront acquisition spend and deferred revenue recovery - a dynamic that makes cash management, churn, and gross margin far more consequential than in traditional product or services businesses.
What is a SaaS unit?
A SaaS unit is the base entity used to measure unit economics. It is most commonly defined as a single customer account, though it can also be defined as a cohort (a group of customers acquired in the same period) or a seat/user in per-seat pricing models. The definition matters because it determines how CAC and LTV are calculated, whether expansion revenue is included in lifetime value, and how churn is measured. There is no single universal definition - the right unit depends on your pricing model and the decisions you need the economics to inform. What matters most is consistency: once defined, the unit definition should be locked and applied uniformly across all calculations and reporting periods.
What is the Rule of 40 in McKinsey SaaS?
The Rule of 40 states that a SaaS company's revenue growth rate plus its free cash flow margin should equal 40% or higher. McKinsey's research on 200+ software companies found that only 16% of companies exceeded this threshold, and fewer still sustained it consistently. Companies that do achieve and maintain Rule of 40 performance receive significantly higher valuation multiples from investors - McKinsey found top-quartile Rule of 40 companies generated nearly three times the EV/revenue multiples of bottom-quartile peers. McKinsey's analysis also identified four metrics most highly correlated with Rule of 40 performance: LTM free cash flow percentage, CAC payback period (top quartile median: 16 months), net revenue retention (top quartile: 130%), and ARR growth rate (top quartile: 45%). For companies at $5–50M ARR, the Rule of 40 is best used as a directional diagnostic and trend indicator rather than a binary pass/fail gate.
Is ChatGPT considered SaaS?
Yes, ChatGPT is broadly classified as a SaaS product, particularly for its subscription-based consumer and business tiers (Plus, Team, Enterprise). It is delivered over the internet with no local software installation, maintained by OpenAI on shared infrastructure, and priced on a subscription or usage basis. However, at the API layer, ChatGPT follows a usage-based (consumption) pricing model more aligned with IaaS economics - gross margins are more variable and scale with usage intensity. For SaaS founders building AI-native products on top of models like GPT-4o, the practical unit economics implication is that embedded AI costs can compress gross margins to 55–65% versus the 70–85% typical of pure software SaaS. This changes LTV calculations, payback period assumptions, and Rule of 40 interpretation - and should be reflected explicitly in your unit economics model rather than averaged into a blended COGS figure.
