

In startup finance, valuation isn't a static prize you win—it’s a variable driven by growth velocity, capital efficiency, and market benchmarks. Defending a arbitrary number based on 'feel' is the fastest way to let a term sheet collapse during due diligence. This guide cuts through the venture capital noise to hand you the five core valuation methodologies used by institutional investors, showing you exactly how to stress-test their offers before you sign.
Key takeaways
- No single valuation method is correct. The right approach depends on your stage, revenue visibility, and what the counterparty is trying to achieve.
- Revenue multiples dominate Series A through C for SaaS — but the multiple is not static. It moves with ARR growth rate, net revenue retention (NRR), and Rule of 40 score.
- While theoretically rigorous, a Discounted Cash Flow (DCF) model is highly unreliable before a startup achieves stable unit economics.
- Every method has inputs someone must own. If no one owns the assumptions, the valuation number is decoration.
- Knowing how investors apply each method allows you to stress-test their offer with data, not intuition.
Why one method is never enough
Most formal valuation work — whether for fundraising, M&A, or internal planning — uses two or three methods simultaneously and then triangulates. This is not because each method is weak. It is because each method illuminates a different dimension of value.
A revenue multiple tells you what comparable businesses trade for right now. A DCF tells you what the cash flows are worth if your assumptions hold. A VC method tells you what return profile the investment needs to clear a threshold. No single lens gives you the full picture.
At Fiscallion, when we work through valuation prep with founders ahead of a Series B or C process, we typically build three concurrent models: a comparable transactions analysis, a revenue multiple benchmark, and a VC method back-calculation. Then we check whether the three answers land in the same zip code. If they do not, we go back to the assumptions.
The stage of the business largely determines which method carries the most weight.
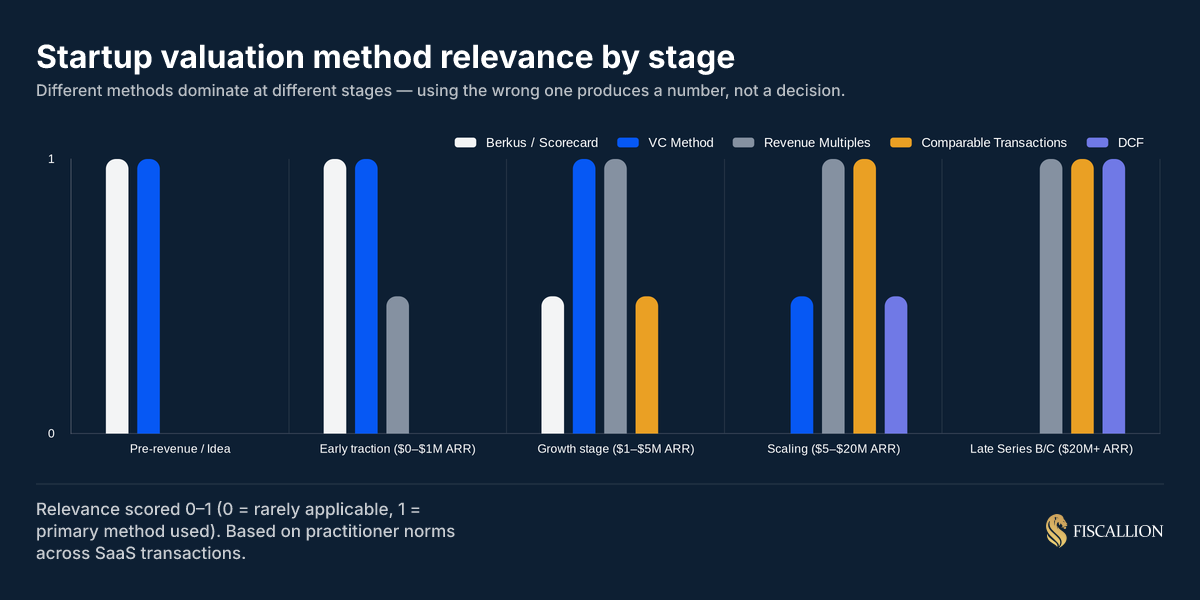
Method 1: Revenue multiples (the primary method for scaling SaaS)
What it is and why it dominates
Revenue multiples are the standard valuation language for B2B SaaS from Series A through exit. Because most SaaS companies reinvest aggressively and show negative EBITDA, earnings-based multiples are often not meaningful. The EV/ARR or EV/Revenue multiple fills that gap.
Formula:
Valuation = ARR (or TTM Revenue) × Multiple
So a company with $10M ARR at a 7x multiple is valued at $70M. Simple enough. The complexity is entirely in determining the right multiple. If your ARR definition is inconsistent across your board deck and investor materials, the multiple debate starts before it should.
What drives the multiple
The multiple is not arbitrary. It is set by the market at any point in time and then adjusted up or down based on company-specific factors.
As of early 2026, public SaaS companies trade at a median EV/Revenue of approximately 3.4x — well below the 2021 peak of 18–19x and below the 2025 start of ~7x. The SaaS Capital Index tracks these public B2B SaaS multiples on a rolling basis and is one of the most reliable benchmarks for current market conditions. Private SaaS M&A transactions have historically traded at a discount to public comparables, with a median around 4.5x EV/Revenue across 543 disclosed deals since 2015, and a top-quartile clearing above 8.1x.
The three variables that move your private multiple most are:
McKinsey's analysis of the Rule of 40 — which defines the metric as the sum of a software company's revenue growth rate and EBITDA margin — found that companies exceeding a score of 40 generated 15% higher shareholder returns than those below it, compounding over time. BCG's 2025 follow-up research confirmed that top Rule of 40 performers sustain that advantage through disciplined cost allocation, not just growth. Those findings translate directly into the multiple compression or expansion you see in private market negotiations.
The trap: treating the multiple as the answer
The multiple is a market-derived input, not a conclusion. Applying a 7x multiple to $10M ARR gives you a headline number. It does not tell you whether that multiple is defensible for your specific company, at your specific NRR, with your specific growth trajectory.
When you present a revenue multiple valuation, you need to show the comparable set, why your metrics justify where you are in the distribution, and how sensitive the output is to a 1–2x multiple shift. Investors will apply their own multiple. If you have not stress-tested yours, their version becomes the reference point.
The key shift required during negotiations is moving from blindly asserting a target valuation number to systematically deriving it from comparative performance indicators. Approaching the table with data-backed parameters forces the counterparty to argue against facts rather than intuition.
Method 2: Discounted Cash Flow (DCF)
What it is
DCF calculates the present value of all future free cash flows, discounted back to today at a rate that reflects the risk of the business. In theory, it is the most complete valuation approach because it forces you to make explicit assumptions about growth, margins, capital efficiency, and terminal value.
Formula:
Valuation = Σ [FCFt / (1 + r)^t] + [Terminal Value / (1 + r)^n]
Where:
- FCFt = free cash flow in period t
- r = discount rate (typically WACC or required return)
- Terminal Value = the value of all cash flows beyond the explicit forecast period
When it works and when it does not
DCF is genuinely useful when you have:
- 18+ months of consistent revenue and margin history
- Predictable churn and expansion patterns you can model by cohort
- A clear line of sight to profitability or a defined capital plan to get there
It produces unreliable outputs when applied to early-stage companies. NYU Stern professor Aswath Damodaran — whose work on startup valuation is among the most cited in the field — notes that applying DCF to young and growth companies requires making narrative assumptions explicit rather than hiding them in numbers. A Series A company forecasting five years of cash flows is building a model almost entirely on assumptions — revenue growth, margin trajectory, churn, expansion, terminal multiple. Each assumption multiplies uncertainty through the model. You can produce any valuation you want by adjusting one input at year three.
For a scaling SaaS company at $5–20M ARR, DCF is most useful as a sanity check or a board-level stress test, not as the primary method.
When investors anchor negotiations around speculative long-term cash flow models, the most effective response is to pivot away from arbitrary math and return to immediate market realities. Rather than declining the analysis entirely, leaders should gently point out the limitations of using long-range projections at this maturity tie.
Use it to test: "If we hit these growth and margin milestones, what does the business need to be worth at exit to justify today's valuation?" That is actually the VC method calculation run in reverse.
Inputs you need to own
For a DCF to be credible, someone must own every assumption explicitly:
- Revenue growth rate by year — not a single flat assumption, but a cohort-grounded forecast with stated logic
- Gross margin trajectory — how does it improve as engineering and infrastructure costs are spread over more ARR?
- Operating expense as a percentage of revenue — what is the path to the target margin structure?
- Discount rate — typically 15–25% for early-stage venture-backed SaaS, higher for pre-revenue or pre-product-market fit
- Terminal growth rate — usually 2–5%, representing long-run nominal GDP growth
If the person presenting the DCF cannot defend each of these from a model with sourced assumptions, the output is not a valuation — it is wishful arithmetic.
Method 3: Comparable company analysis (public comps)
What it is
Comparable company analysis (also called "trading comps" or "public comps") values your company by reference to what similar public companies trade for. The logic is straightforward: if companies with similar revenue, growth, and margin profiles trade at a specific range of multiples, your private company should trade somewhere in that range — typically at a discount to reflect illiquidity and execution risk.
The process:
- Build a set of public comparables — companies with similar ARR scale, business model, vertical, and growth profile.
- Calculate key trading multiples across the comp set (EV/Revenue, EV/ARR, EV/EBITDA where applicable).
- Identify where your company sits in the distribution based on its metric profile.
- Apply a private company discount (typically 20–35%) to account for illiquidity.
Reading the current market
At Fiscallion, we track where private company valuations move relative to public benchmarks because it directly affects what a realistic valuation range looks like for a client preparing for a raise.
The chart below shows how dramatically public multiples have shifted:
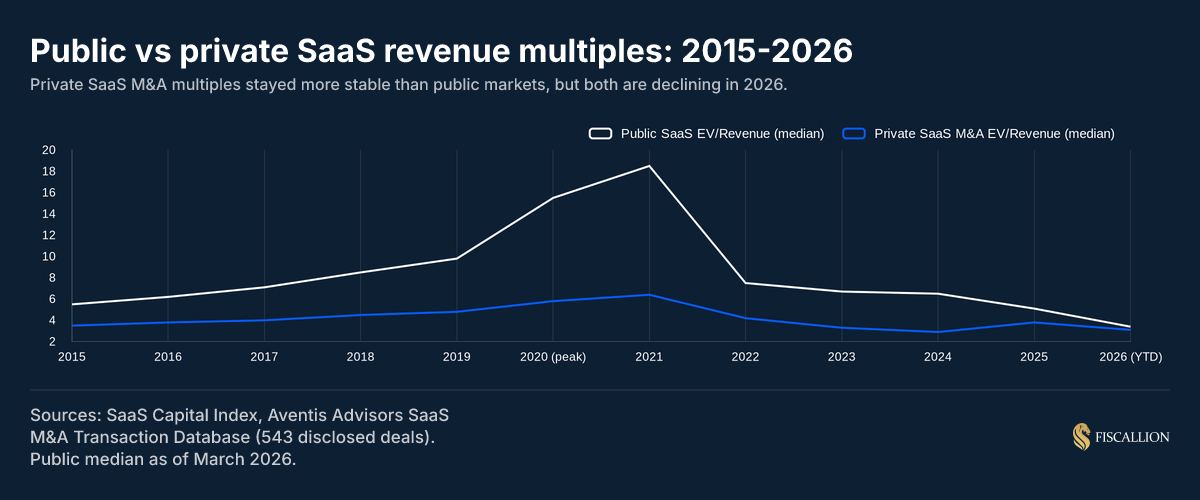
The 2021 peak of ~18–19x median EV/Revenue for public SaaS was not a baseline — it was a distortion driven by near-zero interest rates and speculative multiple expansion. The current environment (3.4x median public EV/Revenue as of March 2026) is closer to a normalized market, not a temporary trough. Software Equity Group's quarterly SaaS M&A and public market reports track the delta between public and private multiples across deal sizes, and are one of the most granular sources for real transaction data.
For private companies, the implication is that a range of 3–6x ARR for a typical scaling SaaS business is defensible in current conditions. Companies with exceptional NRR, ARR growth above 30%, or strong Rule of 40 scores can justify moving toward the upper end. Companies with slowing growth, negative NRR, or margin deterioration compress toward the lower end.
The trap: cherry-picking the comp set
The most common error in comparable company analysis is building a comp set that flatters rather than informs. Using only the top-quartile public SaaS companies as comparables, ignoring companies with similar scale or similar growth rates, produces an inflated anchor number. Investors will reconstruct the comp set on their own terms. Know your honest comp set before the conversation begins.
Method 4: Comparable transactions analysis (M&A comps)
What it is
Where public comps use trading multiples from equity markets, comparable transactions analysis uses multiples from actual acquisition deals. This is particularly relevant if your planning horizon includes an M&A exit rather than an IPO, or if you are raising growth equity and need to demonstrate exit optionality to investors.
The median private SaaS M&A transaction has traded at approximately 4.5x EV/Revenue across 543 disclosed deals from 2015 to early 2026 (Aventis Advisors). The top quartile clears above 8.1x. Notably, deal size is the single strongest driver of where you land in that distribution — companies transacting at $50–100M ARR consistently achieve multiples nearly twice those of companies at $20–50M ARR.
What drives the transactions premium:
- Strategic value — acquisitions where the buyer integrates the product into an existing platform often carry a significant premium over financial-only buyers.
- NRR and churn — high NRR signals that the acquirer is buying predictable, growing recurring revenue, not just current ARR. Software Equity Group's analysis of how net revenue retention impacts SaaS valuations quantifies this relationship across public comps and is worth studying before entering any M&A process.
- Clean books and metrics — companies with audit-ready financials, defined ARR vs. revenue distinction, and documented unit economics move through diligence faster and with fewer haircuts. Our due diligence checklist for startups covers exactly what investors examine at Series A through Series C.
- Proprietary AI or data — in the current environment, acquirers are distinguishing between SaaS companies that have integrated AI at the product level and those that have added it as a wrapper. The former command premiums; the latter increasingly do not.
What this means for your internal planning
If your five-year model assumes a 6–8x ARR exit, you need to trace specifically what NRR, growth rate, and ARR scale gets you into the upper quartile of the transaction distribution. That is not a narrative assumption — it is a financial model with cohort data behind it. The founders who get premium exit multiples almost always have multi-year track records of the metrics that justify them.
Method 5: Venture Capital (VC) method
What it is
The VC method works backward from a required exit return. An investor with a specific return target and a specific fund life calculates what they can pay today given an expected exit valuation and dilution path.
The core logic:
Post-money Valuation = Expected Exit Value / Required Return Multiple
Pre-money Valuation = Post-money Valuation - Investment Amount
Example:
A VC expects your company to sell for $200M in five years. They need a 10x return. They plan to invest $5M.
Post-money = $200M / 10 = $20M
Pre-money = $20M - $5M = $15M
From that starting point, the investor works backward to validate whether your current metrics and growth trajectory are consistent with a $200M exit. If the numbers do not support it, either the pre-money comes down, or the exit assumption needs to change.
As Damodaran's framework for venture capital valuation describes it, the VC method essentially applies a target return — set much higher than a traditional cost of equity — to a projected exit value derived from comparable public company multiples. The mechanics are simple. The discipline required to defend the exit assumption is not.
What you learn by running this yourself
The VC method is one of the most useful exercises a founder can run before entering a term sheet conversation. Run it from the investor's perspective:
- What is a realistic exit value given your market size, competitive position, and comparable transaction data?
- What return multiple is the fund likely targeting given their stage and vintage?
- Back-calculate the pre-money valuation their model implies.
- Compare that to your own valuation expectation.
If there is a gap, that gap is the negotiation. You can close it by challenging the exit assumption (making the case that $200M underestimates the exit), by defending the return multiple (making the case that 7x rather than 10x is appropriate for a lower-risk business), or by restructuring the deal terms.
Understanding the VC method also helps you evaluate the pre-money vs post-money valuation distinction clearly, because the VC method is where that difference has the largest practical impact on your ownership percentage.
Answering the core valuation questions
What is the best valuation method for a startup?
There is no universally best method. For a revenue-generating SaaS company at $5–50M ARR, revenue multiples benchmarked against comparable transactions is the most actionable primary method. It grounds the valuation in market evidence and gives both sides a shared reference framework.
DCF is the most theoretically complete method, but only when applied with disciplined, owner-assigned assumptions across every input. Applied loosely — which is how it is applied in most early-stage situations — it produces a number that confirms whatever the builder wanted to show.
For pre-revenue or pre-PMF companies, the VC method combined with a scorecard approach (which assigns value to milestone achievements like team strength, market size, and prototype stage) is more honest than a revenue-based multiple with no revenue to apply it to.
What are the 5 valuation methods?
A structured answer to this question matters because most summaries compress the methods in ways that lose the decision context:
How much is a business worth with $500,000 in sales?
Revenue alone does not determine value. A business generating $500K in annual revenue could be worth anywhere from $1M to $5M+ depending on the answers to the following questions:
- Is the revenue recurring or transactional? Subscription revenue (ARR) trades at a premium to project or services revenue. A $500K ARR SaaS company could trade at 3–5x ARR ($1.5–2.5M), depending on growth rate and churn. For a precise breakdown of what counts in ARR and what does not, the Fiscallion guide to annual recurring revenue covers the most common definition errors that distort these calculations.
- What is the growth rate? A company growing at 80% year-over-year with $500K ARR is valued on its trajectory, not its current scale. A company flat at $500K for three years is worth substantially less.
- What are the margins? A 75%+ gross margin software business is a fundamentally different asset than a services business at 30% gross margin generating the same revenue.
- Is the owner the business? If revenue disappears without the founder, buyers price in key-person risk, which compresses multiples.
- For traditional businesses, a simple starting point is a multiple of EBITDA (typically 3–6x for small businesses) or a revenue multiple anchored to industry norms. A $500K revenue business generating $100K in EBITDA might sell for $350K–$600K. With $500K revenue and strong SaaS economics, the same business could command multiples two to three times higher.
The question "what is it worth" is always actually two questions: "what are the economics?" and "who would buy it and why?"
What is the 80/20 rule for startups?
In a valuation and business-building context, the 80/20 rule — or Pareto principle — shows up in several relevant forms:
Revenue concentration: In many scaling SaaS companies, roughly 20% of customers generate 80% of ARR. This creates a single-customer concentration risk that investors discount. A company where one customer represents 40% of ARR will receive a lower multiple than an identical business with diversified revenue, because the acquirer or investor is buying a portfolio risk they have not been paid for.
Metric-driving decisions: Roughly 20% of the FP&A decisions you make will explain 80% of the difference in your financial outcomes. For most $5–20M ARR SaaS companies, those decisions cluster around: CAC payback period discipline, headcount-to-ARR efficiency, and NRR management. Getting those three right accounts for the majority of the difference between a 4x and a 7x exit multiple.
Effort allocation in fundraising: The 80/20 rule applies to which investors you spend time with. Most founders talk to too many investors early and too few of the right ones late. Your valuation is partially set by which lead investor you close — their conviction and brand affect how other investors price the round.
What to do before you enter a valuation conversation
The most common mistake is treating valuation as a negotiation problem rather than a modeling problem. The negotiation only goes well if the model is solid first.
Here is the sequence that produces the best outcomes:
1. Define your ARR cleanly. Investors use ARR as the base. If your ARR definition mixes MRR, annual contracts, and professional services, clean that up before any conversation. The definition debate during diligence costs time and signals weak financial governance.
2. Build your own comp set. Identify 8–12 public comparables and 3–5 recent comparable transactions. Know where you sit in each distribution and why. Do not let the investor's comp set be the first one either of you has examined.
3. Run the VC method from the investor's perspective. Before your first meeting, calculate the pre-money their model likely implies given their return targets and your realistic exit scenario. Know the gap between that number and your expectation.
4. Assign an owner to every assumption. For any valuation model you present — whether a revenue multiple, a DCF, or a comparable analysis — every input must have a named owner who can defend it. Not "this is what we assume." But "this is what we observed in Q3 data, this is why we believe it continues, and this is what would have to be true for it to be wrong."
5. Prepare for a range, not a point. The honest answer to "what is your company worth" is a range. Build three scenarios: a bear case (lower multiple, higher dilution), a base case, and a bull case. Know what assumptions differentiate them. Founders who present a single number are guessing. Founders who present a range with stated assumptions are showing investors they understand the uncertainty in their own model.
6. Connect valuation to the use of proceeds. A valuation argument is strengthened when the ask is directly tied to specific milestones that move the next valuation point. "We are raising at $25M pre-money. This capital takes us from $8M to $18M ARR, which positions us for a Series C at 5–7x on a $20M ARR base." That is a narrative that makes the return math visible.
Common valuation mistakes and what to do instead
For a deeper look at how the pre-money/post-money distinction affects the equity math downstream, the pre-money vs post-money valuation breakdown covers the mechanics in full, including how SAFE note conversions interact with a subsequent priced round.
A practical valuation prep checklist
Before entering any formal valuation conversation — whether a venture round, a secondary transaction, or an M&A process — work through the following:
Data and definitions
- ARR defined and documented (MRR × 12, excluding one-time revenue, services clearly separated)
- NRR calculated by cohort for at least four quarters
- Gross margin calculated with COGS separated from S&M and R&D
- CAC payback period calculated and updated in the last 90 days
- Rule of 40 score calculated (growth rate + EBITDA margin)
Market benchmarking
- 8–12 public comps identified with current EV/ARR or EV/Revenue
- 3–5 comparable transactions identified with disclosed multiples
- Private company discount range assessed (typically 20–35%)
- Your position in the multiple distribution justified by specific metric comparisons
Scenario modeling
- Bear / base / bull case models with explicit assumptions for each
- VC method back-calculation completed from likely investor perspective
- Post-money dilution modeled across all three scenarios, including option pool refresh
- Cap table impact reviewed for any outstanding SAFEs or convertible notes before a priced round
Assumption ownership
- Named owner for each material assumption in the model
- Version control on the model with a clear record of assumption changes
- Sensitivity analysis on the two or three inputs that move the output most
Own your inputs of accept the discount
Valuation is not a number — it is a model with assumptions. The founder who knows the assumptions controls the conversation. The one who is defending a number without a model is reacting.
The five methods covered here — revenue multiples, DCF, public comps, comparable transactions, and the VC method — are not alternatives. They are complementary lenses. Use all five, triangulate the results, and make sure every input has an owner.
At the $5–50M ARR stage, the companies that achieve the highest multiples are not always the fastest-growing. They are the ones that can demonstrate the clearest link between their metrics, their capital efficiency, and their exit trajectory.
If your current valuation model for an upcoming raise is not triangulated across at least two methods, with documented assumptions and a sensitivity analysis, that is the first thing to fix. Book a working session with Fiscallion to work through it before you are across the table from an investor.
Notes
Valuation multiple data sources: SaaS Capital Index (public B2B SaaS median EV/Revenue); Aventis Advisors SaaS M&A Transaction Database (543 disclosed private M&A deals, 2015–2026). Public median of 3.4x EV/Revenue reflects March 2026 data. Historical peaks and troughs represent period-end observations.
Rule of 40 sensitivity data: Aventis Advisors, Q4 2025 analysis. Each 10-point improvement in Rule of 40 score corresponded to approximately +1.1x EV/Revenue. This figure changes with market conditions.
Private company discount: The standard 20–35% discount applied to public comps for private valuations reflects illiquidity, execution risk, and governance differences. The actual discount applied in any transaction will vary based on company quality, deal structure, and buyer type.
Disclaimer: Nothing in this article constitutes financial, legal, or investment advice. Valuation inputs and market multiples change materially over time. Consult qualified advisors before making financial decisions based on valuation estimates.
