

MRR is one of the most-reported numbers in a SaaS board deck and one of the most inconsistently calculated. Two companies can both claim "$800K MRR" while measuring completely different things — and the difference matters when you are forecasting runway, modeling a fundraise, or trying to understand whether growth is healthy or fragile.
This article builds MRR from the ground up: what it is, how to calculate it correctly, what its five components tell you, and how to read it as a decision-making signal — not just a scoreboard number.
Key takeaways
- MRR is a normalized monthly snapshot of predictable recurring contractual revenue—not cash collected, and not GAAP recognized revenue.
- The single-number MRR you report every month is the output of five distinct components, and each one points to a different management action.
- A flat or growing MRR can still mask deteriorating business health if contraction or churn is rising underneath it.
- The MRR definition you use must be documented, consistent across your board deck and forecasting model, and owned by one person—not assembled differently each month.
What we'll cover
- What monthly recurring revenue is — and what it is not
- How to calculate MRR: the formula and three methods
- The five MRR components and what each one tells you
- What "good" MRR growth looks like at your ARR stage
- How MRR connects to ARR, NRR, LTV, and CAC
- How to interpret MRR movements as decision signals
- What to do next — six actions ordered by impact
- Common MRR mistakes and replacement moves
- An MRR tracking template you can use this month
What monthly recurring revenue actually is
Monthly recurring revenue is the normalized, predictable revenue a SaaS business generates from active subscriptions in a given month. It is not cash collected. It is not GAAP revenue. It is a management metric — a forward-looking snapshot of what your subscription base is worth right now on a monthly basis.
The word "normalized" matters. If a customer pays $12,000 upfront for an annual contract, you do not record $12,000 of MRR in the month they sign. You record $1,000 per month for twelve months, regardless of when the cash arrives. This normalization is what makes MRR useful for comparisons, forecasting, and trend analysis.
As Stripe's guide to recurring revenue notes, MRR is sensitive to recent changes and reveals momentum quickly — including the impact of new sales, upgrades, cancellations, or pricing changes almost immediately. That short feedback loop is exactly what makes it a decision-grade metric rather than a reporting artifact.
What MRR excludes by definition
MRR should exclude:
- One-time fees — setup fees, onboarding charges, professional services invoices, custom implementation work
- Non-recurring payments — annual license purchases that are not subscription-based, one-time add-ons, or event-driven charges
- Usage-based revenue that does not recur predictably — if a customer's usage fluctuates month to month and has no committed minimum, the variable portion should be excluded or treated separately as a distinct revenue line
The practical rule: if revenue cannot be expected to recur in the next month under the current contract, it does not belong in MRR.
What monthly recurring income means (and why the term matters)
"Monthly recurring income" and "monthly recurring revenue" refer to the same metric. In some contexts — especially in the independent software and creator space — founders use "income" rather than "revenue." The calculation is identical.
The reason to care about the distinction: in SaaS finance, revenue and income are not interchangeable. Revenue is the top-line figure before costs. Income typically refers to profit or net earnings. When your board deck uses "recurring income," clarify whether the speaker means revenue or net profit, because the analysis required is completely different.
For the purposes of FP&A, forecasting, and investor conversations, use MRR to mean monthly recurring revenue — the top-line subscription metric, before any cost deduction.
How to calculate monthly recurring revenue
There are three approaches to calculating MRR, and the right one depends on your billing structure.
Method 1: customer-level summation (most accurate)
This is the recommended approach. Pull a list of every active paying customer, identify their monthly recurring payment for the current period, and sum the values.
MRR = Sum of monthly recurring payment for each active customer
For a customer on a monthly plan at $500/month, their MRR contribution is $500.
For a customer on an annual plan at $12,000/year, their MRR contribution is $12,000 / 12 = $1,000.
For a customer on a quarterly plan at $3,000/quarter, their MRR contribution is $3,000 / 3 = $1,000.
For a customer with a $500/month base plan and a $200/month add-on, both of which recur, their MRR contribution is $700.
The key discipline: discount treatment. If a customer received a negotiated 20% lifetime discount and pays $800/month instead of the list price of $1,000/month, their MRR contribution is $800 — what they actually pay, not the list price. Counting list price inflates MRR and gives you a misleading base for forecasting.
Method 2: ARPU-based (acceptable for quick estimates)
MRR = Number of active customers × Average revenue per user (ARPU) per month
If you have 200 customers paying an average of $400/month, your MRR is $80,000.
This method is fast but loses precision as your pricing mix diversifies. Once you have multiple plans, heavy discounting, or large variance in customer size, customer-level summation is more reliable.
Method 3: plan-level summation (useful for structured pricing tiers)
MRR = (Customers on Plan A × Plan A price) + (Customers on Plan B × Plan B price) + ...
This approach works well when customers sit cleanly inside defined plan tiers and add-ons are minimal. It breaks down when you have many custom contracts or negotiated exceptions.
A worked example
You run a B2B SaaS product with the following customer base at the end of May:
Total MRR: $3,750
Note what is excluded: if Customer B also paid a $500 setup fee when they first signed, that $500 does not enter MRR at any point.
The five MRR components — and what each one tells you
A single MRR number tells you where you are. The five components tell you how you got there and what is likely to happen next. You cannot run a useful finance review on MRR as a lump sum.
Your net new MRR for any month is:
Net new MRR = New MRR + Expansion MRR + Reactivation MRR - Contraction MRR - Churned MRR
Each component represents a different business dynamic. Conflating them loses the signal.
For example: a month where total MRR is flat might mean your business is healthy and in equilibrium, or it might mean new MRR of $80K is exactly offsetting $80K in combined churn and contraction — a sign of a deteriorating base that will soon compress total MRR as churn continues and new business slows. You cannot tell from the headline number.
Of the five components, expansion MRR tends to be the most underused as a decision tool. For a deeper breakdown of how to calculate it, benchmark it, and act on it, the expansion MRR: definition, formula, benchmarks, and what to do with it guide covers the pricing-to-expansion connection in detail.
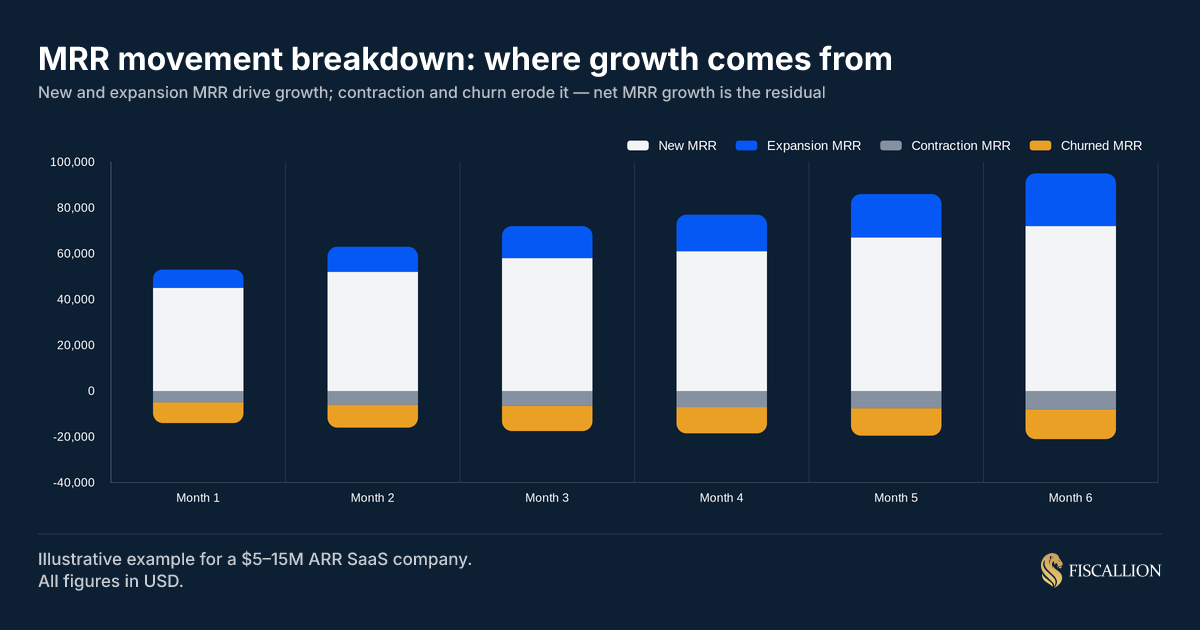
The chart above shows an illustrative MRR bridge for a $5–15M ARR company over six months. New MRR and expansion drive the stack upward; contraction and churn pull it down. The net monthly MRR growth is the residual. When you present this in a board deck, each bar's sub-components should be visible — not collapsed into a single growth line.
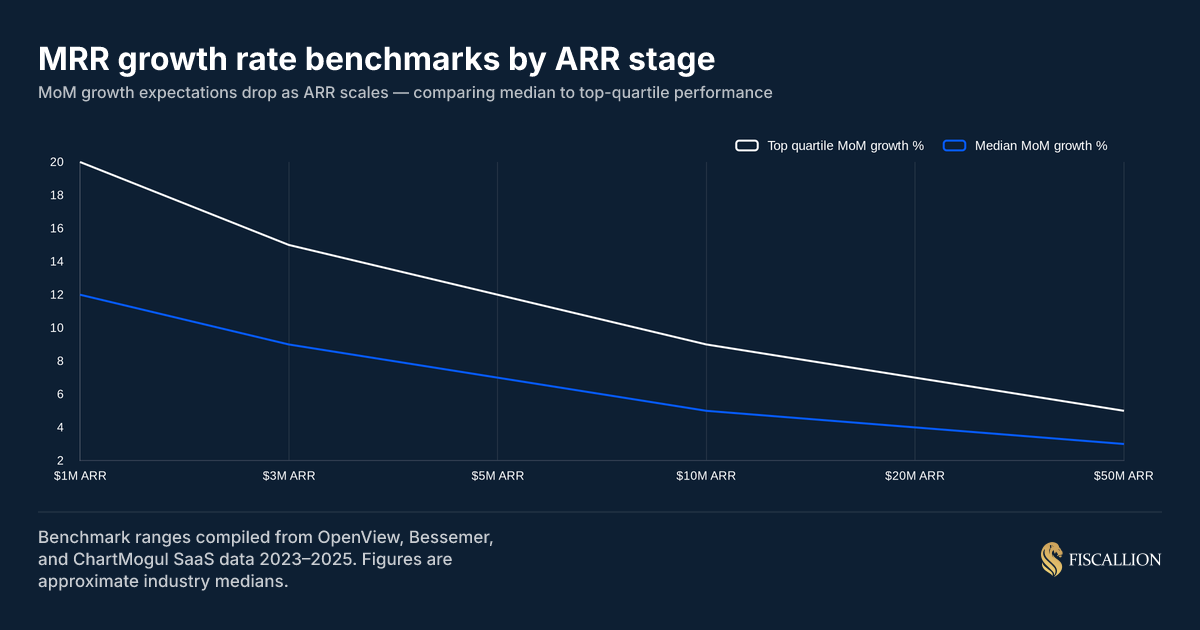
What is a good MRR growth rate at your ARR stage
MRR growth rate benchmarks are stage-dependent. A 20% month-over-month growth rate is achievable and expected at $500K ARR. At $20M ARR, the same rate is rare and not sustainable without an exceptionally strong GTM engine.
The benchmark that matters is not your absolute growth rate in isolation — it is your growth rate relative to companies at your ARR stage with a similar GTM motion. According to SaaS Capital's 2025 benchmarking survey of more than 1,000 private B2B SaaS companies, the overall median ARR growth rate registered 25% — down from 30% in 2023. Critically, top-quartile performance means different things at different stages: a $2M ARR company needs to be growing more than 50% year-over-year to be in the top 25% of its peers, while for a $20M ARR company that bar drops to 31%.
A few points on interpreting these ranges:
- Top-quartile performance requires a reason. If your growth rate sits in the top quartile, identify what is driving it. Sustainable top-quartile growth is usually a signal of product-led growth, strong expansion MRR, or a well-defined ICP with short sales cycles. Acquisition-driven spikes tend to revert.
- Median is not a floor. For a $10M ARR company funded on growth assumptions, median growth may still trigger covenant concerns or investor conversations about capital efficiency. Know your benchmark target before the board asks.
- Usage-based pricing distorts raw MRR growth. If your MRR fluctuates with customer usage, your growth rate will be noisier. Smooth it with a trailing 3-month average before benchmarking.
- Retention is the multiplier. The same SaaS Capital data shows that companies with the highest NRR report median growth that is 83% higher than the population median — making retention improvement one of the highest-leverage moves available at any ARR stage.
As a company scales past the $10M threshold, growth naturally slows down as early customer acquisition channels begin to saturate. At this stage, plugging a leaky retention bucket yields far greater financial leverage than blindly forcing capital into increasingly inefficient acquisition pipelines.
How MRR connects to ARR, NRR, LTV, and CAC
MRR does not exist in isolation. Its value as a management metric comes from the downstream calculations it enables.
MRR and ARR
Annual recurring revenue (ARR) is the annualized equivalent of MRR:
ARR = MRR × 12
This is a projection, not a cash flow forecast. It tells you the run-rate value of your current subscription base if nothing changes. The important caveat — things always change, which is why you need MRR component breakdowns to understand the direction of that change.
For a deeper look at how ARR is defined and where teams make definition errors, the Fiscallion guide to annual recurring revenue covers the most common inconsistencies across board decks and investor packages.
MRR and NRR
Net revenue retention (NRR) uses MRR component data to answer a specific question: are existing customers paying you more or less over time?
NRR = (Beginning MRR + Expansion MRR - Contraction MRR - Churned MRR) / Beginning MRR × 100
NRR above 100% means your existing customer base is generating more revenue at the end of a period than it was at the start — without counting new customers. That condition requires expansion MRR to exceed the combined drag of contraction and churn.
NRR is the efficiency metric that turns MRR analysis from a scoreboard into a forward signal. A company with $2M MRR and 115% NRR has a very different growth trajectory than one with $2M MRR and 88% NRR, even if their growth rate was identical last quarter. The data bears this out: SaaS Capital's research shows that moving NRR from the 90–100% range into the 100–110% range alone improves median growth rate by 5 percentage points.
MRR and customer lifetime value (LTV)
LTV is the projected total revenue you can expect from an average customer over their full relationship with you. The most common formula:
LTV = ARPU (monthly) / Monthly churn rate
Or expressed in MRR terms:
LTV = (MRR / Number of customers) / Monthly churn rate
The caveat: a single LTV number is not useful for decisions. You need it by cohort, by segment, and as a range — not as a company-wide average. An average LTV that blends enterprise accounts at $150K with SMB accounts at $8K tells you nothing actionable about either segment. Andreessen Horowitz's 16 Startup Metrics makes the same point directly: LTV calculated as a blended average obscures the segment-level signal that actually drives decisions.
MRR and CAC payback period
CAC payback period is one of the clearest capital efficiency metrics in SaaS:
CAC payback (months) = CAC / (ARPU × Gross margin %)
A payback period of 18 months means it takes 18 months of subscription revenue to recover the cost of acquiring one customer. At 30% annual churn, a meaningful portion of customers will leave before they pay back their acquisition cost.
For a $10M ARR company, understanding whether MRR growth is being driven by new customer acquisition or by expansion from existing customers is the difference between a healthy CAC payback trend and a deteriorating one. Expansion MRR generates revenue at approximately $0.69 per dollar acquired versus $1.50–$3.00 for new-logo MRR. That ratio directly influences whether your burn rate is sustainable at your current growth rate.
For context on how the SaaS magic number ties sales and marketing spend to MRR growth, the Fiscallion analysis of the SaaS magic number covers the formula and its correct interpretation.
Examples of monthly recurring revenue in practice
These examples are designed to show how MRR moves in real operating contexts — not just in a static formula.
Example 1: a $3M ARR company analyzing a flat MRR month
A B2B workflow automation company with 180 customers has MRR of $250,000 entering June. At the end of June, MRR is still $250,000.
The CFO reports "flat MRR month." What actually happened:
- New MRR: $28,000 (18 new customers at roughly $1,555 ARPU)
- Expansion MRR: $9,000 (4 existing customers upgraded or added seats)
- Reactivation MRR: $2,000 (1 previously churned customer reactivated)
- Contraction MRR: -$8,000 (3 customers downgraded)
- Churned MRR: -$31,000 (12 customers cancelled)
Net: $28,000 + $9,000 + $2,000 - $8,000 - $31,000 = $0
The business looks flat. But it churned $31,000 of MRR in a single month — 12.4% of its base. If that churn rate continues, the company will need to add 150+ new customers per year just to stay flat. That is a retention crisis, not a growth rate problem.
The right response is not to accelerate acquisition spend. It is to stop the churn.
Example 2: a $12M ARR company preparing for a Series B
A vertical SaaS company is modeling its Series B story. Their trailing 3-month average MRR growth is 6% month-over-month, which puts them comfortably in the top quartile for their ARR stage.
When they break MRR into components, the picture changes:
- New MRR as a share of net new MRR: 78%
- Expansion MRR share: 12%
- Net churn drag: 10%
At $12M ARR, the benchmark expansion mix is 25–30% of total new ARR. They are at 12%. Their growth story is almost entirely dependent on new customer acquisition, which is expensive and increasingly competitive in their segment.
An investor who looks past the headline MRR growth rate will ask why expansion is low. The answer in this case is pricing architecture — the company is on a single-tier flat-rate model with no seat-based or usage-based variables. The fix is a pricing change, not a hiring change.
The Fiscallion framework for expansion MRR covers this pricing-to-expansion connection in detail.
Example 3: annual contracts and MRR recognition
A company signs a $60,000 annual contract in January, payable upfront. The customer is new — they had no prior relationship.
- MRR contribution in January: $60,000 / 12 = $5,000 (new MRR)
- MRR contribution in February through December: $5,000/month (no additional action required in the MRR model — this customer is simply counted in the active base)
In month 9 of the contract, the customer upgrades to a tier that costs $90,000/year. The incremental MRR from the upgrade date is ($90,000 - $60,000) / 12 = $2,500. That $2,500 is expansion MRR, recognized from the upgrade month forward. The original $5,000 base MRR does not change.
This is where many teams make errors: they recognize the full annual contract value as a single spike in MRR rather than amortizing it. The result is a distorted month and a quiet base for the remaining eleven months.
How to interpret MRR movements as decision signals
Each shift in the MRR stack points to a different intervention. The table below maps movements to the most likely underlying cause and the decision it requires.
The most dangerous MRR pattern for a $5–50M ARR company is the last one: flat total MRR driven by high new MRR offsetting high churn. It looks stable. It is not. If acquisition slows — as it does in downturns, after an ICP shift, or when a competitor enters the market — the hidden churn drag becomes visible immediately.
What to do next: six actions ordered by impact
These actions are ordered by the frequency with which they address the actual underlying problem, not by theoretical priority.
1. Write down your MRR definition today (Finance owner)
This sounds basic. It is not. Your MRR definition should explicitly state:
- Whether discounts are reflected at the discounted rate or list price
- How annual contracts are normalized
- Whether professional services revenue is excluded and how partial-service contracts are treated
- How usage-based or variable revenue components are handled
- What reactivation treatment you apply (new MRR vs. reactivation MRR)
The definition should be the same in your board deck, your investor updates, your internal forecasting model, and your billing system export. If those four sources produce different MRR numbers, your definition is not documented — it is implicit, and whoever does the calculation next month will make a different set of choices.
2. Build the five-component bridge, not just the headline number (Finance owner)
Every monthly finance review should show MRR as a bridge: starting MRR + new MRR + expansion MRR + reactivation MRR - contraction MRR - churned MRR = ending MRR.
If you can only see the headline, you are flying with one instrument. The bridge identifies where growth is coming from, where it is leaking, and which component needs attention.
3. Assign ownership of each component to a team function (CEO)
- New MRR: Sales
- Expansion MRR: Customer Success
- Contraction MRR: Customer Success and Product
- Churned MRR: Customer Success and Product
- Reactivation MRR: Marketing or Sales
When an MRR component moves, there should be a named person who is responsible for explaining why and proposing a response. "MRR is down" without an owner is not a finance problem. It is a leadership structure problem.
4. Run MRR by cohort, not just by calendar month (Finance owner)
Cohort-level MRR analysis answers questions that aggregate MRR cannot: are newer customers churning faster than older ones? Are customers acquired in Q4 expanding less than those acquired in Q2? Are there cohorts that are structurally unprofitable based on their MRR trajectory relative to acquisition cost?
If your MRR model does not have cohort rows, add them. This is not optional at the $5–50M ARR stage.
5. Connect MRR to your runway model (Finance owner)
MRR alone does not tell you how long your cash lasts. But MRR growth rate plus gross margin plus burn rate together determine your runway. The most common mistake is treating MRR as a revenue metric rather than a cash flow input.
The model should show: if MRR growth holds at current rates, when do we hit profitability or need to raise? If MRR growth drops to half the current rate, how does runway change?
6. Set benchmark targets and review them quarterly (CEO or Finance owner)
Use the ARR stage benchmarks above to set explicit MRR growth targets, NRR targets, and expansion mix ratios for the next four quarters. Targets that are more than 10 percentage points above your cohort median require a structural explanation — new pricing, a new product surface, or a different ICP. Label that gap explicitly rather than treating the target as a growth aspiration.
Common MRR mistakes and the replacement moves
These are the errors most frequently seen in the $5–50M ARR range. Each one is correctable in a single finance sprint if the problem is named clearly.
Mistake: counting cash collected as MRR
A customer pays $24,000 upfront for a two-year contract. The finance team books $24,000 as MRR in month one.
This inflates MRR in the booking month and understates it in all subsequent months. When investors normalize the number, your MRR trend looks weaker than reported. It also distorts any ratio that uses MRR as the base — NRR, LTV, CAC payback.
Replacement move: Normalize all multi-period payments. Use the monthly equivalent for every subscription, regardless of when cash arrived.
Mistake: including professional services revenue in MRR
Implementation fees, custom development work, and one-time onboarding charges are services revenue — not recurring subscription revenue. Including them makes MRR look larger and more stable than it is, and creates a comparison problem when services revenue fluctuates quarter to quarter.
Replacement move: Track services revenue as a separate line. Report it alongside MRR but never inside it. In investor materials, disclose both numbers clearly.
Mistake: reporting MRR without the component bridge
Reporting "$450K MRR, up 4% from last month" is a historical data point. It does not tell the board whether to be confident or concerned. The 4% growth could be driven by $85K in new customer MRR offsetting $67K in churn — which is a fragile growth profile — or it could be driven by $30K in new MRR and $32K in expansion with minimal churn — which is a healthy one.
Replacement move: Present MRR as a five-component bridge in every board deck and monthly finance review. The headline number is the last line, not the first.
Relying strictly on a single headline metric frequently masks underlying rot in the customer base, as strong top-of-funnel acquisition can temporarily cover up a severe churn problem. Breaking the figure down into a multi-component view is the only way for leadership to isolate structural revenue decay and accurately direct operational focus.
Mistake: not owning MRR inputs explicitly
When no one owns the inputs, the calculation changes each month based on who runs it. This creates inconsistencies between reporting periods, makes trend analysis unreliable, and produces different MRR numbers in the board deck versus the investor update versus the internal dashboard.
Replacement move: Assign a single person to own the MRR definition and calculation. Document the methodology. Review it once per quarter or whenever the billing model changes.
Mistake: using MRR growth rate alone to benchmark performance
A 7% month-over-month MRR growth rate sounds strong. Whether it is strong depends entirely on your ARR stage, NRR, expansion mix, and churn drag. A company at $3M ARR growing at 7% MoM with 80% gross retention is in a different position than one at $3M ARR growing at 7% MoM with 95% gross retention and 110% NRR.
Replacement move: Never benchmark MRR growth rate in isolation. Pair it with gross retention rate, expansion MRR share, and NRR. Those three together tell the growth quality story that MRR rate alone cannot.
MRR tracking template
Use this checklist to structure your monthly MRR review. The tool does not matter — this runs in a spreadsheet or inside a proper FP&A model. The discipline is in the cadence and the ownership, not the software.
MRR MONTHLY REVIEW
Period: [Month / Year]
Owner: [Finance / FP&A] 1. INPUTS (per billing system export, normalized for multi-period contracts)
- Beginning MRR (all active customers): $________
- New MRR (first-time customers, this month only): $________
- Expansion MRR (existing customers, MRR increases only): $________
- Reactivation MRR (returning churned customers): $________
- Contraction MRR (existing customers, MRR decreases): $________
- Churned MRR (full cancellations): $________ 2. CALCULATED OUTPUTS
- Net new MRR: New + Expansion + Reactivation - Contraction - Churned = $________
- Ending MRR: Beginning + Net new MRR = $________
- MoM growth rate: (Ending MRR - Beginning MRR) / Beginning MRR × 100 = ____%
- ARR (run rate): Ending MRR × 12 = $________
- NRR (trailing 12 months): ____%
- GRR (trailing 12 months): ____% 3. COMPONENT RATIOS
- New MRR as % of net new MRR: ____%
- Expansion MRR as % of beginning MRR: ____%
- Churned MRR as % of beginning MRR (monthly churn rate): ____%
- Net expansion MRR (expansion minus contraction): $________ 4. COHORT FLAGS
- Fastest-churning cohort by vintage: [Quarter]
- Highest-expanding cohort by vintage: [Quarter]
- Segments with contraction MRR above 5% of segment MRR: [List] 5. DECISIONS DUE THIS MONTH
- Pricing review triggered? Y / N
- Churn intervention needed in specific segment? Y / N (Segment: ___)
- Expansion target on track? Y / N
- MRR definition change required? Y / N
- Model needs update for next board deck? Y / N
Run this review every month. Assign each flag a due date and an owner before the meeting ends. An MRR review that produces data without decisions is a reporting exercise, not an FP&A function.
Frequently asked questions
How do you calculate monthly recurring revenue?
Calculate MRR by summing the monthly equivalent of every active subscription. For monthly plans, use the monthly amount. For annual or multi-year plans, divide the total contract value by the number of months it covers and use the result. Exclude setup fees, one-time charges, and non-recurring payments. Apply actual customer pricing — including discounts — not list prices. The formula is: MRR = sum of (monthly recurring payment for each active subscriber).
What is recurring monthly revenue?
Recurring monthly revenue is the predictable subscription revenue a business generates each month from active customers under current contract terms. It is normalized — meaning multi-period contracts are amortized into monthly equivalents — and it excludes any revenue that does not automatically recur in the next billing period. For practical purposes, it is the same metric as monthly recurring revenue (MRR).
What is an example of monthly recurring revenue?
A company with 50 customers on a $200/month plan, 30 customers on a $500/month plan, and 10 customers on a $1,200/year annual plan has MRR of: (50 × $200) + (30 × $500) + (10 × $100) = $10,000 + $15,000 + $1,000 = $26,000. The annual plan customers contribute $100/month each ($1,200 / 12), not $1,200, because MRR normalizes all payments to their monthly equivalent.
What is monthly recurring income?
Monthly recurring income is another term for monthly recurring revenue, most commonly used by independent software founders, bootstrapped SaaS businesses, and subscription creators. The calculation is identical to MRR. In formal SaaS finance and investor reporting, "revenue" is the standard term — using "income" in a board deck can cause confusion because income also means net profit in accounting. For FP&A purposes, treat monthly recurring income and monthly recurring revenue as the same metric.
Conclusion
MRR is not complex to define. It is consistently misused.
The failure mode at the $5–50M ARR stage is not that companies forget to track MRR — it is that they track it as a single number rather than as a five-component bridge. A single headline number cannot tell you whether growth is healthy or fragile, whether to accelerate acquisition or fix retention, or whether your business is on track or quietly building a churn problem.
The decisions MRR should drive — pricing architecture, customer success investment, ICP refinement, acquisition spend — only become accessible once you break the metric into its parts, assign ownership to each one, and connect it to your runway model rather than leaving it as a board deck score.
The analysis is straightforward. The discipline is in doing it every month, in the same way, with a named owner who explains the movements — not just reports them.
If your MRR definition is not written down or if your monthly review collapses five components into one number, that is the starting point. Audit both this month before the next board conversation.
