
Most SaaS companies track their magic number. Very few know what to do when it moves.
The number sits in a board deck, gets nodded at, and then gets bypassed for the more emotionally charged conversation about pipeline and hiring. That is the wrong sequence. The magic number is a spending permission signal - it tells you whether your go-to-market engine earns the next dollar of investment. Getting that decision wrong in either direction costs real runway.
This article gives you the definition, the correct formula, the benchmarks that actually matter by stage, and the five decisions the magic number should be driving in your next planning cycle.
Key takeaways
- The SaaS magic number measures how many dollars of annualized new ARR you generate for every dollar spent on sales and marketing in the prior period.
- A score above 0.75 is the general threshold for healthy GTM efficiency. Above 1.0 is a clear signal to increase S&M investment. Below 0.5 means you fix the engine before adding fuel.
- The number alone is incomplete. Pair it with gross margin, NRR, and CAC payback period to understand what is actually driving the score - and which levers to pull.
What we'll cover
- What the SaaS magic number actually measures
- The formula and the input-level decisions that shape it
- How to interpret your score - by stage, ACV, and market motion
- The gross-margin-adjusted version and when to use it
- What actions each score band should trigger
- Common mistakes and how to avoid them
- The 3-3-2-2-2 rule and Rule of 40 - how they connect
- FAQ: frequently debated questions answered directly
What the SaaS magic number actually measures
The SaaS magic number is a sales efficiency ratio. It answers one question: for every dollar you spent on sales and marketing last quarter, how much annualized new recurring revenue did you produce this quarter?
It was originally framed by Josh James (Omniture, Domo) and later formalized across the SaaS investing community as a fast-read for whether a company's go-to-market motion is self-reinforcing or leaking. IVP, one of the leading later-stage B2B VC funds, published benchmark data showing the average magic number at $15M ARR is 1.2 — with top-quartile companies hitting 2.1 or higher.
The decision it enables: should you increase S&M spend, hold it flat, or pull it back and fix the underlying engine first?
Most board conversations treat this as a revenue question. It is actually a capital allocation question. The magic number is the ratio that tells you whether spending more will compound or just burn.
Why the magic number is not a simple CAC metric
CAC and the magic number measure related but different things.
CAC measures the cost to acquire a single customer. The magic number measures the aggregate efficiency of your entire S&M engine — including the effect of churn, expansion, and contraction on net revenue growth.
A company with strong new logo CAC can still have a poor magic number if churn is eroding the net revenue gain. That is the part most teams miss: the magic number is a net metric. It reflects your full GTM picture, not just your acquisition motion. For a deeper breakdown of how CAC payback period interacts with churn and cash recovery timing, the mechanics are worth understanding before you interpret any magic number reading.
The formula and the inputs that matter
Standard formula
SaaS Magic Number = (Current Quarter ARR - Prior Quarter ARR) × 4 ÷ Prior Quarter Sales & Marketing Expense
The annualization factor (×4) converts quarterly revenue growth into an annualized figure so the output is comparable across periods and companies.
You use prior quarter S&M spend - not current quarter - because there is typically a lag between when you invest in pipeline and when that investment converts to recognized revenue.
What to use for revenue
Use recurring revenue only: ARR or MRR. Do not include professional services, one-time implementation fees, or usage-based revenue that does not recur predictably.
If you blend in services revenue, your magic number will appear stronger than it is. Investors will spot this. The board conversation will be worse, not better, when the real number surfaces.
What to include in S&M spend
Include all of: sales headcount compensation (base + variable), marketing headcount, paid acquisition, tools, conferences, and contractor spend in both functions.
Do not include customer success in the denominator unless your CS team carries quota for expansions. If you separate out CS costs, document that assumption and hold it consistently across periods.
Alternative formulas
The gross-margin-adjusted version is worth calculating alongside the standard formula. If your gross margin is below 70%, the unadjusted magic number overstates efficiency because it does not account for the cost of delivering the revenue you just acquired. You can find a detailed treatment of gross margin benchmarks and what belongs in COGS in Fiscallion's SaaS gross margin benchmark guide.
Worked example
At 1.11, the signal is clear: this GTM engine is producing more than $1 of annualized ARR for every $1 spent. The right decision is to model what happens to runway and growth rate if S&M spend increases by 20-30% next quarter - not to pull back.
How to interpret your score
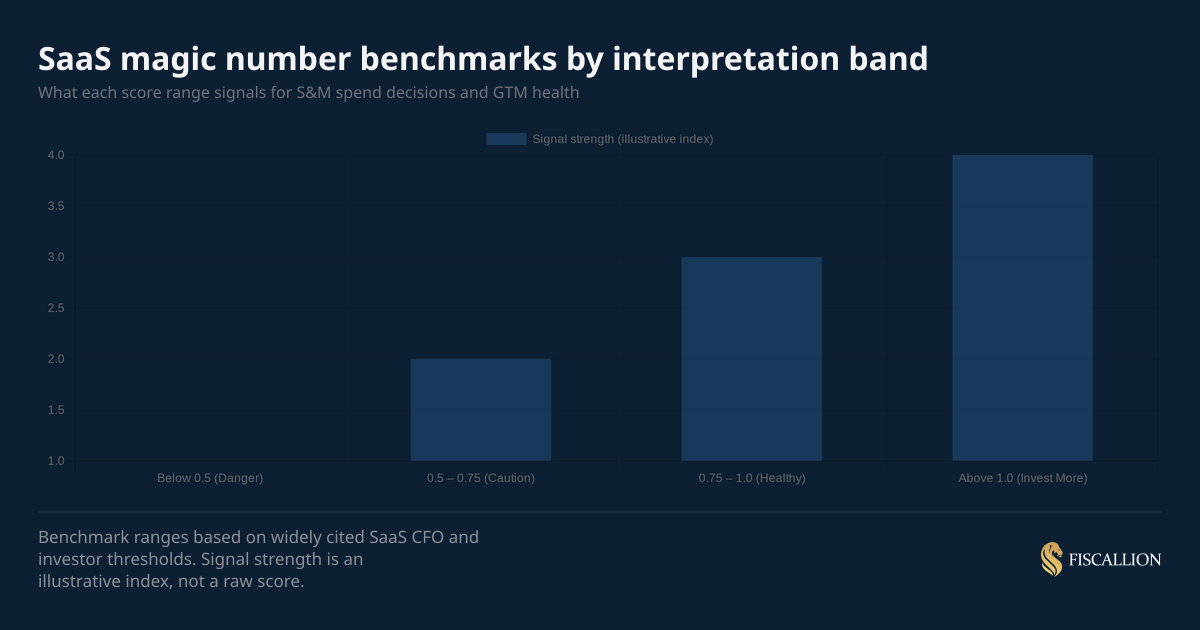
The four decision bands
Stage context matters
The thresholds above are directionally correct but need stage adjustment.
At Series A ($5-15M ARR), a magic number of 0.6-0.75 is often acceptable if the company is still refining ICP and building the repeatable sales motion. The question is trajectory, not just the current score.
At Series B ($15-40M ARR), the threshold tightens. Investors expect the magic number to be trending toward or above 0.75 consistently, with at least two to three quarters of data. Volatility is a problem here - it suggests the S&M engine is not systematized.
At Series C and beyond, a sustained number above 1.0 is table stakes for a strong raise. Anything below 0.75 in the twelve months preceding a raise will generate investor questions about unit economics and capital efficiency that your deck needs to address directly.
ACV shapes the applicable threshold
High ACV, enterprise-led businesses ($50K+ deals) will naturally have more volatile magic numbers quarter to quarter because deal timing dominates. For these companies, use a trailing four-quarter average rather than a single quarter. As SaaStr notes, low magic numbers in the enterprise can be acceptable if you are funded — but low magic numbers with SMB ACV can be fatal, because the payback math simply does not work at small deal sizes.
Lower ACV, high-velocity businesses ($5K-15K) should show more consistency. A single quarter's deviation is more meaningful here because it is less likely to be timing noise and more likely to signal a real funnel problem.
The gross-margin-adjusted magic number — and why it often tells a different story
The standard magic number treats all ARR as equal. It does not account for the cost of delivering that revenue. This creates a distortion for companies with significant services revenue, professional services blended into ARR, or lower gross margins.
The adjusted formula:
Gross-Margin-Adjusted Magic Number = (Q ARR change × Gross Margin %) × 4 ÷ Prior Q S&M Spend
If your standard magic number is 0.85 but your gross margin is 62%, your adjusted number drops to approximately 0.53 — which is a fundamentally different signal. You are not in the healthy band. You are in the fix-it band.
This matters most during fundraising. Investors running diligence on your unit economics will calculate the adjusted version. If you only present the standard version and the discrepancy surfaces in diligence, it becomes a trust and credibility issue rather than a math issue. The KeyBanc Capital Markets and Sapphire Ventures 2024 Private SaaS Company Survey confirmed that median gross margin for public SaaS businesses runs around 72-78%, with top-quartile companies above 80% - the gap between your gross margin and that benchmark is what makes or breaks the adjusted magic number.
The SaaS unit economics guide at Fiscallion covers the full relationship between gross margin, LTV, and CAC payback - and why gross margin is the metric that modifies every other unit economics figure.
A case from a Fiscallion engagement: a Series B process where the company's headline magic number was 1.1. The investor's diligence team recalculated using the gross-margin-adjusted version and arrived at 0.78. Gross margin had compressed from 76% to 71% over the trailing four quarters because the company was signing larger deals with more implementation services attached. The standard formula captured the deal volume; the adjusted version captured the margin compression too.
The investor flagged it directly: the headline number said efficient, the adjusted number said gross profit per dollar of S&M was declining. The gap didn't kill the deal, but it affected terms — valuation came in roughly 15% below the founder's anchor.
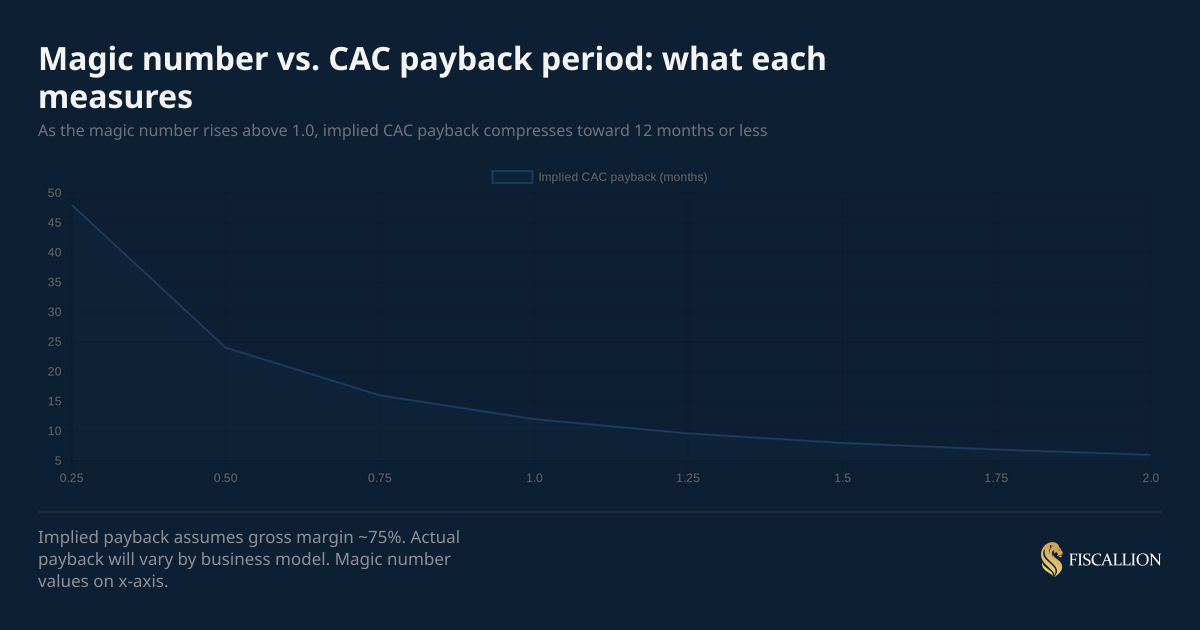
Magic number vs. CAC payback period
These two metrics are related but answer different questions.
Use both. The magic number gives you a portfolio-level read on S&M productivity. CAC payback gives you the customer-level recovery timeline. When they disagree - when your magic number looks healthy but payback is over 24 months — it almost always means gross margin is low or churn is pulling down net ARR growth. McKinsey's analysis of 100+ public SaaS companies found that top-quartile SaaS companies recover CAC in a median of 16 months, while bottom-quartile players take nearly four years — a difference that compounds directly into your magic number reading.
What to do with your score: actions by band
When your score is below 0.5
- Stop scaling S&M (owner: CEO/board) - Do not hire more AEs or increase paid acquisition until you understand why existing spend is not converting.
- Run a cohort-level churn analysis (owner: Head of CS or Finance) - Identify whether the problem is new logo performance or retention erosion. These require different fixes. A SaaS cohort analysis is the right starting point - it separates which customer vintages are healthy from which are deteriorating.
- Audit ICP alignment (owner: Head of Sales) - Segment the last 12 months of closes by vertical, ACV, and company size. Find where win rates and NRR are both strong. That is your real ICP, not the one in your deck.
- Recalculate with gross-margin-adjusted formula (owner: Finance) - Confirm whether the underlying economics are viable before adjusting the go-to-market.
When your score is 0.5-0.75
- Hold spend flat and improve conversion rate — A 20% improvement in demo-to-close rate has a larger impact on the magic number than a 20% increase in marketing budget at this stage.
- Segment the magic number by channel and ACV — Blended numbers hide where efficiency is leaking. Paid acquisition may have a magic number of 0.3 while outbound has 0.9. The decision to cut or hold depends on the segment, not the average.
- Model the impact of a 5% churn reduction — At this band, churn drag on net ARR growth is often the primary culprit. Reducing monthly churn from 2.5% to 2.0% adds more to the numerator than most S&M budget increases. Net revenue retention benchmarks for private B2B SaaS show that even a 5-point NRR improvement meaningfully shifts the net ARR growth that feeds your magic number.
When your score is above 1.0
- Model a 20-30% S&M increase and calculate the runway impact — The question is not whether to invest; it is how much runway the additional spend consumes and whether that is the right trade-off versus cash conservation. Your startup runway calculation should run a scenario that explicitly models this before you commit.
- Test the capacity ceiling — A magic number above 1.0 can reflect a constrained sales team that is operating at high efficiency because headcount is the bottleneck. If that is the case, add AE capacity first before increasing marketing spend.
- Track the trend, not just the point — A magic number that has dropped from 1.4 to 1.1 to 0.9 over three quarters is a deteriorating signal even if the current quarter looks healthy. The trajectory is more important than a single reading.
A high magic number sometimes flatters a constraint rather than confirming an efficiency.
A case from a Fiscallion engagement: a company at $11M ARR with a magic number of 1.4 — exceptional by any standard. The founder was using it as evidence the business was efficient and that they should raise on that strength. Underneath, the picture was different. Two AEs, both at full capacity, pipeline coverage at 6x forward quota — unhealthily high. The sales motion was so under-resourced that every dollar of spend was generating disproportionate revenue, but only because demand was pooling in the pipeline waiting for capacity to close it.
I advised increasing S&M investment — two AEs and a sales engineer — and to expect the magic number to drop as they invested ahead of the productivity curve. Over the next two quarters, it dropped to 0.9 as the new hires ramped, then rebounded to 1.1 as they hit partial productivity. Absolute new ARR was running at 1.6x the prior baseline.
Common mistakes — and what to do instead
Mistake 1: Calculating the magic number on total revenue instead of recurring revenue
If you include professional services in the numerator, the metric will overstate efficiency. Professional services revenue has fundamentally different economics — lower gross margin, non-recurring, and not driven by your S&M motion.
Replacement move: Use ARR or MRR only. If your revenue reporting does not cleanly separate recurring from non-recurring, fix the P&L structure before calculating any unit economics metric.
Mistake 2: Reporting a single blended magic number to the board
One number blends together your high-performing and low-performing go-to-market motions. An enterprise motion and a self-serve motion in the same company will have very different magic numbers. Presenting a blended average conceals which one to invest in.
Replacement move: Segment by channel (inbound, outbound, partner), by ACV band, and by market segment. Present the segmented view alongside the blended number. The board conversation becomes about trade-offs, not just scores. OpenView' SaaS metrics and benchmarks framework makes the same point: blended efficiency metrics are useful for benchmarking but misleading as the sole input for go-to-market investment decisions.
Mistake 3: Treating the magic number as a standalone metric
A magic number of 0.8 means very different things at 85% gross margin versus 55% gross margin. It means different things at 110% NRR versus 88% NRR.
Replacement move: Always pair the magic number with gross margin and NRR in the same reporting period. These three metrics together give you a complete picture of GTM health. The LTV:CAC ratio for SaaS is also worth surfacing alongside this cluster to understand the long-term return profile per customer.
Mistake 4: Using it as a quarterly verdict instead of a trend signal
One bad quarter can reflect timing in a long-cycle enterprise deal. One good quarter can mask deteriorating fundamentals if a large deal pulled in from a prior period.
Replacement move: Track the trailing four-quarter average alongside the current quarter. Flag deviations that exceed 20% from the trailing average as worth investigating, not just reporting.
Mistake 5: Ignoring what a high magic number at low ARR actually means
A magic number of 1.4 at $3M ARR often means your GTM is working at a small scale that does not yet test repeatability. The signal is valid but not generalizable to a larger investment decision.
Replacement move: When presenting a high magic number to investors pre-Series B, add a segment-level breakdown and a cohort view of retention. The question investors are asking is whether the efficiency is repeatable at higher volume - not just whether it exists today.
How the magic number connects to Rule of 40 and the 3-3-2-2-2 rule
The Rule of 40 connection
The Rule of 40 adds revenue growth rate (%) to EBITDA margin (%) and asks for a combined score of 40 or above. It is a company-level health check. The magic number is a function-level efficiency metric. They measure different things, but they are related.
A company with a strong magic number (above 1.0) that is deploying capital efficiently into S&M should, over time, show improving growth rate - which feeds directly into the Rule of 40 score. The magic number is one of the leading indicators that determines whether the growth side of the Rule of 40 equation is sustainable or burning cash to sustain.
McKinsey's research on the Rule of 40 — covering analysis of more than 200 software companies between 2011 and 2021 - found that barely one-third of software companies achieve the Rule of 40, and fewer still manage to sustain it. Businesses exceeded Rule of 40 performance only 16% of the time. Yet top-quartile SaaS companies generate nearly three times the EV/revenue multiples of those in the bottom quartile. What the research also makes clear: companies with poor sales efficiency (low magic numbers) rarely sustain Rule of 40 compliance without gross margin support - because they are buying growth at a rate that exceeds what the business model can structurally support. You can go deeper on the full Rule of 40 framework in Fiscallion's guide to the Rule of 40 in SaaS.
What is the 3-3-2-2-2 rule of SaaS?
The 3-3-2-2-2 rule (also known as T2D3 — Triple Triple Double Double Double) is a growth trajectory benchmark, not an efficiency benchmark. It describes a growth path that successful venture-backed SaaS companies have followed: triple ARR in year one, triple again in year two, then double for three consecutive years.
Starting from ~$2M ARR, this trajectory looks like:
The 3-3-2-2-2 rule was popularized by Neeraj Agrawal at Battery Ventures and modeled on the trajectories of companies like Salesforce and Zendesk.
Where it connects to the magic number: the 3-3-2-2-2 trajectory requires sustained S&M investment at scale. Companies that hit those growth targets while maintaining a magic number above 0.75 are building a healthy, self-reinforcing GTM engine. Companies chasing the same growth targets with a magic number below 0.5 are buying revenue at a rate that will compress runway before the trajectory compounds.
The 3-3-2-2-2 rule answers "how fast should we grow?" The magic number answers "are we growing efficiently?" You need both.
Frequently asked questions
What is a good magic number for SaaS?
There is no single "good" number that applies to every stage and business model. The directional benchmarks are:
- Below 0.5: The GTM engine has a structural problem. Additional S&M investment will compound the problem, not fix it.
- 0.5 - 0.75: Below the efficiency threshold. Hold spend flat, investigate the funnel, and identify whether the drag is in new acquisition or net revenue retention.
- 0.75 - 1.0: The standard healthy range. GTM is working. Continue investing while tracking for deterioration.
- Above 1.0: Strong signal. Each dollar in S&M is generating more than a dollar of annualized ARR. The right decision is to model an increase in investment and evaluate the runway impact.
For context: IVP's benchmark data shows the average magic number at $15M ARR is 1.2, with the top 25% of companies hitting 2.1 or higher. By $200M+ ARR, the average drops to around 0.8 as market saturation sets in and growth becomes harder to drive — which is still acceptable at that scale given the lower growth expectations and the power of high NRR.
At the $5-15M ARR stage, a score between 0.6 and 0.8 is typical and acceptable if the trend is improving. What matters more than the absolute number at that stage is whether the efficiency is consistent or volatile across quarters.
What is the Rule of 40 in McKinsey SaaS analysis?
The Rule of 40 is the principle that a healthy SaaS company's revenue growth rate plus profit margin should equal or exceed 40. It was popularized by Brad Feld at Foundry Group and validated at scale by McKinsey's research on software company shareholder returns.
McKinsey's analysis of 200+ software companies found that companies exceed Rule of 40 performance only 16% of the time. Fewer still manage to sustain it. The research covered companies between 2011 and 2021 and found that top-quartile SaaS companies generate nearly three times the EV/revenue multiples of those in the bottom quartile.
The key insight from McKinsey's work: at early growth stages, companies can run at a significant EBITDA deficit if their growth rate compensates (e.g., 60% growth + (-20%) margin = 40). As companies mature toward $50M+ ARR, investors expect the margin component to expand while growth moderates. A company at $30M ARR growing at 40% but running at -30% EBITDA margin scores 10 on the Rule of 40 - and that signals a capital efficiency problem that more revenue alone will not fix.
What is a SaaS magic number vs. other efficiency metrics?
The SaaS magic number is a specific S&M efficiency ratio. It is not a generic term for software quality or product virality. It sits within a family of sales efficiency metrics — here is how they compare:
The magic number is best used as a planning and investment-cadence metric — reviewed quarterly, tracked as a trend, and segmented by channel. It is not a substitute for the cohort-level analysis that CAC payback and LTV:CAC provide. Use this cluster together, not in isolation.
Magic number dashboard: what to track and who owns it
Use this as the reporting structure for your next board or operating review.
The last row is the most commonly missing input. If you cannot reconcile your ARR change into new, expansion, contraction, and churn components, you cannot diagnose what is actually moving your magic number. Expansion MRR is the component that most teams track last and understand least — yet it is what separates a magic number driven by genuine acquisition efficiency from one that is being propped up by upsell from existing customers. That split is not optional — it is the prerequisite for using the metric to make decisions.
If your FP&A model does not already produce this split automatically, that is the first thing to fix. Most companies at $5-20M ARR are still running this in manual spreadsheets with no single source of truth - which means the magic number you present to the board has implicit assumptions baked in that nobody owns. The SaaS financial model template guide walks through how to structure this split inside a model that produces it automatically, ahead of the board meeting rather than during it.
Three things to do this quarter
The magic number is one of the cleaner signals in SaaS finance - but only if you use it as a decision input rather than a reporting artifact.
The calculation is straightforward. The interpretation depends on your stage, ACV profile, and gross margin. The action it should trigger — invest more, hold flat, or fix the engine first - is one of the most capital-consequential decisions in a growth-stage company's annual plan.
Three things to do this quarter:
- Calculate your magic number using recurring revenue only, with prior-quarter S&M in the denominator. Then calculate the gross-margin-adjusted version. If they diverge materially, that gap is the conversation.
- Segment it by channel and ACV band. The blended number hides where the efficiency is and where it is not.
- Pair it with NRR and CAC payback in the same reporting view. A magic number without those two context metrics is a number without a decision attached to it.
If your FP&A model does not automatically produce these outputs on a quarterly cadence, that is the infrastructure gap — not the metric knowledge gap. Audit your metrics definitions and forecasting model to get there.
