

If you're a founder or head of finance, expansion MRR is probably already showing up in your monthly metrics review. The problem is that most teams track it without knowing what it should tell them or what to do when it moves.
This article covers the full picture: what expansion MRR is, how monthly recurring revenue (MRR) breaks down, how to calculate the metric accurately, how it connects to net revenue retention (NRR), what good looks like at your stage, and the five decisions it should be driving in your business.
Key takeaways
- Expansion MRR measures revenue growth from existing customers - upsells, cross-sells, seat additions, and usage increases. It is not the same as total MRR growth.
- Your expansion-to-new-logo ratio is a function of company stage, not just go-to-market effort. At $5M-$15M ARR, the benchmark is 25-30% expansion. At $15M-$50M ARR, it rises to 36-40%.
- NRR above 100% requires expansion to outpace churn and contraction - but NRR alone can hide a deteriorating gross retention problem. Always read them together.
- Expansion MRR is 2-3x more capital-efficient than new-logo ARR, but it is not free. It has its own acquisition cost and requires the right pricing architecture to produce it.
What is MRR? Breaking down the full term first
MRR stands for monthly recurring revenue. It is the normalized, predictable revenue a SaaS business generates from active subscriptions each month.
The "recurring" part is critical. One-time fees, professional services revenue, and setup charges are excluded. MRR captures only what you can expect to collect month over month from your current customer base under their current contract terms.
MRR has four main components, and understanding all four is necessary before expansion MRR makes sense as a metric:
Your net new MRR each month equals: New MRR + Expansion MRR - Contraction MRR - Churned MRR.
When expansion MRR exceeds contraction MRR and churned MRR combined, your existing base is generating positive net contribution to growth without a single new customer signing. That condition - sometimes called net negative churn - is one of the clearest signals of product value in a SaaS model.
What expansion MRR actually is
Expansion MRR is the additional recurring revenue generated from existing customers in a given month, above what they were paying the previous month.
It is created through three primary mechanisms:
- Upsells - a customer moves from a lower-tier plan to a higher-tier plan (e.g., from $800/month to $1,400/month; the $600 delta is expansion MRR)
- Cross-sells - a customer adds a complementary product or module that increases their total monthly spend
- Seat or usage expansion - a customer adds users, API calls, data volume, or any other usage-based variable that your pricing scales with
What it does not include: standard renewals at the same price, reactivations in some definitions (treatment varies by company), or one-time services. The test is simple - did this existing customer's monthly recurring payment go up from last month?
Why expansion MRR matters more than your dashboard probably shows
At $10M ARR, assuming a 30% annual churn rate (not unusual for SMB-heavy products), you need to add roughly $3M in new ARR just to stay flat. If expansion MRR covers $1M of that, your new-logo sales team's burden drops by a third.
The capital efficiency difference is significant: generating $1 of expansion ARR costs approximately $0.69 in sales and marketing spend, compared to $1.50-$3.00 for $1 of new-logo ARR. That ratio matters when you are managing runway against a headcount plan.
How to calculate expansion MRR
The calculation is straightforward, but the inputs require discipline.
Formula:
Expansion MRR (Month) = Sum of all MRR increases from existing customers during the month
That means: for every customer who was active in the prior month and is still active in the current month, identify any increase in their recurring monthly payment. Sum those increases. That total is your expansion MRR.
Step-by-step:
- Pull a list of all customers active at the start of the month with their MRR values
- At the end of the month, pull the same customers' current MRR values
- For each customer where current MRR > prior MRR, the difference is an expansion event
- Sum all positive differences
- Exclude customers who are new this month (they belong in new MRR, not expansion MRR)
Expansion MRR rate (month-over-month growth):
Expansion MRR Rate = (Expansion MRR this month / Total MRR at start of month) × 100
If your total MRR at the start of June was $500,000 and your expansion MRR during June was $25,000, your expansion MRR rate is 5% for the month.
Common calculation pitfalls
- Mixing new customers into expansion: If a customer signed this month, their full MRR is new MRR. Only count them in expansion from next month forward.
- Treating annual contracts as monthly expansion: If a customer upgrades mid-year on an annual contract, recognize the MRR delta from the upgrade date, not as a lump sum.
- Ignoring contraction when reporting expansion: Reporting expansion MRR in isolation without netting contraction creates an optimistic but misleading picture. Track net expansion MRR (expansion minus contraction) alongside gross expansion.
- Double-counting reactivations: Set a clear policy on whether returning customers count as expansion or new MRR, and apply it consistently.
How expansion MRR connects to net revenue retention
Net revenue retention (NRR) - also called net dollar retention (NDR) - is the metric that formalizes the relationship between expansion, contraction, and churn into a single number that tells you whether your existing customer base is growing or shrinking in revenue terms.
NRR formula:
NRR = (Beginning MRR + Expansion MRR - Contraction MRR - Churned MRR) / Beginning MRR × 100
An NRR above 100% means your existing customers are paying you more at the end of a period than they were at the start - even accounting for all losses. Expansion MRR is the only variable in this formula that pushes NRR above 100%.
SaaS Capital defines NRR using a trailing 12-month cohort view: MRR from December of the current year for customers who were active in December of the prior year, divided by that prior-year MRR. The method is worth standardizing on — it produces a comparable number you can benchmark externally.
What is the net revenue expansion rate?
The net revenue expansion rate is another name for the NRR calculation above, specifically framed from the expansion perspective. Some FP&A teams use it to describe the net contribution of expansion activity after subtracting revenue lost from the same cohort.
The framing you use matters less than consistent application. What matters is that you are measuring the same starting cohort at the beginning and end of the period, excluding any new customers who joined during that period, and applying the same treatment to contraction and churn definitions every month.
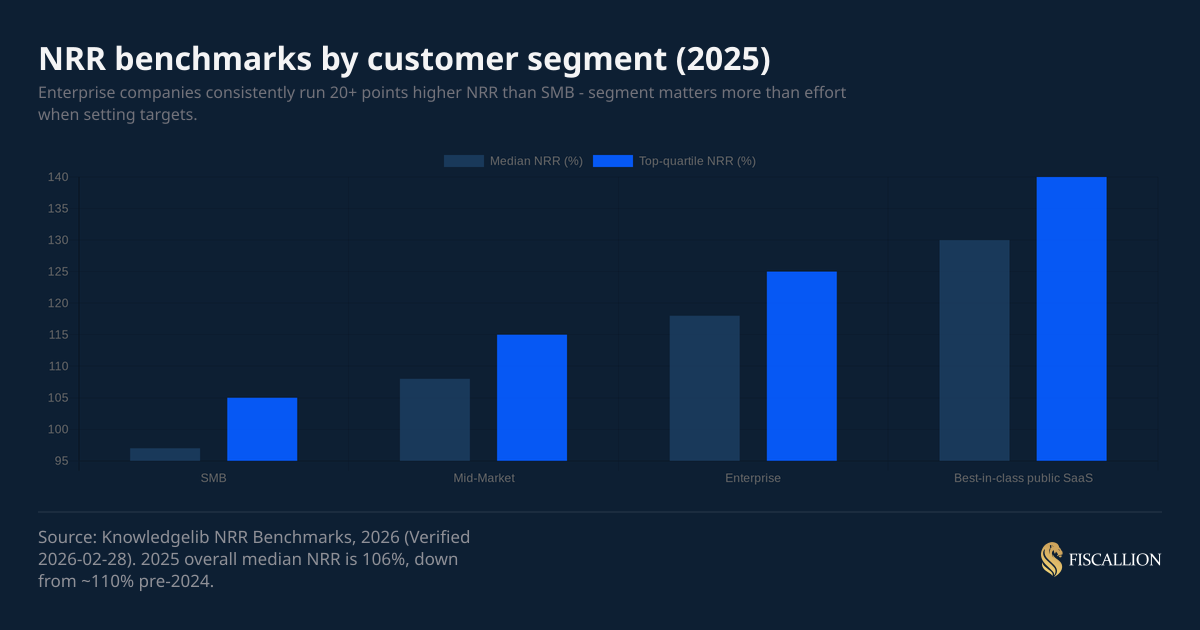
NRR benchmarks by segment (2025 data)
SaaS Capital's 2025 annual survey of private B2B companies found that NRR benchmarks are most meaningfully segmented by ACV, not by company size or industry. Higher ACV products — which typically involve longer sales cycles, deeper implementation, and dedicated account management — show structurally higher NRR. ChartMogul's retention research across 2,500+ SaaS businesses confirms the same pattern from a different angle: companies with higher average revenue per account (ARPA) are the ones most consistently reaching or exceeding 100% NRR.
Key constraint: do not benchmark against the wrong segment. If your ACV is $3,000 and most of your customers are small businesses, targeting 115% NRR is not ambitious - it is structurally unrealistic. SMB median NRR is 97%, and that is acceptable if your gross retention stays above 85% and new-logo acquisition volume compensates.
What expansion means in a SaaS marketing and growth context
In SaaS marketing, "expansion" refers to the motion of growing revenue within an existing customer relationship, as opposed to acquiring a new customer. It is the "expand" phase of the land-and-expand model.
Expansion revenue can be planned and influenced through several deliberate moves:
- Pricing architecture: usage-based and tiered pricing models create natural expansion paths. OpenView's usage-based pricing research shows that companies with consumption or seat-based models consistently outperform flat-rate peers on NRR, because price naturally scales with customer value delivered. Flat-rate single-seat pricing structurally caps expansion potential at around 105-110% NRR.
- Customer success motion: CSMs who understand customer workflow and growth patterns are better positioned to time expansion conversations than sales reps working from CRM alerts.
- Product packaging: modular add-ons and feature tiers that address advanced use cases create expansion opportunities for customers who have matured beyond the baseline plan.
In the Fiscallion framework, expansion is not a marketing or sales concept - it is a capital allocation signal. If your expansion rate is rising, your incremental dollar of CS investment is generating more return than it was 90 days ago. If expansion is flat while new-logo growth is accelerating, you are becoming more dependent on acquisition - a riskier growth profile heading into a fundraise.
Expansion ARR mix benchmarks by company stage
One of the most common mistakes in the $5M-$50M ARR range is applying a single expansion target across the entire business without accounting for where you are in the growth curve.
Expansion ARR as a share of total new ARR scales materially with company size. ChartMogul's research found that by 2024, companies with $15M-30M+ ARR were deriving roughly 40% of their revenue growth from expansion — up from 30% at the 2021 growth peak. That shift reflects both a more competitive new-logo environment and the compounding value of installed base investment over time.
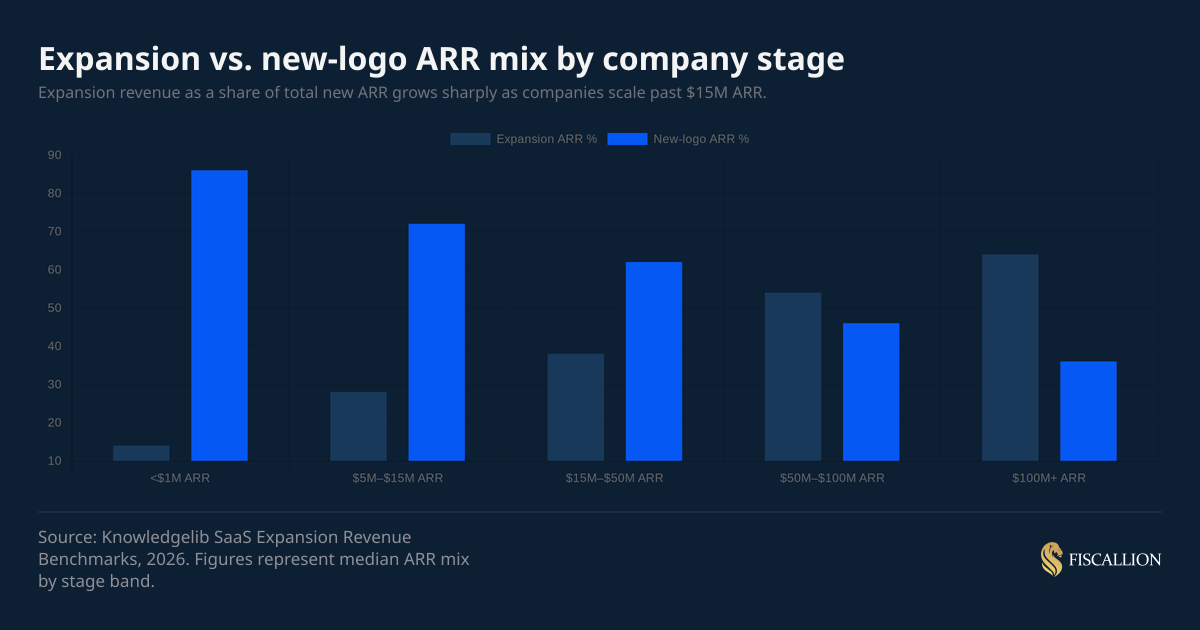
The practical implication: if you are at $12M ARR and your expansion mix is 15%, you are behind the cohort median. Either your pricing model does not support expansion, your customer success function is not running an expansion motion, or your existing customers are not growing enough to need more of your product.
Each of those is a different problem requiring a different response - and tracking expansion MRR is what tells you the problem exists in the first place.
Gross retention is the floor, not an afterthought
Before you invest heavily in expansion motions, check your gross revenue retention (GRR). GRR measures what percentage of your beginning-of-period revenue you retained after removing churned and contracted customers - before adding any expansion.
SaaS Capital's benchmark data shows median GRR across private B2B SaaS ranges between 87% and 93% depending on ACV band, with higher-ACV companies showing higher gross retention. Top quartile is above 95%.
The warning: a company showing 115% NRR with 78% GRR is expanding aggressively but losing a fifth of its revenue base every year. When expansion slows (market pressure, pricing fatigue, matured accounts), the underlying churn will surface fast. If your GRR is below 85%, fix retention before investing in expansion programs.
One engagement put a number on this: A company reporting 112% NRR had been using that number in board conversations as evidence of strong product-market fit. When we broke it down, gross revenue retention was 84%. The 112% NRR was being driven almost entirely by expansion from the top 15% of customers, who were expanding aggressively enough to more than offset revenue lost to churn. The segment breaking was their SMB cohort — churning at roughly three times the rate of their mid-market customers. The expansion was coming almost entirely from mid-market and above. The recommendation was to fix gross retention first: pause the expansion playbook for one quarter and deploy CS capacity toward SMB triage — identifying customers most likely to churn in the next 90 days and intervening proactively. GRR improved from 84% to 91% over two quarters. NRR dipped to 104% during that period, but the base was materially healthier at the end of it.
How to interpret expansion MRR movements
Expansion MRR is not just a growth metric. How it moves relative to other MRR components tells you something specific about your business.
The last row matters more than most teams realize. A single enterprise upsell can inflate expansion MRR for one or two months and make the metric look healthy across the board. Always break expansion down by cohort, segment, and account size before drawing conclusions.
One more pattern worth watching: ChartMogul's data shows that new customers tend to expand most aggressively in their first year of tenure as they ramp usage and complete onboarding. Churn risk typically increases in year two. When new business slows and those first-year cohorts age out, NRR naturally deteriorates even without any product or pricing change. That dynamic is worth modeling explicitly rather than discovering it in a quarterly board review.
What to do next: five actions ordered by impact
These are ordered by the frequency with which they address the actual underlying problem, not by theoretical priority.
1. Audit your expansion MRR definition (Finance owner)
Before anything else, confirm that your team is calculating expansion MRR consistently. Check: are new customers being excluded correctly? Are annual contract upgrades being amortized into monthly periods? Is contraction being tracked separately or folded into churn? If three people on your team calculate expansion MRR and get three different numbers, the definition is broken.
2. Decompose NRR into GRR plus expansion rate (Finance owner)
Run NRR and GRR side by side for the trailing 12 months. If NRR is above 100% but GRR has been declining quarter over quarter, expansion is covering a retention problem - not solving it. Document the GRR trend and bring it to your next leadership review with a hypothesis about which segments or cohorts are driving the decline.
3. Map your pricing model against your expansion ceiling (CEO or Head of Product)
If you are on flat-rate, single-tier pricing, your NRR is structurally limited to around 105%. To push past that, you need either tiered pricing, seat-based pricing, usage-based variables, or a new product surface. That is a product and pricing decision, not a CS motion decision. Identify your structural ceiling before setting expansion NRR targets.
One Fiscallion engagement illustrates the ceiling clearly. A company at $8M ARR was on single-tier flat-rate pricing — one product, one price, one seat count at contract signing. NRR was 98%. They were retaining customers but generating almost no expansion revenue, and any churn at all was shrinking the base. The pricing change: a three-tier seat-based model with a usage-driven trigger for the middle tier, plus a usage-based API module existing customers could activate independently. Existing customers were grandfathered at their current tier for 12 months. At six months post-launch, NRR was 109%. At 12 months, 114%. Expansion MRR that had been effectively zero was contributing roughly $85K monthly. The single biggest driver was the API module — not the tier upgrade.
4. Assign expansion ownership explicitly (CEO or VP Customer Success)
Expansion MRR without an owner is a lagging indicator. Assign a specific owner - typically customer success - with a defined expansion MRR target and a 90-day operating plan. If CS compensation is not tied to expansion in any form, it will remain secondary to renewal protection and support resolution.
5. Set stage-appropriate expansion targets and review quarterly (FP&A or Finance owner)
Use the ARR band benchmarks above to set a target expansion mix ratio and an NRR target for the next four quarters. Targets more than ten percentage points above your cohort median require structural changes - new pricing, new product surfaces, or a different customer segment. Flag that explicitly rather than treating the target as motivational.
Common mistakes and the replacement moves
Most expansion MRR problems at the $5M-$50M ARR stage are not execution problems. They are definition, structure, or incentive problems.
Mistake: Reporting expansion MRR without reporting contraction MRR
Expansion MRR looks encouraging in isolation. Without contraction MRR alongside it, you cannot tell whether expansion is genuinely additive or simply offsetting a downgrade trend.
Replacement move: Report net expansion MRR (expansion minus contraction) as the primary metric in your monthly finance review. Show gross expansion as a supporting line.
Mistake: Targeting enterprise-level NRR with an SMB customer base
If your ACV is $5,000 and 80% of your customer base is SMB, targeting 120% NRR is misaligned with your customer segment's structural budget capacity and churn rate. This leads to over-investing in CS expansion motions that cannot produce the targeted return.
Replacement move: Benchmark within your segment. For SMB-heavy products, target 95-105% NRR and invest first in improving GRR from, say, 84% to 90% before pursuing aggressive expansion.
Mistake: Treating expansion MRR as a CS team metric only
Expansion capacity is determined by pricing architecture, product breadth, and customer use case maturity. CS can execute expansion conversations, but cannot generate expansion in a flat-rate, single-product environment.
Replacement move: Evaluate your expansion ceiling from first principles: does your pricing model allow customers to pay you more without a full contract renegotiation? If not, expansion is a product problem before it is a CS problem.
Mistake: Comparing your NRR to public company benchmarks
Public company NRR benchmarks (frequently cited as 110-120%) reflect survivorship bias. Only the most successful SaaS companies reach public markets. SaaS Capital's annual survey of private B2B SaaS companies consistently shows median NRR in the 100-108% range depending on ACV, well below the public-market figures most founders cite. Using public benchmarks to set internal targets leads to unrealistic expectations and, sometimes, to aggressive initial discounting to create artificial upsell room later.
Replacement move: Use private SaaS benchmark sources (SaaS Capital annual survey, ChartMogul SaaS benchmarks) to set your comparison baseline. Segment by ACV and ARR band before drawing conclusions.
Expansion MRR tracking checklist
Most expansion MRR problems are definition or ownership problems, not execution problems. This checklist works whether you are running it in a spreadsheet or inside a proper FP&A model. The discipline is in the ownership and the monthly cadence - not in the tool.
Expansion MRR tells you where growth is actually coming from
Expansion MRR is not a vanity metric. It is the clearest signal of whether your existing customers believe your product is delivering enough value to warrant paying you more.
At $5M-$15M ARR, expansion should represent 25-30% of your new ARR. At $15M-$50M ARR, that rises to 36-40%. If you are materially below those ranges, the problem is one of three things: your pricing model does not allow for expansion, your customers are not growing fast enough to need more, or your CS function does not have an expansion motion running.
Each is a different decision. Expansion MRR tells you that one of them needs making.
Track it monthly, decompose it by segment and cohort, and pair it with GRR so expansion cannot hide a churn problem. Then assign it an owner who has targets, not just visibility.
At Fiscallion, the teams we work with that have the clearest expansion MRR picture are also the ones with the clearest board narratives - because they know whether revenue growth is coming from product value or from acquisition dependency. That distinction matters to investors, and it should matter to you.
Get the expansion MRR tracking template and run your first clean calculation this month.
