

Every investor pitch deck I've reviewed with a gross margin problem follows the same pattern. The founder presents strong ARR growth, solid NRR, impressive logo counts - and then the gross margin line appears. Suddenly the energy in the room shifts. Questions multiply. The conversation stops being about vision and starts being about operational health.
Gross margin is not just a number. It is the clearest signal of whether your SaaS business is actually building something scalable or quietly piling up costs that will suffocate you at scale. And yet, the number of early-stage founders who cannot immediately tell me their gross margin - or who are calculating it incorrectly - is high enough to be alarming.
This guide covers what the SaaS gross margin benchmark actually looks like at each stage of growth, what goes into the calculation (and what should never be in it), where companies quietly leak margin, and what to do when yours is below where it needs to be.
Key takeaways
- The widely cited target range for SaaS gross margin is 70-85%, with best-in-class businesses reaching 85%+ at scale.
- Investors do not apply a single benchmark. They apply stage-adjusted expectations: a Seed company at 60% is in a different conversation than a Series B company at 60%.
- COGS classification errors are among the most common due-diligence red flags. Leaving out hosting costs or misclassifying customer success can make your margin look artificially healthy - or artificially compressed.
- Gross margin is a valuation multiplier. SaaS companies with 85%+ margins receive materially higher ARR multiples than those below 70%.
- If your gross margin is below target, the fix is almost never revenue-side. It lives in your COGS structure, pricing floor, and delivery model efficiency.
- Gross margin matters most at fundraising, M&A, and board reporting - three moments where a fuzzy number does real damage.
What gross margin actually measures in a SaaS business
The formula is straightforward:
Gross Margin (%) = (Revenue - Cost of Goods Sold) / Revenue × 100
But the formula being simple does not mean the inputs are. For a SaaS business, revenue means your subscription, usage-based, or recurring service revenue. COGS means the direct cost of delivering that service to customers who already exist.
The critical distinction is this: COGS captures what it costs to keep delivering the product to paying customers. It does not include what it costs to acquire new ones. That distinction lives in sales, marketing, and R&D - operating expenses that sit below the gross margin line.
Why does this matter? Because a founder who accidentally loads sales team costs into COGS will show a compressed gross margin that makes the business look less scalable than it is. A founder who leaves out hosting or customer success costs entirely will show an inflated gross margin that collapses the moment an investor or auditor checks the line items.
Both scenarios are problems. One creates a valuation haircut you didn't earn. The other creates a due-diligence event you didn't plan for.
Gross margin vs. gross profit
Gross profit is the absolute dollar figure: Revenue minus COGS. Gross margin is the percentage expression of that relationship. When working with investors and in board reporting, you'll typically present both. The dollar figure matters for understanding absolute contribution to operating expenses. The percentage matters for benchmarking and valuation conversations.
At $5M ARR with 75% gross margin, your gross profit is $3.75M - the pool from which you fund R&D, sales, marketing, and G&A. At 60% gross margin, that same $5M ARR leaves you with $3M. That $750K difference compounds dramatically as you scale.
What belongs in SaaS COGS (and what doesn't)
Before we look at benchmarks, I want to address the single most common reason founders arrive at the wrong gross margin number: COGS classification.
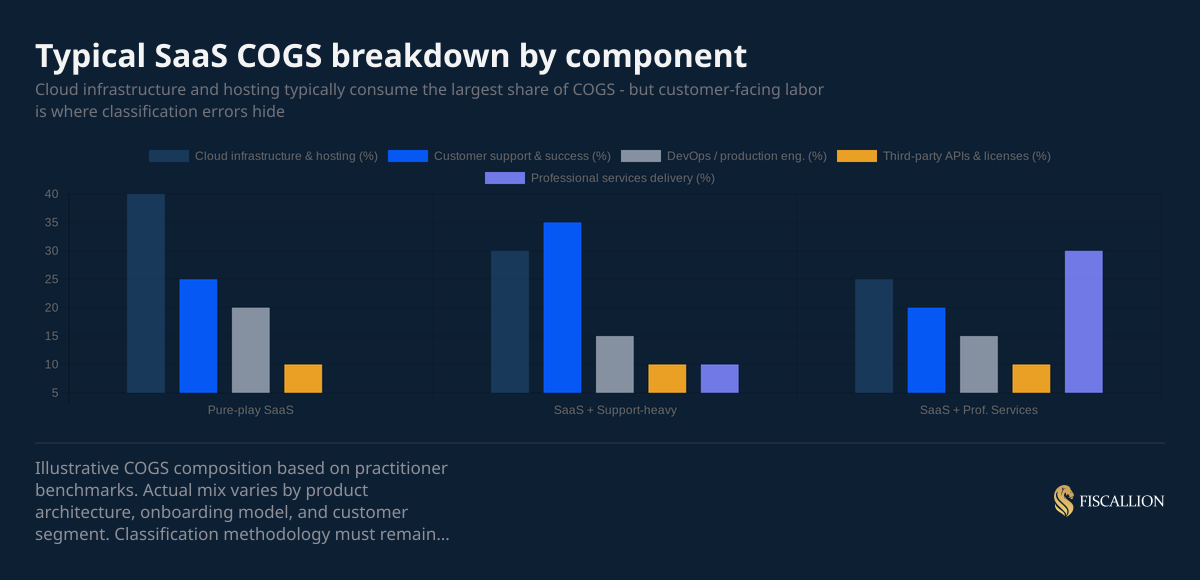
What should be in COGS
Cloud infrastructure and hosting. This is almost always the largest line item. AWS, GCP, Azure compute costs, storage, bandwidth, CDN costs, and database infrastructure all belong here when tied directly to your production environment. Not your dev environment. Not staging. Production delivery.
Third-party APIs and software licenses embedded in delivery. If you use a mapping API, a payments processor, an identity provider, or a data enrichment service as part of your product's core function, those costs belong in COGS.
Customer support directly tied to service delivery. Tier 1 and Tier 2 support teams responding to product issues are a cost of delivering the service. Their salaries, benefits, and overhead belong in COGS - on a fully burdened basis, which includes payroll taxes, benefits, and a proportional share of tools and facilities. If you're not calculating on a burdened basis, you're understating your true delivery cost.
Onboarding and implementation. If your product requires professional onboarding, implementation, or training that is part of what the customer purchased, this is a COGS line. This is where many SaaS companies undercharge and unknowingly compress margin - a problem I've written about in depth when analyzing fully burdened labor rate and pricing floors.
DevOps and production engineering. Engineers maintaining uptime, SLA compliance, and infrastructure reliability are a delivery cost. Engineers building new features are R&D.
Customer success - the nuanced one. The CS function straddles two categories. CS work focused on adoption, retention, and enablement is a COGS expense. CS work focused on upsells, renewals, and expansion is a sales expense. Early-stage companies often split CS salaries based on time allocation. You need a documented methodology and you need to apply it consistently. As SaaStr has noted, the standard SaaS playbook genuinely breaks down when your gross margin is below 75% - which is exactly why getting CS classification right matters so much.
At one B2B SaaS company around $14M ARR heading into a Series B process, the entire customer success function — four people, roughly $420K fully burdened — was sitting in operating expenses under "customer experience."
The reasoning was that CS was a retention function, not a delivery function. When we audited the COGS structure, two of those four were doing onboarding and implementation work explicitly scoped in customer contracts. Reclassifying just those two roles dropped gross margin from 74% to 69%. The lead investor had independently arrived at 68%.
The founder walked into the first partner meeting with a five-point gap between their number and the investor's number, and spent the first thirty minutes of a ninety-minute meeting explaining the discrepancy instead of talking about growth.
What should never be in COGS
- Sales commissions, SDR salaries, and AE compensation
- Marketing spend and campaign budgets
- R&D work for new features or product roadmap
- G&A: legal, HR, finance team, rent, insurance
- CEO and executive team salaries
Putting any of these in COGS understates your operating expenses, overstates your gross margin, and creates a reconciliation problem the moment an investor starts cross-referencing your P&L against your headcount plan.
The SaaS gross margin benchmark by stage
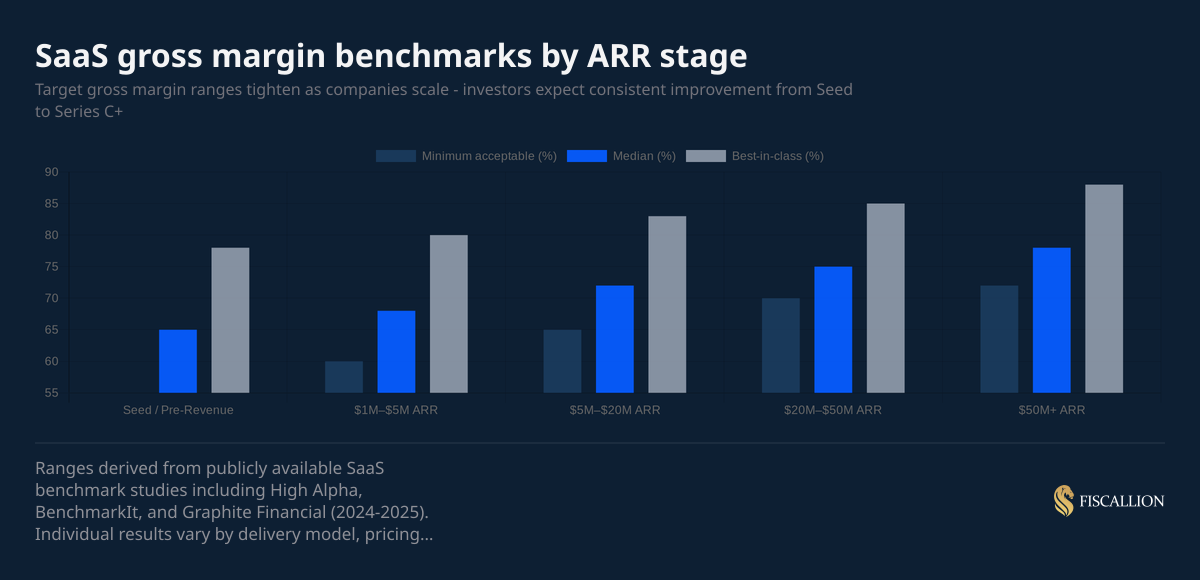
There is no single answer to "what is a good gross margin for a SaaS business." The honest answer is: it depends on your stage, your delivery model, and what you're being compared to. Here is how I think about it across the ARR spectrum.
Seed and pre-revenue
At the earliest stages, gross margin is often a theoretical exercise - you may not yet have enough customer volume to have stabilized your COGS. A gross margin in the 60-70% range is generally acceptable at this stage, especially if the COGS composition includes disproportionate early infrastructure spend that will scale with volume.
What matters most at Seed is that you understand your unit economics trajectory. Investors are not expecting 80% margins from a company with $200K ARR. They are expecting a founder who can explain the COGS structure, identify the levers that will improve it, and show that margin improves with scale.
$1M-$5M ARR (early growth, typically Series A)
By the time you're raising a Series A or have already raised one, investors expect gross margin to be in the 65-75% range at minimum. The best-in-class companies in this cohort are at 78-82%.
This is the stage where COGS classification discipline starts to matter most. You're growing fast enough that miscategorized expenses begin compounding, and investor scrutiny begins in earnest. If you're running a high-touch implementation model, make sure you are pricing it at a minimum of 2.0-2.5x your fully burdened delivery cost - otherwise you are subsidizing customer onboarding out of your gross margin.
$5M-$20M ARR (growth stage, Series A/B)
The target band tightens to 70-80%, with investors expecting margin to be improving - not just within range. This is the phase where cloud infrastructure costs should be coming down as a percentage of revenue through architectural optimization, reserved capacity pricing, and improved utilization.
A gross margin that was 68% at $3M ARR and is still 68% at $12M ARR is a signal that something is structurally wrong - either the delivery model hasn't scaled, or COGS is growing proportionally with revenue (which means the business isn't gaining operating leverage from its software infrastructure, which is exactly the value proposition of SaaS).
$20M-$50M ARR (late growth, Series B/C)
At this stage, investors expect 75-85% gross margin. Companies with best-in-class operations and efficient cloud architectures are at 85%+. The professional services component, if any, becomes a key conversation: investors will want to see subscription gross margin reported separately from professional services gross margin, because blending the two obscures the economics of the core product.
$50M+ ARR (pre-IPO and public company comparables)
Public SaaS companies provide the clearest benchmarks. The KeyBanc Capital Markets and Sapphire Ventures 2024 Private SaaS Company Survey - the 15th annual report, covering 100+ private SaaS companies - confirms that the current environment rewards operational efficiency and margin discipline over top-line growth at any cost. Median gross margin for public SaaS businesses runs around 72-78%, with top-quartile companies above 80%. Companies with best-in-class architectures, minimal services revenue, and disciplined COGS governance routinely achieve 83-88%.
If you're preparing for an IPO or late-stage M&A, gross margin will be one of the first metrics a banker or strategic acquirer benchmarks against public comps. Being 10 points below median at this stage is not a rounding error - it is a valuation conversation.
Why gross margin drives SaaS valuation multiples
Most founders understand conceptually that higher gross margin means higher valuation. Fewer understand the mechanism with enough specificity to act on it.
Here is the direct connection: investors value SaaS businesses primarily on ARR multiples. Those multiples are calibrated to gross margin because gross margin determines how much of each revenue dollar survives to fund growth and eventually generate profit. A company with 85% gross margin and $10M ARR has $8.5M to deploy. A company with 60% gross margin and $10M ARR has $6M. At scale, that difference is the difference between being able to fund growth from operations or perpetually needing external capital.
The data on valuation impact is clear. Research from Graphite Financial shows that SaaS startups with gross margins above 85% receive approximately 27% higher ARR multiples during fundraising and M&A processes. Those with margins below 70% see material valuation discounts and, more commonly, extended due diligence processes that often surface additional issues.
The investor logic is not complicated: a higher-margin business is more scalable, more capital-efficient, and closer to generating meaningful free cash flow. At every stage from Series A through IPO, gross margin is one of the first numbers that shapes how much leverage you have in a fundraising conversation. The KeyBanc/Sapphire survey data reinforces this - high-growth private SaaS companies growing more than 50% YoY are commanding premium multiples of ~14x ARR precisely because efficiency metrics like gross margin are holding up.
Where SaaS companies lose gross margin without realizing it
In my experience across dozens of SaaS engagements, margin leaks tend to cluster in a few predictable places. If you're below your target benchmark, one or more of these is almost certainly the culprit.
1. Cloud infrastructure that hasn't been optimized for scale
Early-stage companies often run on on-demand pricing because it's the path of least resistance. As ARR grows, the infrastructure bill grows proportionally - or faster, when poorly architected systems require brute-force compute to compensate.
The fix is systematic: reserved instance pricing, right-sizing compute, audit of idle or oversized environments, and architectural review of any components that scale superlinearly with customer usage. This is not a one-time project. It's a quarterly discipline.
A related problem is infrastructure costs that never make it into COGS at all. At one company around $20M ARR, data pipeline, cloud infrastructure, and vendor API costs totaling over $800K annually were sitting in an engineering budget line — because the team managing them reported to the CTO. Those costs were directly consumed in delivering the product to customers and scaled with usage, not headcount. Moving them to COGS dropped gross margin from 76% to 68%. The founder had been benchmarking against SaaS peers at 75–80% and assumed they were healthy. They were below median and had no idea, because the cost was hidden in the wrong line item.
CloudZero's research on SaaS gross margin benchmarks found that over 20% of engineering teams have little to no visibility into what they're actually spending in the cloud: a gap that makes systematic infrastructure optimization nearly impossible without the right tooling.
2. Customer success costs buried in COGS without pricing recourse
Many SaaS companies include a meaningful CS team in COGS - appropriately - but have never modeled whether their pricing supports that cost. If your annual contract value per customer is $8,000 and your CS team spends 15 hours per year per customer at a fully burdened hourly rate of $85, that's $1,275 of COGS per customer just from CS - before you count hosting, support, or onboarding. That's a 16% COGS burden from CS alone.
The answer is not to remove CS from COGS. The answer is to price correctly and to automate the highest-volume CS interactions to reduce the per-customer cost.
3. Professional services revenue blended into subscription gross margin
If you sell implementation or onboarding as part of your product, and you're reporting a single blended gross margin, you are almost certainly obscuring an important signal. Professional services margins are structurally lower - often 20-35% for B2B SaaS companies, versus 70-85% for subscription revenue. Blending them mathematically compresses your subscription gross margin and makes it impossible to distinguish what's happening in the core product from what's happening in the services business.
The fix is to track and report them separately. Investors will ask for this split anyway. Getting ahead of it is what investor-ready looks like.
4. Inconsistent COGS methodology from period to period
A gross margin that bounces by 5-8 percentage points month over month is not necessarily a business problem. It may be a classification problem. If expenses are allocated to COGS in some periods and to operating expenses in others, your margin is meaningless as a trend metric.
This is a common issue at companies that haven't established a formal chart of accounts with clear expense classification policies. Fixing it requires a documented COGS methodology, applied consistently, with a finance owner accountable for the classification review at each month-end close.
5. Headcount allocated incorrectly across the P&L
The most common version of this I see: a customer success leader whose team is split between COGS (retention-focused CS) and S&M (expansion-focused CS), but the allocation was set once during a budget cycle and never revisited as the team's responsibilities evolved. Over time, the allocation drifts from reality. The gross margin calculation becomes unreliable.
The same issue applies to DevOps engineers who start doing a mix of production support (COGS) and feature development (R&D). Without periodic reallocation reviews, the numbers drift.
How to read your gross margin as an operational signal
Gross margin is not just an investor metric. Used correctly, it is one of the most powerful diagnostic tools in your financial model.
Declining gross margin over time signals that COGS is growing faster than revenue. The causes are usually infrastructure costs running ahead of optimization, a growing CS team serving an increasingly complex customer base, or a services business mix shift. Each requires a different response.
Gross margin stable but below benchmark suggests a structural issue - either your pricing is not covering your delivery cost, or your delivery model is inherently high-touch relative to your price point. This is a pricing and product architecture problem, not an accounting problem.
Gross margin improving with scale is what investors want to see. It demonstrates operating leverage - the core promise of a SaaS business model. Each new customer adds less incremental COGS than the last, because the infrastructure is already built and the support model has become more efficient.
Gross margin significantly higher than benchmark is occasionally a warning sign, not always a celebration. If your SaaS gross margin is 90%+, I want to understand what you've left out of COGS. It may be legitimate - some horizontally scalable, low-touch products do achieve this naturally. But in my experience, a suspiciously high gross margin often means customer success and support costs are sitting in G&A or R&D where they don't belong.
Gross margin benchmarks for different SaaS delivery models
Not all SaaS businesses are structurally identical. Gross margin benchmarks need to be interpreted through the lens of your delivery model.
Pure-play, product-led SaaS
Companies with minimal human touch in delivery - self-serve onboarding, automated support, low CS intensity - should be achieving 80-88% gross margin at growth stage. If you're not, the gap is almost always in cloud infrastructure efficiency.
High-touch, enterprise SaaS
Enterprise SaaS companies with dedicated implementation, complex onboarding, and white-glove CS will carry higher COGS and should target 70-80% gross margin. The lower margin is structurally justified - the contract values are higher and the LTV is longer - but it needs to be tracked carefully to prevent the services component from dragging down the subscription economics. Our fractional CFO services for venture-backed startups are specifically built around this kind of margin architecture work - getting the subscription and services lines reported cleanly before a raise.
Vertical SaaS with embedded services
Vertical SaaS companies - serving specific industries like healthcare, construction, or legal - often bundle services, data, and compliance work into their offering. These companies typically run 65-75% gross margin, and that's acceptable when the ACV and retention profile justify it. Bessemer Venture Partners' State of the Cloud 2024 report notes that leading Vertical AI companies in their portfolio are already generating ~65% gross margins - with clear improvement trajectories as model costs drop and delivery architectures optimize. Traditional vertical SaaS should be above that floor.
Usage-based and consumption SaaS
Infrastructure-heavy, consumption-based models (think data processing, API-first products, AI inference workloads) often see 60-72% gross margin, especially early in their scaling curve. Cloud costs scale with usage in these models, which compresses margin until volume reaches a level that justifies architectural optimization or reserved capacity commitments.
What to do when your gross margin is below benchmark
Let me be direct about this: most gross margin problems I encounter are fixable. They require discipline and time, but they are not structural death sentences. Here is the practical sequence I use with Fiscallion clients.
Step 1: Audit your COGS classification. Before drawing any conclusions from your gross margin number, verify that the inputs are correct. Are all production infrastructure costs included? Is customer success allocated properly? Is anything sitting in COGS that belongs in OpEx? Correcting classification errors - in either direction - is the highest-priority first step, because everything downstream of it is built on that foundation.
Step 2: Separate subscription from services margin. If you have any professional services, implementation, or onboarding revenue, calculate your subscription gross margin and your services gross margin separately. You need to understand which one is the problem before you can fix it.
Step 3: Build a COGS per customer model. Take your total COGS and divide it by your customer count to understand what each customer actually costs to serve. Then segment by customer tier, product type, or contract size. In almost every case, margin concentration analysis reveals that a subset of customers - usually your largest or most complex - are consuming a disproportionate share of delivery cost at pricing that doesn't reflect it.
Step 4: Model the infrastructure optimization roadmap. Work with your engineering team to identify the three to five infrastructure changes that would have the highest margin impact. Reserved instance pricing, right-sizing, deprecating legacy architecture, and consolidating third-party dependencies are all common levers. Each one has an implementation cost and a payback period - model both.
Step 5: Revisit your pricing floor. The fully burdened labor rate framework is the right starting point for any service-heavy SaaS business. Your floor is 2.0x the fully burdened cost of delivery. Everything priced below that is margin-negative, and every margin-negative customer is subsidized by your margin-positive customers.
Step 6: Set a gross margin target and track it monthly. Gross margin improvement does not happen by accident. It happens when there is a named owner, a documented baseline, and a monthly tracking cadence. This is exactly the kind of financial discipline that separates companies that arrive at their Series B with a clear financial narrative from those who arrive and spend the first two weeks explaining their numbers.
Gross margin in board reporting and investor conversations
At Fiscallion, one of the most common gaps I see in board packages is the absence of a clear, segmented gross margin view. Revenue growth is always front and center. Gross margin is often buried, blended, or missing entirely.
That is a missed opportunity. A founder who can walk into a board meeting and say "our subscription gross margin was 78.4% this quarter, up from 76.1% last quarter, driven by infrastructure optimization on our EU-region deployment, and our services margin was 31%, which is consistent with our implementation-heavy Q4 customer cohort" - that founder is in complete command of their business.
Contrast that with the more common scenario: gross margin reported as a single blended number, no context, no trend, no segment breakdown. Investors fill that vacuum with their own assumptions, and those assumptions are rarely charitable.
The SaaS board reporting framework we use at Fiscallion treats gross margin as a Tier 1 metric alongside NRR, CAC payback, and cash runway - because those four metrics together tell the complete unit economics story of the business.
The connection between gross margin, NRR, and CAC payback
Gross margin doesn't exist in isolation. Its real significance emerges when you read it alongside your other core unit economics metrics.
Gross margin and NRR: Net revenue retention tells you how efficiently you expand within your existing customer base. But NRR expansion revenue comes with COGS attached. A 120% NRR sounds excellent - and it often is - but if your expansion revenue is coming from a professional services-heavy upsell, the gross margin on that expansion may be materially lower than your core subscription. The LTV model needs to reflect that. According to the KeyBanc/Sapphire 2024 survey, median net retention across 100+ private SaaS companies is holding steady around 101% - meaning expansion revenue is real, but margin quality of that expansion is rarely scrutinized enough.
A company at $9M ARR was reporting 118% NRR, which looked strong by any standard. When we broke it down by customer, two accounts represented 61% of the expansion revenue driving that number. Both expansions were effectively one-time events — one was a subsidiary consolidation, one was a completed geographic rollout. The forward-looking NRR absent those two accounts was 97%.
The board was making hiring and growth investment decisions based on 118%. If those expansion contracts also carried a heavier services component — and they did — the gross margin on that expansion revenue was materially lower than the subscription average. The headline NRR and the headline gross margin were both telling a story that the underlying cohort data didn't support.
Gross margin and CAC payback: The standard CAC payback formula divides CAC by monthly gross profit from new customers (MRR × gross margin). This is where gross margin directly gates your capital efficiency. A business with 75% gross margin and 15-month CAC payback is structurally different from one with 60% gross margin and 15-month nominal payback - the real payback on a gross profit basis for the second business is actually 18.75 months, because only 60% of each dollar recovered is genuinely available to repay customer acquisition cost.
When your gross margin is below benchmark, every other unit economics metric looks worse than it actually is. That is why fixing the margin is the highest-priority diagnostic when a founder is preparing for a fundraise and the unit economics aren't telling a clean story.
Get the inputs right and the margin story follows
Gross margin is one of the few metrics that touches everything: your valuation, your operational health, your ability to fund growth from internal cash flow, and your credibility in every investor conversation. Getting it right is not optional at any stage of the journey.
The benchmarks I've outlined here - 65-75% at early growth, 75-85% at scale, 85%+ for best-in-class pure-play SaaS - are directional anchors, not absolutes. Your delivery model, customer profile, and services mix all influence where you should be. What matters is that you understand your gross margin clearly, can explain the components behind it, and have a visible improvement trajectory.
If your gross margin is below where it should be, start with the audit. Verify the classification, separate subscription from services, and build a per-customer delivery cost model. The answers are almost always in the data - they just need someone who knows how to look.
That is exactly the work we do at Fiscallion. Whether you work with us as a fractional CFO for your SaaS startup or bring us in for a focused COGS audit ahead of a fundraise, we lead with numbers - yours, specifically. If you want a second set of eyes on your COGS structure or gross margin narrative ahead of a raise or board meeting, reach out to our team.
