
If you're running a SaaS company between $5M and $50M ARR, your LTV:CAC ratio is probably being tracked somewhere - a slide in the board deck, a tab in the financial model, maybe a number in a weekly metrics email. The problem isn't that you don't have it. The problem is that the ratio alone isn't telling you what to do next.
This article gives you the definition, the calculation, the cohort context that makes the number mean something, and the decision framework that connects your LTV:CAC ratio to actual capital allocation choices - headcount, channel mix, pricing, and runway.
Key takeaways
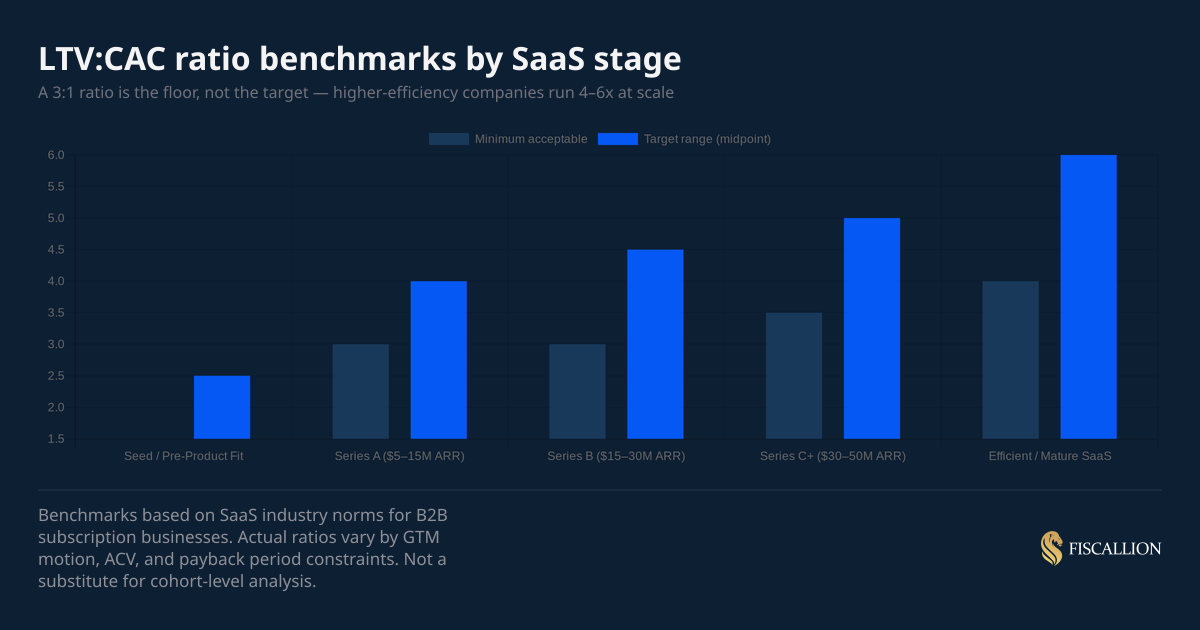
- A 3:1 LTV:CAC ratio is the widely cited floor for SaaS viability, but treating it as a target is a mistake. Efficient SaaS companies at Series B and beyond run 4:1 to 6:1.
- CAC payback period is the more operationally urgent metric. A ratio of 3:1 tells you whether the unit works. Payback tells you how long your cash is tied up before it starts compounding.
- LTV:CAC as a single blended number hides more than it reveals. Cohort-level and channel-level analysis is what makes it decision-ready.
What the LTV:CAC ratio actually measures
The LTV:CAC ratio compares the total gross profit a customer generates over their relationship with you to the cost required to acquire them.
LTV (customer lifetime value): The net present value - or simpler gross margin-adjusted version - of all revenue a customer will generate before churning.
CAC (customer acquisition cost): The fully loaded cost of acquiring one new customer, including sales salaries and commissions, marketing spend, tools, and any overhead directly tied to customer acquisition.
The ratio tells you how many dollars of value you generate per dollar spent acquiring customers. A ratio of 3:1 means you generate $3 of customer value for every $1 spent acquiring them.
Why this ratio is a capital allocation question, not a reporting exercise
At Fiscallion, we see the LTV:CAC ratio show up most often in two places: board decks and fundraising materials. Both are the wrong context for making it useful.
The ratio becomes useful when it's connected to a decision. Specifically:
- Should you spend more on customer acquisition? If LTV:CAC is above 4:1, you may be under-investing in growth. If it's below 2:1, more spend won't fix a unit economics problem.
- Which channels deserve more budget? Blended LTV:CAC hides channel-level differences. A paid search channel running 5:1 and an outbound motion running 1.8:1 look fine blended. Separately, they require completely different responses.
- Are you burning cash efficiently? LTV:CAC above 3:1 doesn't mean your cash position is healthy. Payback period can still be 24+ months, which matters when you have 18 months of runway.
How to calculate LTV, CAC, and the ratio
Calculating CAC
Formula:
CAC = Total sales and marketing spend / Number of new customers acquired
Inputs to include:
- Sales team salaries, commissions, and benefits
- Marketing team salaries and benefits
- Paid media and advertising spend
- Agency fees, tools, and software used primarily for acquisition
- Events and sponsorships
- Allocated overhead (a portion, not the full company overhead)
Time period: Use a consistent period - typically the quarter or trailing 12 months. Match the time lag between spend and acquisition. If your sales cycle is 90 days, your Q1 spend is more accurately compared to Q2 new customers, not Q1.
Common pitfalls:
- Excluding sales salaries from CAC (this undercounts by 30–60% in most sales-led companies)
- Using total marketing headcount cost including people focused on retention or brand, not just acquisition
- Mixing new customer CAC with expansion or upsell cost
Calculating LTV
There are two approaches: the simple version and the gross-margin-adjusted version. Always use the gross-margin-adjusted version for decision-making.
Simple LTV (avoid for decisions):
LTV = ARPU × Average customer lifespan
Gross-margin-adjusted LTV (use this one):
LTV = (ARPU × Gross Margin %) / Customer Churn Rate
Inputs:
- ARPU: Average revenue per user or account, per month
- Gross margin %: Should reflect SaaS gross margin after COGS - typically 65–85% for software, lower if you have significant services or infrastructure cost
- Churn rate: Monthly or annual logo churn rate. If you use monthly churn, the formula produces a monthly LTV base that you then multiply by 12 for annual comparison
Example:
If CAC = $18,000, the LTV:CAC ratio is 75,000 / 18,000 = 4.2:1.
The ratio formula
LTV:CAC Ratio = LTV / CAC
Expressed as a multiple (e.g., 4.2x or 4.2:1). Both conventions are used in SaaS - multiples are more common in internal models; ratios appear more in investor materials.
Benchmarks by SaaS stage and GTM motion
The 3:1 benchmark is widely cited because David Skok established it as the minimum threshold at which unit economics become defensible - specifically, he noted that "LTV should be about 3x CAC for a viable SaaS or other form of recurring revenue model" and that most high-performing public SaaS companies run closer to 5x. It's a floor, not a target.
GTM motion matters as much as stage:
- Product-led growth (PLG): CAC is lower (lower sales and marketing overhead per conversion), which inflates the ratio. Target 5:1+ at scale.
- Sales-assisted SMB: Expect 3–4:1. Sales efficiency is the dominant variable.
- Mid-market / enterprise: Longer sales cycles and higher ACV. Ratio may run 2.5–4:1 during build-out but payback period is the more relevant operational constraint.
What a ratio above 5:1 actually signals
A very high ratio (above 6:1) isn't always good news. It can mean:
- You're under-investing in growth relative to what the market allows
- Your payback period is long and the ratio looks good because the denominator (CAC) is being held artificially low
- You've mixed expansion revenue into LTV, which overstates acquisition unit economics
The correct response to a ratio above 5:1 is to ask: "Could we add 20–30% to acquisition spend and still hit our return threshold?" If yes, you're leaving growth on the table.
CAC payback period - the metric that connects ratio to cash
The LTV:CAC ratio tells you whether the unit economics are sound. CAC payback period tells you how long your cash is tied up before a customer becomes cash-flow positive.
As OpenView Partners' Kyle Poyar notes, "CAC payback is a fantastic metric mostly because it's better than the alternatives" - it's more sophisticated than CAC alone and avoids the ceiling problem in high-retention SaaS businesses where LTV can appear nearly limitless.
Formula:
CAC Payback Period (months) = CAC / (MRR per customer × Gross Margin %)
Example (continuing from above):
CAC = $18,000
MRR per customer = $1,500
Gross margin = 75% CAC Payback = $18,000 / ($1,500 × 0.75) = $18,000 / $1,125 = 16 months
At a 16-month payback period, every customer you acquire ties up $18,000 for over a year before they contribute net positive cash flow. If you're growing at 100+ customers per quarter, this compounds quickly against your runway.
The interaction between ratio and payback
The ratio and payback period don't always point in the same direction. Understanding the combination is what drives the right capital allocation decision:
OpenView also highlights the importance of pairing CAC payback with net dollar retention (NDR): companies with CAC payback under 12 months and NDR above 120% show dramatically better growth durability than peers - median growth of 200% versus 35% for companies that score poorly on both metrics.
What movements in the ratio actually signal
A ratio that holds flat quarter over quarter is not neutral - it means your CAC and LTV are moving together. A ratio that improves could reflect efficiency, or it could reflect a measurement change. Always look at the numerator and denominator separately.
LTV rising signals
- Gross margin improvement (pricing, lower COGS)
- Churn reduction (product stickiness, customer success investment)
- ARPU expansion from upsells or seat growth
- Shift to annual contracts (reduces effective churn rate)
LTV falling signals
- Churn accelerating by cohort (early cohorts were better customers)
- Downgrades or contraction MRR increasing
- Gross margin compression from infrastructure or services cost
- ARPU declining as you move downmarket
CAC rising signals
- Sales cycle lengthening (win rates dropping, competitive pressure)
- Paid channel saturation (more spend required per conversion)
- Sales team efficiency declining (ramp time, quota attainment dropping)
- Marketing generating less qualified pipeline at the same spend
CAC falling signals
- Brand-driven inbound improving conversion rates
- PLG motion maturing
- Referral or partner channels contributing
- Sales team efficiency improving through better tooling or process
The key discipline: when you report LTV:CAC to your board, include a one-line explanation of which input moved and why. That's what converts the metric from a score into a management signal.
Common mistakes and how to replace them
Mistake 1: Reporting a single blended LTV:CAC ratio
The blended ratio hides the performance differences between channels, segments, and cohorts. A 3.5:1 blended ratio could include a 6:1 inbound channel and a 1.5:1 outbound channel running simultaneously.
Replace it with: Channel-level and segment-level breakdowns. At minimum: one number per acquisition channel, one number per customer segment (SMB vs. mid-market vs. enterprise).
Here's an example: A company at $13M ARR had a blended LTV:CAC of 3.6x — healthy enough to justify a 40% increase in the marketing budget. When we broke it down by channel, inbound and content were running at 6.1x, outbound at 2.2x, and paid social at 1.4x. The budget increase got redirected entirely: more into content, paid social cut by 70%, outbound restructured around a narrower ICP.
Mistake 2: Using simple LTV without gross margin adjustment
Revenue-based LTV inflates the ratio by 15–35% for most SaaS companies because it ignores the cost to deliver the product. A 75% gross margin company that reports revenue-based LTV is overstating LTV by 33%.
Replace it with: (ARPU × Gross Margin %) / Churn Rate. This produces a gross profit-based LTV that's comparable across business model types. Harvard Business School's Entrepreneurial Marketing course makes the same distinction - true LTV should reflect the contribution margin on each customer's revenue, not the revenue itself.
Mistake 3: Treating 3:1 as a target rather than a floor
A 3:1 ratio achieved by holding CAC low while letting growth stagnate is not the same as a 3:1 ratio under growth investment. The ratio only matters in the context of the growth rate you're achieving.
Replace it with: Pair the ratio with growth rate and payback period. A 3:1 ratio at 15% ARR growth is very different from a 3:1 ratio at 60% ARR growth. SaaS Capital's 2024 benchmarks survey - covering more than 1,500 private B2B SaaS companies - found that growth rate and net revenue retention are the primary drivers of valuation multiples, not the ratio in isolation.
Mistake 4: Using total marketing and sales headcount rather than acquisition-specific spend
Many finance teams allocate all of marketing and sales cost to CAC, including retention-focused customer success, account management, and brand activities. This overstates CAC and suppresses the ratio.
Replace it with: Split acquisition spend from retention spend explicitly. Define and document which budget lines go into CAC before you run the calculation - and make sure that definition is consistent quarter to quarter.
Mistake 5: Ignoring the time-lag between spend and acquisition
If your average sales cycle is 60–90 days, spending in Q1 generates customers in Q2. Using Q1 spend and Q1 new customers understates CAC for fast-growing companies and overstates it for decelerating ones.
Replace it with: Use a lagged CAC calculation. Match your average sales cycle length to offset spend to the appropriate acquisition period.
Mistake 6: Debating the number instead of acting on it
This is the one we see most often at Fiscallion. The ratio becomes a debate topic at board meetings - "is our LTV assumption correct?" - rather than a decision trigger. Teams spend two hours discussing methodology and leave without a capital allocation decision.
Replace it with: Define the methodology once, document the assumptions, assign an owner, and then use the ratio to frame a trade-off. "Our LTV:CAC is 2.8:1 in the outbound channel. We have two options: cut outbound by 30% and redeploy to inbound, or increase outbound investment to test whether volume improves efficiency. Here's the runway impact of each."
Here's an example: At a $17M ARR company, a board meeting spent nearly two hours on a single metric. The founder had a 4.2x LTV:CAC. One board member had 2.8x. A second had a third number. None of them were wrong — they were using different inputs on churn, LTV horizon, and which costs to include in CAC. Writing all three versions side by side on a whiteboard resolved the disagreement in fifteen minutes.
Bain & Company research on customer lifetime value reinforces this point directly: marketing leaders who actually scrutinize LTV in addition to traditional acquisition metrics are 1.9x more likely to align strategy with customer needs - and the companies that act on lifetime value data report a threefold annual increase in return on marketing spend.
A working checklist for making LTV:CAC decision-ready
Most LTV:CAC problems are not calculation problems. They are process problems. The number gets produced but nobody owns the inputs, the segmentation never happens, and the board meeting ends without a decision. This checklist is designed to close that gap. Use it before your next quarterly review or board prep.
Definition and calculation (do once, review quarterly)
- Define CAC: list exactly which budget lines and headcount costs are included
- Define LTV: confirm you're using gross-margin-adjusted LTV, not revenue-based LTV
- Document the time-lag offset you're using to match spend to acquisitions
- Set a consistent period (trailing 12 months recommended)
- Assign a named owner to maintain the inputs each quarter
Segmentation (do quarterly)
- Calculate LTV:CAC by acquisition channel (paid, inbound, outbound, partner, referral)
- Calculate LTV:CAC by customer segment (SMB, mid-market, enterprise)
- Calculate CAC payback period alongside the ratio for each segment
- Flag any channel where LTV:CAC is below 2.5:1 for immediate review
Interpretation (do before each board meeting)
- Identify which input (LTV or CAC) drove any quarter-over-quarter movement
- Write a one-sentence explanation of the movement cause
- Pair the ratio with current growth rate and runway
- Prepare one capital allocation question the ratio should answer
Decision output (required)
- Frame a specific trade-off the ratio supports: increase spend, hold, or reduce in a named channel
- Estimate the runway impact of each option
- Assign ownership of the next action
Frequently asked questions
What is a good LTV to CAC ratio for SaaS?
The widely accepted floor is 3:1 - meaning each customer generates at least three times the gross profit value of what it cost to acquire them. But "good" depends on stage, growth rate, and GTM motion.
At Series A ($5–15M ARR), a 3:1 ratio is defensible but not compelling. Investors expect to see a path to 4:1+ as you scale. At Series B and beyond, strong performers run 4:1 to 6:1.
A ratio above 5:1 at a company growing faster than 40% ARR is genuinely strong. A ratio above 5:1 at a company growing 10% ARR may just reflect under-investment in growth. The ratio only makes sense in context.
What is a good CAC to target ratio in SaaS?
The standard benchmark is 3:1 (LTV:CAC), which means you target a CAC of no more than one-third of the projected LTV. In practice, your CAC target should be derived from your payback period constraint, not just the ratio.
If your board requires payback under 18 months, and your customers generate $1,200/month at 70% gross margin ($840 net), your maximum CAC target is $840 × 18 = $15,120. Build CAC targets from payback logic, then verify they produce an acceptable LTV:CAC ratio.
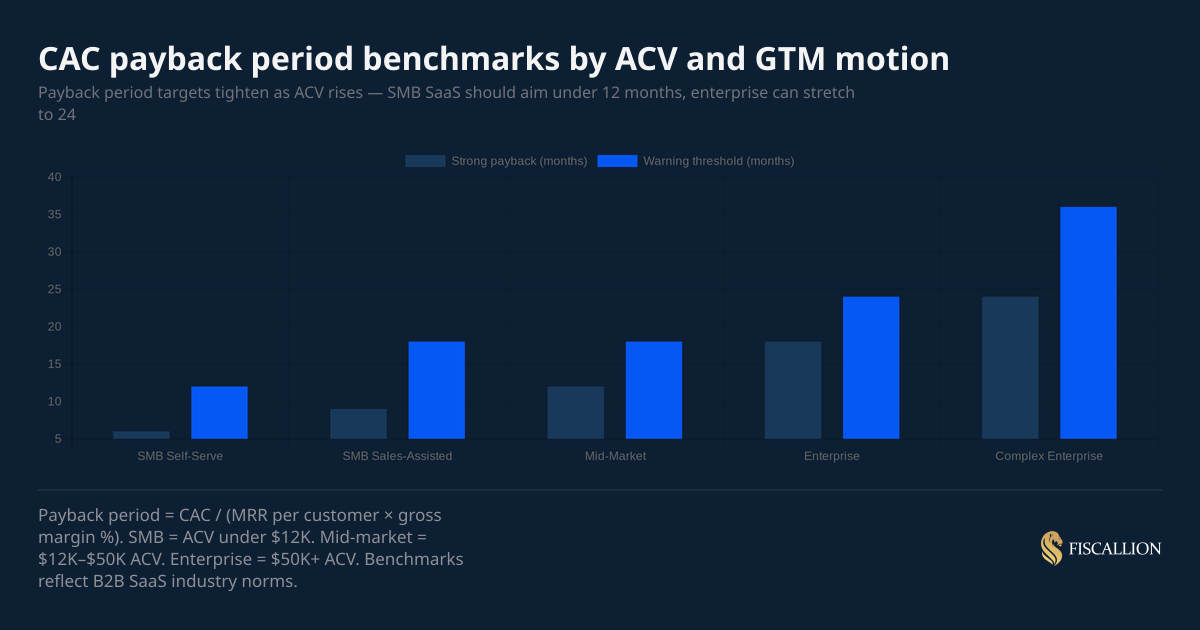
What is a good CAC payback for SaaS?
The benchmark varies significantly by segment:
- SMB self-serve: Under 6 months is strong. Over 12 months is a warning.
- SMB sales-assisted: Under 9 months is strong. Over 18 months requires attention.
- Mid-market: Under 12 months is strong. Over 18 months warrants review.
- Enterprise: Under 18 months is strong. Over 24 months is acceptable with multi-year contracts but requires monitoring.
For companies running less than 18 months of runway, payback period is more operationally critical than the ratio itself. A 4:1 ratio with 24-month payback burns cash fast in a growth push. Know both numbers before making acquisition investment decisions.
What's a good CAC to LTV ratio?
This is the same metric expressed in reverse. A "good" CAC:LTV ratio is 1:3 or lower - meaning CAC is one-third or less of LTV. Expressed as a decimal, you want CAC:LTV below 0.33.
Below 0.25 (i.e., LTV:CAC above 4:1) is where SaaS companies start showing genuine capital efficiency. Above 0.40 (LTV:CAC below 2.5:1) means the unit economics need attention before you increase acquisition investment.
A ratio that doesn't change a decision isn't doing its job
The LTV:CAC ratio is not a reporting metric. It's a capital allocation signal - and it only works when the inputs are defined consistently, the cohort data supports the aggregate number, and the output connects to a real decision about spend, headcount, or channel mix.
At Fiscallion, we see the same pattern repeatedly in companies between $5M and $50M ARR: LTV:CAC is tracked, reported, and debated, but it doesn't change what anyone does the following quarter. The ratio sits in the board deck, gets a head nod, and the same acquisition budget runs the same channels at the same intensity.
The fix is not a better ratio. It's a better decision process around the ratio.
Start with a clean definition. Segment it by channel and customer type. Pair it with payback period. Then ask one question: given this number, what should we do differently with our acquisition investment next quarter? That's the version of LTV:CAC that earns its place in your FP&A model.
If you want a structured template for tracking LTV:CAC by cohort and channel alongside payback period and runway impact, get the unit economics template from Fiscallion.
