

Most founders I speak with at the Seed-to-Series B stage have heard the same version of the NRR benchmark story: "You need to be above 100%. Best-in-class is 120%+." That framing is not wrong, but it is incomplete in ways that matter. Comparing your NRR to an enterprise-focused public company when you sell to SMBs is like comparing your burn rate to Salesforce's capex budget. The number tells you something, but not what you actually need to know.
Net revenue retention is the single metric that best reveals whether your SaaS business compounds or leaks. It determines how much growth you need to generate from new customers just to stay in place. It shapes how investors model your terminal value. And when presented without context - without segmenting by ACV, ARR stage, or pricing model - it can create a dangerously false sense of comfort.
This article walks through the actual 2025 benchmarks for private B2B SaaS companies, organized the way a CFO would organize them: by the variables that actually drive the number.
Key takeaways
- The overall median NRR for private B2B SaaS in 2025 is 106%, but that single number is almost meaningless without knowing ACV, ARR stage, and pricing model.
- SMB-focused companies (ACV below $25K) have a structurally lower expansion ceiling. A 97% NRR is median performance for that segment - not a warning sign.
- Enterprise companies (ACV above $100K) should target 118% or higher at the median, with top performers exceeding 130%.
- Growth-stage companies ($10M-$50M ARR) face the highest investor NRR expectations: 110-120% is the "good" band, 125%+ is best-in-class.
- NRR above 100% can still mask a serious problem if logo churn is high and a handful of large accounts are doing the expansion heavy lifting.
- Companies with 120%+ NRR command 10-12x ARR valuation multiples versus 6-8x for companies at 100%.
- GRR (gross revenue retention) is the partner metric that stops NRR from lying to you.
What we'll cover
- What NRR actually measures (and what it doesn't)
- The 2025 benchmark data by customer segment (ACV)
- NRR benchmarks by ARR stage
- How pricing model changes the whole picture
- The NRR-valuation connection investors use but rarely explain
- The GRR floor - why NRR without it is a half-truth
- Common NRR calculation errors that distort your number
- How to improve NRR from where you are now
What NRR actually measures (and what it doesn't)
Net revenue retention measures the percentage of recurring revenue retained from an existing cohort of customers over a set period, after accounting for expansion (upsells, cross-sells, usage growth), contraction (downgrades), and full churn.
The formula is straightforward:
(Starting MRR + Expansion - Contraction - Churn) / Starting MRR × 100
When NRR is above 100%, your existing customer base is growing revenue on its own - even if you do not add a single new customer. When it is below 100%, you are losing revenue from that base and every new customer you acquire starts the clock over on replacement, not growth.
What NRR does not measure is equally important. It tells you nothing about how many customers you are losing. A company with 125% NRR could be churning 20% of its logos annually while one or two enterprise accounts expand heavily enough to offset the losses. That is not a retention success story. That is a concentration risk masquerading as one.
A company at $9M ARR was reporting 118% NRR, which is a strong number at that stage by any benchmark. When we broke it down by customer, two accounts represented 61% of the expansion revenue driving that 118%.
Both expansions were effectively one-time events — one was a consolidation of multiple subsidiaries onto one contract, the other was a geographic expansion the customer had explicitly said was complete. The forward-looking NRR absent those two accounts was 97%. The board was making hiring and growth investment decisions based on 118%.
The corrected view was 97% — which is a retention story, not an expansion story, and requires a completely different operating posture.
NRR also does not distinguish between expansion types. Revenue growth from genuine upsells driven by product adoption is fundamentally different from revenue growth from forced price increases. The number looks the same on the dashboard. The business dynamics are not the same.
Keep those two caveats in mind as we go through the benchmarks.
The 2025 benchmark data by customer segment
The most useful way to benchmark NRR is by ACV (average contract value). More than ARR stage, funding status, or industry vertical, companies with similar ACVs share structural similarities: how they go to market, how they support customers, and crucially, how much room they have to expand. SaaS Capital's 2025 retention benchmarks report - drawing on annual surveys of private B2B companies - confirms ACV as the single most reliable segmentation variable for NRR comparison.
Here is where the 2025 private B2B SaaS market sits across segments, sourced from SaaS Capital's annual private company survey and verified benchmarks as of March 2026:
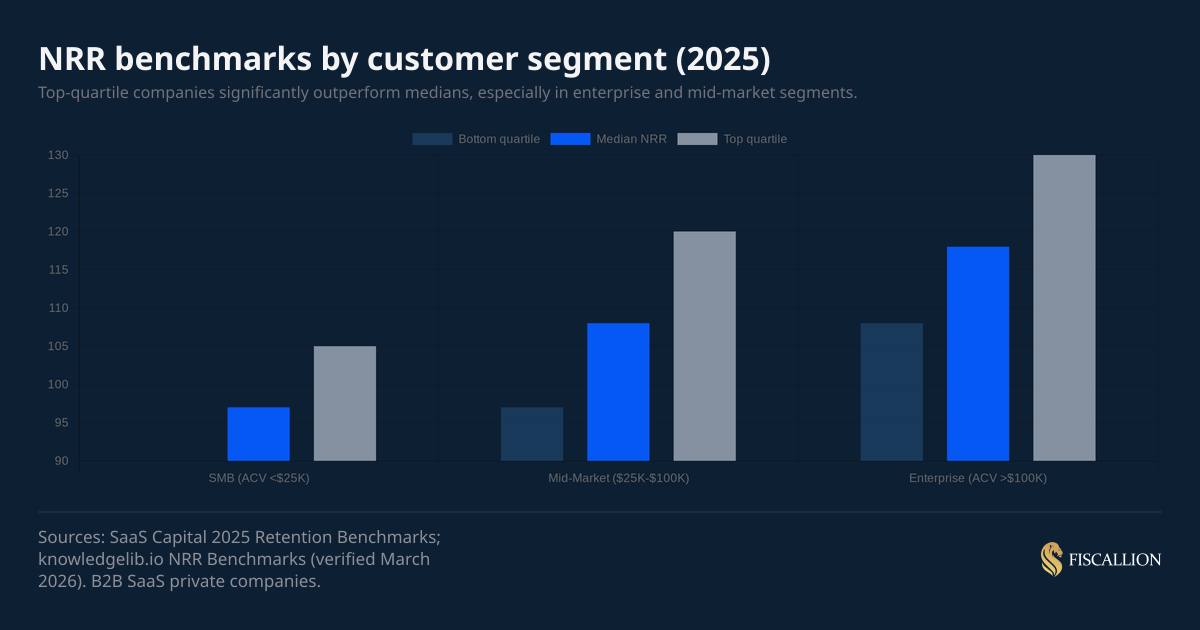
The gap between segments is not subtle. An SMB-focused company at 97% NRR is sitting exactly at the median for its peer group. That same 97% NRR at an enterprise-focused company signals a serious problem. Context is everything.
Why enterprise commands higher NRR
Higher-priced solutions typically involve longer sales cycles, in-depth scoping, dedicated implementation, and ongoing account management. All of that creates stickier product relationships. Enterprise customers also have more budget to expand across seats, modules, and use cases - the three most common expansion vectors.
If you are selling into enterprise accounts and your NRR is below 110%, that is a gap worth understanding: is it a pricing structure issue (no clear upsell path), a product depth issue (nothing worth expanding into), or a customer success capacity problem?
The SMB structural reality
SMB expansion ceilings are lower. Smaller companies have fewer seats to add, tighter budgets, and less organizational complexity that benefits from additional modules. Getting an SMB-focused SaaS above 110% NRR typically requires some form of usage-based pricing that grows with the customer's usage, not just their headcount.
If your ACV is below $25K and your NRR is above 105%, you are in the top quartile for your cohort. That is worth communicating clearly to investors, not buried in a general "above 100%" statement.
NRR benchmarks by ARR stage
Beyond ACV, where you sit in the growth arc changes what investors expect. Early-stage companies have fewer cohorts to measure and higher churn volatility. Growth-stage companies have enough history to have meaningful cohort analysis but face the highest expansion expectations. Scale-stage companies need to defend retention at volume.
Here is the target map by ARR range, consistent with benchmarks published by High Alpha's 2025 SaaS Benchmarks Report and cross-referenced against SaaS Capital's survey data:
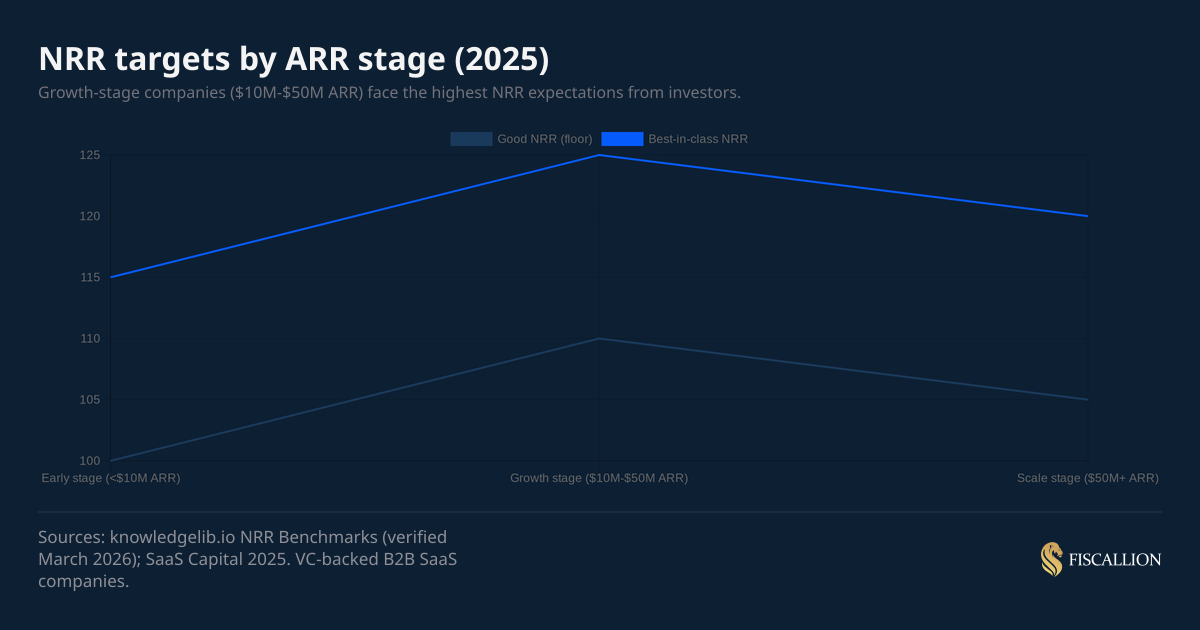
Note the counterintuitive dip at scale. Companies at $50M+ ARR often face NRR compression because they have penetrated their core accounts deeply, adding new modules is harder, and their customer mix may have broadened to include segments with lower expansion potential. Strong scale-stage companies manage this through new product lines, international expansion, and usage-based components.
The growth-stage crunch
The $10M-$50M ARR band is where NRR pressure intensifies most sharply. Investors at this stage have enough data to do rigorous cohort analysis, and they will. They expect to see clean monthly cohort waterfalls, segmented expansion breakdowns, and a clear story about what is driving the NRR number - not just the headline percentage.
I have worked with founders at this stage who had genuinely strong NRR but could not articulate where it came from. That inability to explain the drivers - seat expansion versus price increases versus cross-sell - is itself a red flag in a diligence conversation, regardless of the absolute number. The same principle applies to CAC payback: a blended number that looks fine can hide serious structural inefficiency underneath.
How pricing model changes the whole picture
Pricing model is the variable that most often gets ignored when founders compare their NRR to industry benchmarks - and it is probably the most important modifier of all.
A usage-based company at 110% NRR is underperforming for its model type - the built-in expansion from consumption growth should push that number higher. A flat-subscription company at 105% NRR is genuinely outperforming its cohort, because it is generating expansion without the mechanical lift that usage-based pricing provides.
Benchmarking your NRR without anchoring it to your pricing model is how founders end up with a number that looks fine but tells you nothing useful.
Usage-based pricing and NRR inflation risk
Usage-based pricing creates a real analytical risk: NRR can look exceptional even when the underlying product relationship is fragile. If a single customer triples their usage in a quarter, your NRR spikes. If that customer then reduces usage sharply, NRR collapses. This volatility makes cohort smoothing and trailing 12-month NRR measurements more important for usage-based businesses than for subscription-only companies.
The NRR-valuation connection investors use
This is the part of the NRR conversation that most founders do not have visibility into until they are in a term sheet negotiation. Investors use NRR as a direct input into revenue multiple frameworks.
The relationship is not subtle:
- Companies with 120%+ NRR typically command 10-12x ARR multiples
- Companies with ~100% NRR tend to see 6-8x ARR multiples
- Companies with sub-90% NRR face significant multiple compression and sometimes struggle to attract growth-focused investors entirely
According to m3ter's 2026 analysis of NRR and SaaS valuations, a 10-point improvement in NRR - say, from 110% to 120% - can translate to a 20-30% increase in valuation, often worth tens of millions of dollars at growth stage. The logic is grounded in capital efficiency: higher NRR means your existing ARR base is self-compounding, which reduces the amount of new logo growth required to hit any given revenue target.
High Alpha's 2025 SaaS Benchmarks Report makes the growth connection concrete: SaaS companies with high NRR grow 2.5x faster than their low-NRR counterparts. Companies with NRR above 106% consistently outpace the population median growth rate of 24%; those below 100% fall beneath it. The difference in outcomes is not marginal.
For founders preparing for a Series A, B, or C process, NRR is not just a health metric. It is a valuation lever. A five-point improvement in NRR from 103% to 108%, sustained over two to three quarters before a raise, can materially change how your company is priced. This dynamic compounds with burn multiple: companies with strong NRR and efficient burn multiples routinely command the highest multiples in investor models, because the combination signals that growth is both durable and capital-efficient.

The GRR floor - why NRR without it is a half-truth
Gross revenue retention (GRR) is the metric that stops NRR from misleading you. GRR measures retained revenue excluding expansion - it can never exceed 100% because it only captures what you kept, not what you added.
GRR = (Starting MRR - Contraction - Churn) / Starting MRR × 100
The healthy GRR floors by segment in 2025:
- SMB: GRR above 85% is solid; top quartile exceeds 90%
- Mid-market: GRR above 88%; top quartile at 92%+
- Enterprise: GRR above 92%; top quartile at 95%+
If your NRR is 115% but your GRR is 78%, you have a leaky bucket problem. You are losing 22% of revenue from existing customers annually and covering it entirely through expansion from the accounts that stay. That is not sustainable at scale. When the expansion pool shrinks - because your best accounts hit their ceiling - the NRR number collapses.
The practical rule: if GRR is below 80%, the expansion motion in your NRR is compensating for a fundamental retention failure. Investors doing serious diligence will find this. It is better for you to find it first.
SaaS Capital's research on private B2B retention rates is explicit on this point: the relationship between NRR and growth is exponential, not linear. Across their survey of companies with over $1M in ARR, the median growth rate was 24%. Companies with NRR above 110% grew significantly faster than the population median. Companies with NRR below 100% were consistently below it. The compounding effect of even a few percentage points of NRR improvement accumulates meaningfully over a three-to-five-year period. Their separate 2025 growth rate benchmarks report - based on 1,000+ private B2B SaaS companies - further confirms that companies with the highest NRR report median growth 83% higher than the population median.
Common NRR calculation errors that distort your number
In practice, I see the same calculation errors show up in board decks across early and growth-stage companies. These errors usually make NRR look better than it is.
Including new customer expansion in the NRR cohort
NRR should only measure revenue from customers who existed at the start of the measurement period. If a customer signed in month 2 of your measurement window and expanded by month 12, including that expansion inflates NRR by counting what is effectively new customer acquisition contribution as retention.
Fix: use only customers present at the start of the period. Track new cohorts separately.
Using blended gross margin instead of subscription gross margin
If your company has professional services, implementation revenue, or support contracts alongside subscription revenue, blended gross margin will be lower than subscription gross margin. This matters because some NRR calculations weight by gross margin contribution. Using blended figures distorts the comparison to subscription-only benchmarks.
Fix: calculate NRR on subscription MRR only, unless you are explicitly comparing to a benchmark that includes services revenue. This is the same principle that applies to CAC payback calculations - using blended margin instead of subscription margin is one of the most common formula errors we see in growth-stage companies.
Normalizing annual contracts that renew mid-period
Annual contracts create timing distortions. If most of your book renews in Q1, your NRR will spike in Q1 and compress in other quarters. This volatility is a measurement artifact, not a business signal, but it can produce misleading month-over-month NRR movement.
Fix: use trailing 12-month NRR as your primary benchmark metric. It smooths out renewal timing effects.
Ignoring the definition drift problem
NRR means different things to different companies and different investors. Some include reactivations. Some exclude downgrades and only net against full churns. Some cap a customer's MRR in the period at their starting MRR (which is actually GRR, not NRR). When you present NRR to an investor, define your calculation methodology explicitly. This is not a minor footnote. Definition drift in NRR is one of the most common sources of friction in due diligence.
Our SaaS board reporting framework covers the full NRR definition and how to present it in a way that prevents definition confusion in investor conversations.
How to improve NRR from where you are now
Improving NRR is not one lever - it is a combination of reducing the outflows (churn and contraction) and increasing the inflows (expansion). The right starting point depends on where the gap is in your current NRR decomposition.
Step 1: decompose your NRR first
Run the three-part breakdown:
- Gross churn rate: revenue lost from customers who left entirely
- Contraction rate: revenue lost from customers who downgraded
- Expansion rate: revenue gained from upsells, seat additions, or usage growth
An NRR of 103% from 8% expansion minus 5% churn is a very different business than 103% NRR from 3% expansion minus 0% churn. The first company has a meaningful churn problem being papered over by a strong expansion motion. The second is a stable but expansion-constrained business. The diagnosis and prescription are completely different.
Step 2: set the right target for your cohort
Before you start moving levers, anchor to the right benchmark for your ACV band and pricing model. Trying to achieve 120% NRR when your ACV is $8K and you run a flat subscription model is chasing a target that does not exist in your pricing structure. The more useful question is: how do you get from the 60th percentile to the 80th percentile in your actual cohort?
Step 3: build the expansion motion deliberately
The most common reason NRR stays flat in the 100-105% range for SMB and mid-market companies is the absence of a structured expansion motion. Expansion does not happen automatically at renewal. It requires:
- Clear packaging that creates a natural upgrade path
- Customer success coverage that surfaces value milestones and connects them to upsell conversations
- Proactive account reviews tied to usage data, not just reactive support
For seat-based products, the simplest expansion lever is license count tied to actual usage - ensure your contracts allow and encourage adding seats without requiring a full renewal negotiation.
The companies that moved NRR most consistently in the SMB range were the ones that identified a specific feature or usage limit in the base plan that customers were genuinely hitting, and created a low-friction path to the next tier at the moment they hit it. One client moved from 97% to 109% NRR over five quarters by identifying that their median customer was hitting their seat limit at month eight on average, building a one-click upgrade prompt at 80% of limit, and pricing the next tier at a number that felt like a small incremental cost relative to the value already being received.
Step 4: address the churn root cause, not the symptoms
Churn reduction is where most companies reach first, but doing it without understanding the root cause is expensive. The three most common churn drivers across early and growth-stage SaaS companies are:
- Poor onboarding: customers who do not activate core features in the first 30-60 days churn at rates 2-3x higher than those who do
- Value gap at renewal: customers who cannot articulate ROI at renewal do not renew
- Pricing misalignment: customers who were initially discounted heavily to close and feel they overpaid for actual value delivered
Each requires a different intervention. Onboarding failure is a product and CS process problem. Value gap is a reporting and communication problem. Pricing misalignment is a sales qualification problem. Treating all churn with the same customer success playbook rarely moves the NRR number significantly.
Step 5: track NRR by cohort, not just in aggregate
Aggregate NRR hides the most useful information. Cohort-level NRR, tracked quarterly, reveals which customer vintages are retaining and expanding well, and which are deteriorating. That cohort data tells you whether a retention problem is concentrated in a specific product version, a specific channel, a specific customer segment, or a specific sales motion. Without cohort visibility, NRR improvement efforts are largely guesswork.
This is exactly the kind of financial structure we build with founders at Fiscallion - not just the headline NRR number, but the cohort model and decomposition that turns a single metric into a decision-ready view of the business.
NRR compounds — so does the cost of ignoring its composition
The net revenue retention benchmark that matters is not 100%, or 110%, or even 120%. The benchmark that matters is the one calibrated to your ACV, your pricing model, and your ARR stage. Getting that calibration right is not an academic exercise. It determines whether you are operating with a real advantage or chasing targets that do not apply to your business.
The broader picture from 2025 data is clear: NRR compounds. SaaS Capital's data shows companies with the highest NRR post median growth 83% above the population median. The multiple premium for strong NRR is substantial and measurable. And the investors running your next diligence process will decompose the number - they will ask for GRR alongside NRR, cohort waterfall data, and an explanation of what is driving expansion.
The founders who come into that conversation with clean cohort data, a clear NRR methodology, and a segment-specific benchmark comparison hold the room differently than those who show up with a single headline percentage. From chaos to clarity - that is the move that changes how your company is priced.
If you need help building the financial model and metrics framework behind a number like this, we work with SaaS founders across every stage to do exactly that.
