

A board member asks why headcount grew 40% while revenue grew 25%. You do not have a clean answer, because you have never tracked revenue per employee as a decision metric, only as a line on a slide someone builds the week before the meeting.
That is the wrong moment to start caring about it. Revenue per employee is one of the fastest indicators of operational leverage: it tells you whether your last ten hires actually expanded your revenue-generating capacity or simply bloated your fixed costs. Before your next board meeting, you need this metric treated as a core operational lever, not just a static line item on a slide.
This piece gives you the formula, current benchmarks by ARR stage, how to read the number in context, and the specific mistakes we see companies between $5M and $50M ARR make when they lean on this metric without the surrounding FP&A discipline to interpret it.
Key takeaways
- Revenue per employee (usually ARR per FTE for subscription businesses) equals annual recurring revenue divided by full-time equivalent headcount, counted honestly across contractors and offshore staff.
- Private SaaS companies at $5M to $20M ARR run a median of roughly $130K to $144K per FTE. That climbs to $220K at $50M to $100M ARR and $300K above $100M ARR, according to 2025 Benchmarkit and SaaS Capital data.
- Efficiency gains are steepest early and flatten hard after $10M ARR. Do not expect the same rate of improvement at $30M ARR that you saw at $3M ARR.
- The number is a diagnostic, not a target. A rising revenue-per-employee figure driven by layoffs and a stalled growth rate is a warning sign, not a win.
- The right use case is pairing this metric with your headcount plan and hiring pace, not reporting it in isolation on a board slide.
What revenue per employee actually measures
Revenue per employee is a proxy for operating leverage: how much recurring revenue your organization produces for every person on payroll. For a subscription business, the cleaner version of this metric is ARR per FTE, since one-time services revenue and implementation fees distort the picture if you use total revenue in the numerator.
The metric traces back over a century to scientific management principles applied to factory labor, and it became a standard efficiency screen for public equity analysts in the 1980s and 1990s. It matters more now because SaaS boards and investors use it as a quick gate on capital efficiency, particularly since the growth-at-all-costs era ended. A company that cannot show improving revenue per employee alongside its growth rate has a harder time defending its next valuation.
At Fiscallion we treat this metric the way we treat CAC and LTV: as a range tied to a cohort, not a single flattering number pulled for a slide. The useful version of revenue per employee is segmented by function, by business model, and by stage, because the raw number without that context tells you almost nothing about whether your organization is actually getting more efficient or just getting smaller.
Why the denominator is the part people get wrong
The formula looks trivial. The counting rules are not.
- Full-time staff count as 1.0 FTE, no exceptions.
- Part-time staff count at their fractional load (20 hours a week is 0.5 FTE).
- Contractors on ongoing engagements should count close to 1.0 FTE if they function like staff. Excluding them to flatter the ratio defeats the purpose of tracking it.
- Offshore or outsourced teams count on a 1:1 basis in most rigorous benchmarking approaches. Discounting offshore headcount because it is cheaper is a cost accounting question, not a headcount accounting question, and conflating the two hides real productivity data.
- Short-term contractors under roughly three months can reasonably be excluded, since they are not part of the durable operating base you are trying to measure.
If your FTE count moves around depending on who is asking, your revenue-per-employee trend is not measuring anything real. Fix the counting rule once, document it, and apply it consistently quarter over quarter.
How to calculate revenue per employee
The base formula:
Revenue per employee = Annual recurring revenue / Total FTEs
A $20M ARR company with 100 FTEs is running at $200K per FTE. That is the headline number most benchmarking sources report, and the one your board will expect to see.
Three variants give you more decision-useful detail than the headline number alone:
Do not report only the headline number in a board deck and call it done. If revenue per employee is flat while sales headcount grew 30%, the blended figure hides a go-to-market efficiency problem that a function-level cut would expose immediately.
To prevent these departmental imbalances from flying under the radar, finance teams must break down the top-line number into functional benchmarks.
This is the same discipline we apply when building a SaaS financial model template: the aggregate number is the entry point, not the analysis.
One more numerator decision matters: ARR versus GAAP revenue. Companies with meaningful usage-based or hybrid pricing (Snowflake, Datadog, and MongoDB, for example, do not report ARR at all) are pushing the industry toward total revenue as the standard numerator. If your pricing model includes significant usage-based components, decide now which numerator you will use consistently, and disclose that choice whenever you share the metric externally.
How to interpret the number by stage
Context is everything with this metric. A $150K per FTE result means something different at $8M ARR than it does at $80M ARR.
Private SaaS revenue per employee rises steadily with scale, which reflects real operating leverage: fixed infrastructure, established sales motions, and a growing renewal base all get spread across more revenue without a proportional headcount increase.
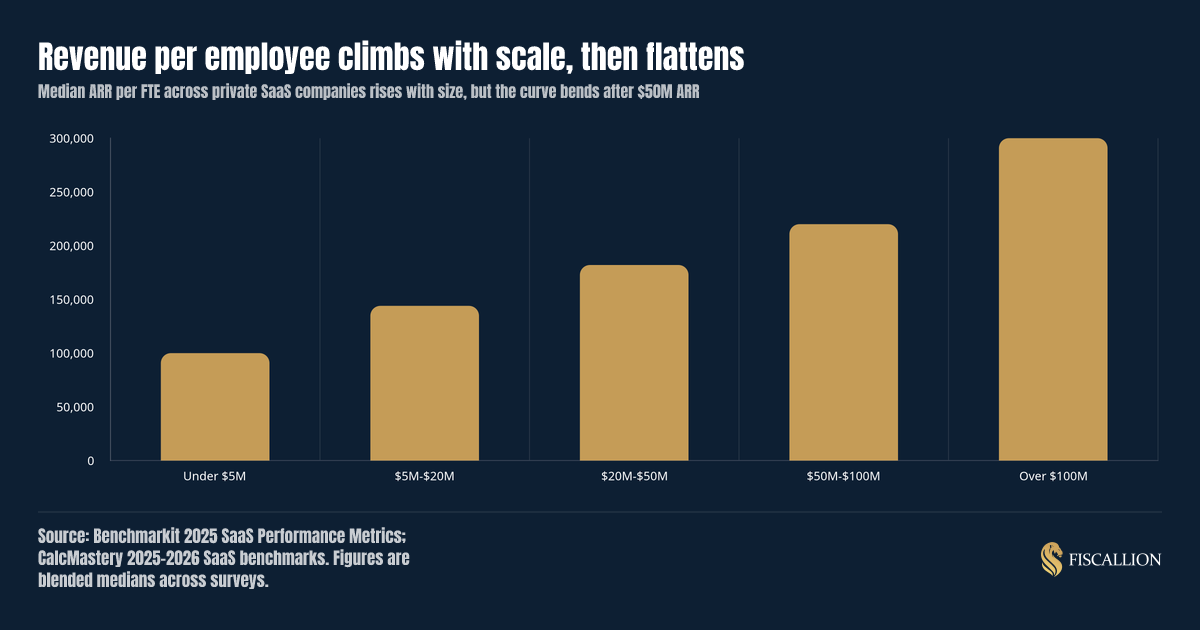
Sources: Benchmarkit's 2025 SaaS Performance Metrics report and CalcMastery's blended 2025-2026 benchmark set, both drawing on hundreds of private B2B SaaS companies.
Growth stage matters more than absolute size
The rate of improvement is not linear, and expecting it to be linear is where founders miscalibrate their own targets.
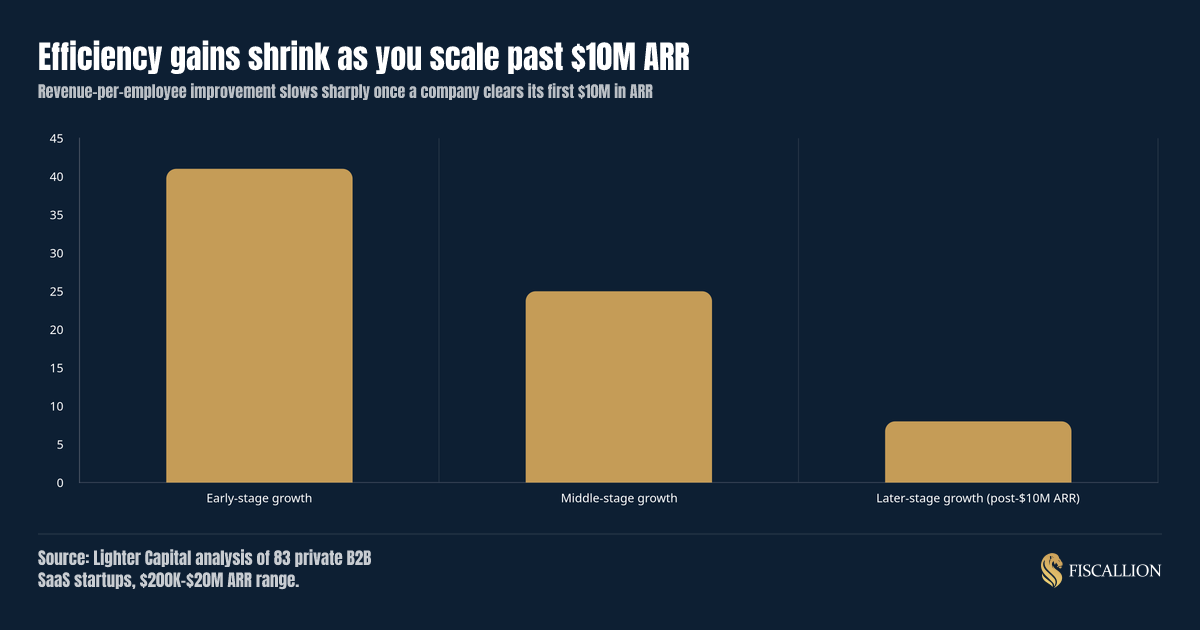
Lighter Capital's analysis of 83 private B2B SaaS startups found revenue per employee improved roughly 41% during early-stage growth, 25% during middle-stage growth, and only about 8% once a company cleared $10M ARR. If your board is expecting the same percentage gains at $30M ARR that you delivered between $2M and $6M ARR, that expectation is not grounded in how SaaS businesses actually scale. Past $10M ARR, the conversation should shift from "how fast is this improving" to "is this stable while growth holds."
Bootstrapped companies consistently out-earn equity-backed peers per head
SaaS Capital's 2025 survey is blunt on this point: bootstrapped companies show a higher median ARR per FTE than equity-backed companies at every size band. At $1M to $3M ARR, bootstrapped companies ran $110,000 per FTE versus $94,444 for equity-backed companies of the same size.
This is not an indictment of raising capital. Equity-backed companies are generally growing faster, and faster growth justifies getting ahead of headcount need. But if you have raised capital and your revenue per employee sits meaningfully below the bootstrapped benchmark for your size, that gap deserves a direct question in your next leadership meeting: is the extra spend buying you a growth rate that justifies it, or is it just buying headcount?
Public companies are still the efficiency ceiling, not the floor
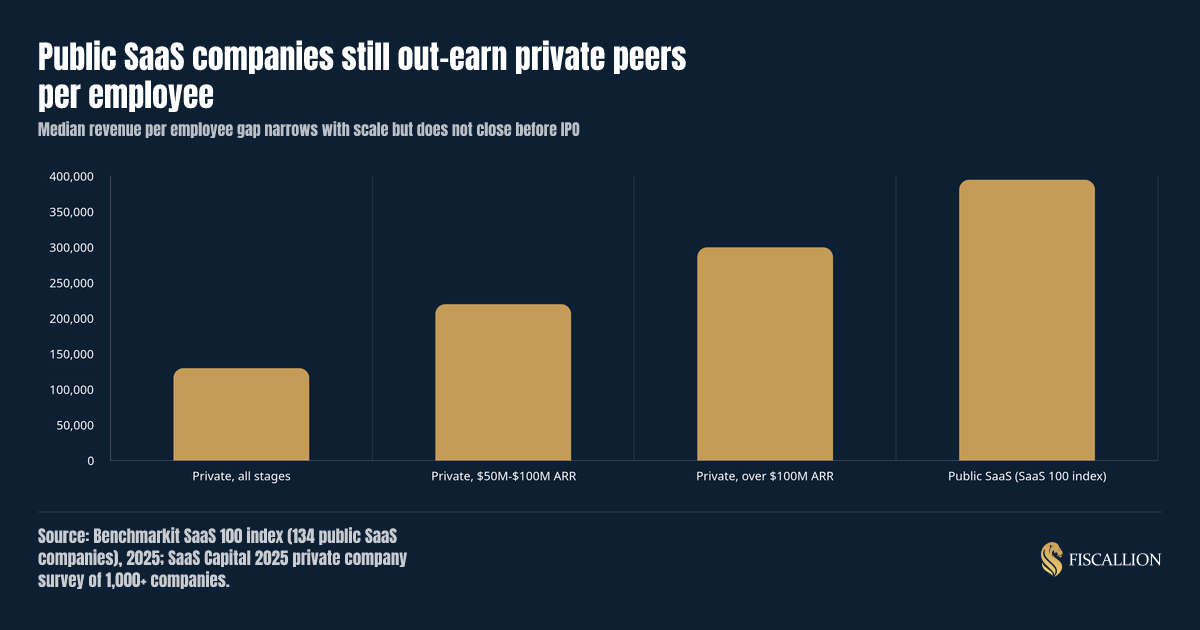
Public SaaS companies in the Benchmarkit SaaS 100 index run a median of roughly $395K in revenue per employee as of 2025, up from $327K in 2022. That gap between private and public benchmarks does not close cleanly with scale. Even private companies above $100M ARR sit meaningfully below the public median, which reflects the intense operational tightening that happens in the run-up to an IPO. Do not use the public benchmark as your near-term target if you are at $10M or $20M ARR. Use your stage-appropriate band, and treat the public number as the long-run ceiling.
AI-native companies have reset what "efficient" means, with a caveat
Some AI-native software companies are reporting revenue per employee figures in the seven figures, a scale traditional SaaS benchmarks never approached. That number deserves real caution before you compare yourself to it.
Much of the eye-popping AI-native figures come from annualizing a single month of fast-compounding run-rate revenue, not trailing twelve-month GAAP revenue. If your growth is compounding quickly, annualized run-rate math inflates the productivity figure well beyond what a steady-state number would show. Treat those headline figures as directional and expect the gap to compress as customer acquisition friction increases and enterprise procurement tightens around AI purchases. If you are running a traditional or AI-embedded SaaS business, your relevant comparison set is still the private and public SaaS benchmarks above, not the AI-native outliers.
What to do next with this number
Revenue per employee only earns its place in your reporting cadence if it changes a decision. Here is where it should show up.
- Before every significant hire, run the revenue-per-employee test alongside your existing headcount plan: does this role add revenue-generating capacity, or does it just add fixed cost against flat expected output? This is the same discipline covered in headcount planning for startups, where headcount per $1M ARR by function is the primary benchmark, and revenue per employee is the aggregate check on that plan.
- Every quarter, track the trend by function (sales, CS, engineering, G&A), not just the company-wide blend. A flat blended number can hide a sales org that is bloating while an engineering org is genuinely getting more efficient.
- In board decks, present revenue per employee next to your growth rate and your operating leverage trend, not as a standalone slide. A rising number paired with a healthy growth rate is a real signal. A rising number paired with slowing growth needs the trade-off spelled out explicitly, the way we frame it in operating leverage in SaaS: is fixed-cost G&A actually shrinking as a share of revenue, or is the ratio only improving because growth stalled.
- During fundraising prep, know your stage-appropriate benchmark cold. Investors will benchmark you against it whether or not you bring it up first.
- When margins feel tight, check whether your revenue-per-employee trend and your contribution margin trend are moving in the same direction. If contribution margin is healthy but revenue per employee is falling, the problem sits in overhead and G&A, not in the unit economics of the product itself.
Imposing structural guardrails on support roles keeps overhead lean while the revenue-producing engine scales.
Common mistakes and the correction for each
A practical cadence to install this quarter
Use this sequence to make revenue per employee a working part of your FP&A cadence rather than a slide you build once a quarter under time pressure.
- Lock your FTE counting rule. Document how you treat part-time staff, contractors, and offshore headcount. Apply it retroactively to your last four quarters so your trend line is real.
- Pick your numerator. ARR for subscription-led businesses; total revenue with a clear disclosure if usage-based pricing is material.
- Segment by function. Calculate revenue per FTE for sales and CS, engineering, and G&A separately, not just the company-wide blend.
- Benchmark against your ARR stage, not the public median and not AI-native outliers.
- Pair it with your headcount plan before every hiring decision above a defined dollar threshold (for example, any role over $120K fully loaded cost).
- Report the trend, not the snapshot, in every board deck, alongside growth rate and NRR so the number has context instead of standing alone.
This is the same kind of decision-grade structure we build into board reporting for Fiscallion clients: the metric is only useful once it is tied to an assumption you can defend and a decision you are actually about to make.
Beyond the boardroom: engineering true operating leverage
Revenue per employee is a fast, honest signal of whether your organization is scaling its output faster than its headcount, but only if you count the denominator consistently, benchmark against your actual stage, and read the trend alongside growth rate and operating leverage. A single flattering number in a board deck does not do that work for you.
If your last four quarters of hiring decisions were not run through a model like this, the number in your next board deck will raise a question you cannot answer cleanly. Audit your metrics definitions and forecasting model before that meeting, not after it.