

A 115% NRR looks strong in any board deck. But if the GRR sitting underneath it is 78%, the company is losing almost a quarter of its revenue base every year and covering the leak with expansion from the accounts that stay. That is not a retention success story. It is a structural problem with a good disguise.
Net revenue retention and gross revenue retention are the two metrics that, read together, give you the most honest picture of your existing-revenue foundation. Most founders track NRR. Fewer track GRR. Fewer still understand what the spread between them is actually telling them - and that gap is where costly decisions get made on the wrong signal.
This article covers both metrics in full: exact definitions, calculation formulas, 2026 benchmarks by segment and ARR stage, and the specific decisions you should be making with each number.
Key takeaways
- GRR measures retention only. It captures churn and downgrades, excludes all expansion, and cannot exceed 100%. It is your revenue retention floor.
- NRR measures retention plus growth. It includes expansion from upsells, cross-sells, seat additions, and usage growth. It can exceed 100%.
- The gap between NRR and GRR tells you how dependent you are on expansion to compensate for churn. A large gap is a structural warning.
- GRR below 80% indicates a fundamental retention problem that expansion cannot fix indefinitely.
- Benchmarks differ materially by segment. An SMB company at 97% NRR is at the median. An enterprise company at 97% NRR has a serious problem.
- Investors check GRR first, then NRR. GRR underwrites revenue durability. NRR signals expansion potential. You need both numbers ready.
What we'll cover
- What GRR and NRR each measure (and why the difference matters)
- The exact formulas with worked examples
- The mathematical relationship between GRR and NRR
- 2026 benchmarks by ACV segment and ARR stage
- What a good NRR looks like at your stage
- How investors use both metrics in diligence
- The decisions each metric should drive
- Common calculation errors and how to fix them
- How to act on the gap between the two numbers
GRR and NRR measure different problems
This is the core distinction that gets blurred most often:
Gross revenue retention (GRR) asks: of every dollar of recurring revenue you had at the start of the period, how many did you keep?
It counts only the revenue that survived - what was not lost to churn or downgrades. Expansion is deliberately excluded. GRR can never exceed 100% because you cannot retain more revenue than you started with. It is a ceiling metric for a floor problem.
Net revenue retention (NRR) asks: of every dollar of recurring revenue you had at the start of the period, how much do those same customers now represent - including everything they bought since?
Because expansion revenue is added back in, NRR can exceed 100%. A 120% NRR means your existing customer cohort grew its revenue by 20% over the measurement period. That is the compounding flywheel most SaaS founders are optimizing toward.
The practical way to hold the distinction: GRR tells you whether you have a leaky bucket. NRR tells you whether you can fill the bucket faster than it leaks. Both questions matter. Answering only one of them leaves you with an incomplete diagnosis.
Stripe's breakdown of NRR vs. GRR makes the same point: neither metric is superior in isolation — they answer different questions and need to be read together to assess the overall health of your revenue.
The exact formulas
Both metrics measure the same starting cohort over the same period. The measurement discipline is identical; only the inputs to the numerator differ.
GRR formula
GRR = (Starting MRR - Churned MRR - Contraction MRR) / Starting MRR × 100
- Starting MRR: recurring revenue from the defined customer cohort at period start
- Churned MRR: revenue from customers who cancelled entirely during the period
- Contraction MRR: revenue lost from customers who downgraded (did not cancel, just reduced spend)
- Expansion MRR is excluded entirely
GRR will always fall between 0% and 100%.
NRR formula
NRR = (Starting MRR + Expansion MRR - Contraction MRR - Churned MRR) / Starting MRR × 100
- Expansion MRR: upsells, cross-sells, seat additions, and usage overages from existing customers only
- New logos are never included in either formula - both are cohort metrics
NRR has no ceiling.
Worked example: the same company, both formulas
Take a company with $200,000 in MRR from 80 existing customers at the start of the period.
During the measurement period:
- 4 customers cancel: $10,000 churned MRR
- 3 customers downgrade: $6,000 contraction MRR
- 14 customers upgrade or add seats: $28,000 expansion MRR
GRR calculation:
($200,000 - $10,000 - $6,000) / $200,000 × 100 = 92%
NRR calculation:
($200,000 + $28,000 - $6,000 - $10,000) / $200,000 × 100 = 106%
Same company, same period. GRR tells you that 92% of the base revenue survived. NRR tells you that expansion pushed the net outcome to 106% growth. Both are correct. Neither one alone gives you the full picture.
Now consider a second company with the same 92% GRR but only $8,000 in expansion MRR instead of $28,000:
NRR for company 2:
($200,000 + $8,000 - $6,000 - $10,000) / $200,000 × 100 = 96%
Same GRR. NRR of 96% instead of 106%. These are not the same business. The first has an expansion motion that generates enough growth to materially outpace the base churn. The second does not. The GRR number alone told you nothing about which one you are looking at.
The mathematical relationship between GRR and NRR
Understanding the mechanics simplifies a lot of interpretation:
NRR = GRR + (Expansion MRR / Starting MRR × 100)
If GRR is 88% and NRR is 108%, the expansion rate on the starting base is approximately 20 percentage points.
This relationship makes the gap between NRR and GRR directly readable as a measure of expansion dependency. The larger the gap, the more reliant the business is on expansion revenue to overcome base churn.
According to Optifai's 2026 benchmark study of 939 B2B SaaS companies, the median expansion gap across all segments is 12 percentage points — widening to 21 points at enterprise ACV, where seat expansion and module cross-sells create the most headroom.
| GRR | NRR | Expansion rate on base | What it signals |
|---|---|---|---|
| 95% | 110% | ~15% | Healthy: strong retention with solid expansion on top |
| 90% | 108% | ~18% | Acceptable: moderate churn offset by a real expansion motion |
| 85% | 108% | ~23% | Caution: expansion is compensating for significant base leakage |
| 78% | 110% | ~32% | Warning: structural retention failure masked by heavy expansion |
| 92% | 95% | ~3% | Expansion-constrained: good base retention with minimal growth |
The last row is frequently misread as a problem. A company at 92% GRR and 95% NRR is actually retaining well - it just lacks an expansion motion. The prescription is adding an upsell path, not fixing churn. A company at 78% GRR and 110% NRR has the opposite problem and requires a completely different response.
2026 NRR and GRR benchmarks by customer segment
The most reliable way to benchmark NRR and GRR is by ACV (average contract value). Segment determines expansion ceiling, support intensity, contract type, and churn drivers. Comparing against the wrong segment is one of the most common causes of misplaced confidence or unnecessary alarm in board discussions.
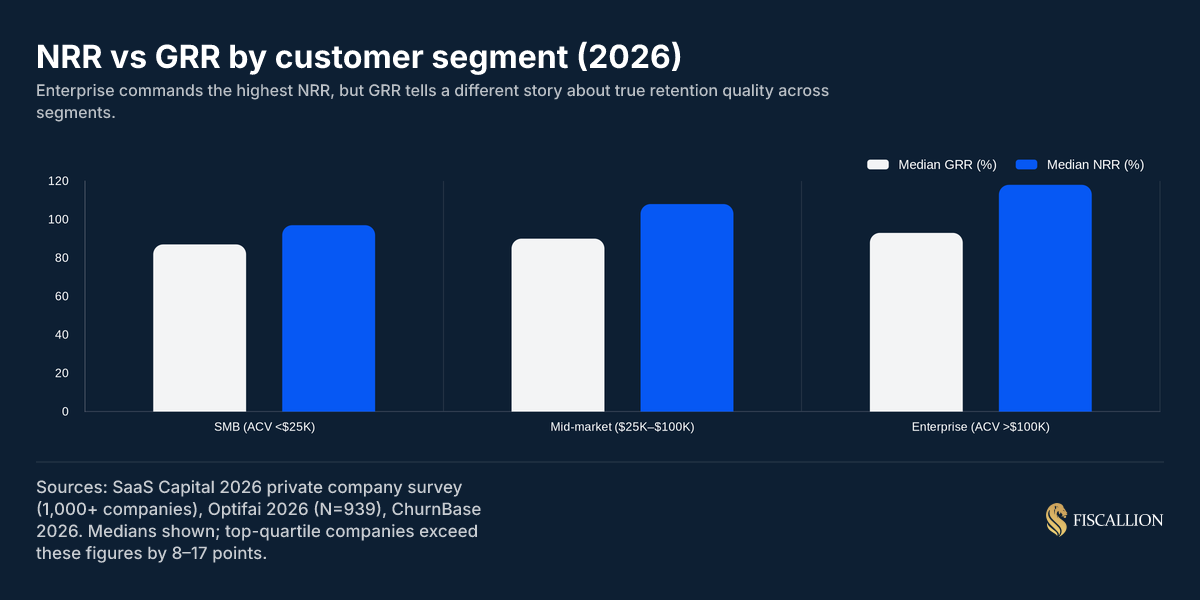
The 2026 median benchmarks across private B2B SaaS, sourced from SaaS Capital's 2025 annual survey of 1,000+ private companies, Optifai 2026 (N=939), and ChurnBase 2026:
| Segment | Median GRR | Median NRR | Top-quartile NRR |
|---|---|---|---|
| SMB (ACV < $25K) | 82–87% | 97% | ~108% |
| Mid-market (ACV $25K–$100K) | 88–90% | 108% | ~120% |
| Enterprise (ACV > $100K) | 92–95% | 118% | ~135% |
Why the enterprise segment commands higher NRR
Larger contracts come with longer sales cycles, scoping conversations, dedicated implementation, and ongoing account management. The product relationship is stickier because the switching cost is real. More importantly, enterprise accounts have genuine expansion headroom - more seats, more modules, more geographies. The three primary expansion vectors (seats, modules, and usage) all scale with company size.
If you sell into enterprise and your NRR is below 110%, that gap deserves a specific diagnosis: is it a pricing structure problem (no clear upsell path), a product depth problem (nothing worth expanding into), or a customer success capacity constraint?
The structural reality of SMB retention
SMB customers have fewer seats to add, smaller budgets, and fewer modules worth expanding into. Getting above 110% NRR in an SMB motion typically requires some form of usage-based pricing that grows naturally with customer activity - not just with headcount.
An SMB-focused company at 97% NRR is sitting at the median for its segment. That is not a warning sign. But if GRR is below 82% while NRR holds at 97%, the NRR is hiding real churn that a thin expansion motion is just barely covering.
GRR below 80% regardless of segment
This is the threshold that matters most in practice. A GRR below 80% means you are losing more than 20% of your revenue base annually to churn and downgrades, before expansion does any work. At that level, expansion revenue is doing damage control, not growth work. ChurnBase's 2026 benchmark synthesis — aggregating data from KeyBanc Capital Markets, ChartMogul, and SaaS Capital — confirms that GRR below 80% is a structural warning signal at every ARR stage. Investors doing serious diligence will find this number and will ask what is causing the leakage. It is better to have a clear answer before the diligence conversation starts.
NRR benchmarks by ARR stage
Beyond ACV, ARR stage changes what investors expect and what your NRR number signals about your business trajectory.
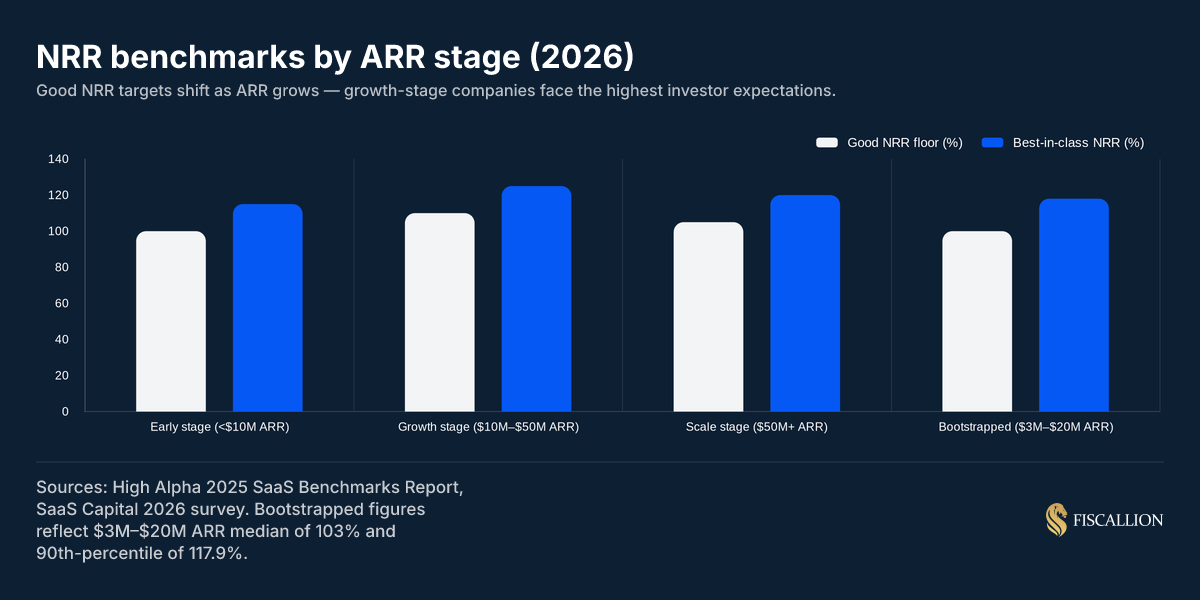
| ARR stage | Good NRR | Best-in-class NRR |
|---|---|---|
| Early stage (< $10M) | 100–110% | 115%+ |
| Growth stage ($10M–$50M) | 110–120% | 125%+ |
| Scale stage ($50M+) | 105–115% | 120%+ |
| Bootstrapped ($3M–$20M) | ~103% (median) | ~118% (90th percentile) |
The growth-stage band ($10M–$50M ARR) faces the most pressure. Investors at this stage have enough cohort history to do rigorous analysis. They expect clean monthly cohort waterfalls, segmented expansion breakdowns, and a clear story about what is driving the NRR number. A headline percentage without the cohort decomposition is not sufficient.
The scale-stage dip is counterintuitive but real. Companies at $50M+ ARR often see NRR compression because their core accounts are deeply penetrated, their customer mix has broadened to segments with lower expansion potential, and natural growth from seats or usage has moderated. Strong scale-stage companies manage this through new product lines, international expansion, or usage-based components layered onto seat-based pricing.
What a good NRR looks like at your stage
The honest answer to "what is a good NRR?" is: it depends on ACV, ARR stage, pricing model, and whether you have bootstrapped or raised venture capital. For a full breakdown of how to interpret these numbers in context, see our net revenue retention benchmark for SaaS.
Here is how to read the answer for your specific situation:
If your ACV is below $25K:
- Median NRR is 97%. Being above 103% puts you in the top quartile for your cohort.
- GRR above 85% is solid. Top quartile clears 90%.
- NRR above 105% typically requires usage-based pricing to get there sustainably.
If your ACV is $25K–$100K:
- Median NRR is 108%. Good is 110–115%. Top quartile is 120%+.
- GRR should be above 88%. Below 85% signals a product stickiness or customer success problem.
If your ACV is above $100K:
- Median NRR is 118%. Good is 115–125%. Top performers clear 130%.
- GRR should be above 92%. Below 90% at enterprise ACV warrants a structured diagnosis.
Bootstrapped companies:
SaaS Capital's 2025 private company survey of bootstrapped companies at $3M–$20M ARR shows a median NRR of 103% with top performers at the 90th percentile reaching 117.9%. Median GRR is 91%. These figures reflect the structural discipline of revenue-funded growth - not the expansion-heavy dynamics that venture-backed models sometimes create artificially.
The cleaner benchmark for a founder who is not comparing to venture-backed peers: if your NRR is above 110% and your GRR is above 88%, you are in the top half of your cohort by any credible measure.
How investors use GRR and NRR in diligence
The investor sequence is consistent: they check GRR first to underwrite revenue durability, then NRR to assess expansion potential.
GRR tells an investor whether your product earns its keep once the deal closes. It answers: if this company stopped trying to expand accounts tomorrow, how much of the base revenue would survive? That is the durability test.
NRR tells them whether the existing customer base is a growth engine or a maintenance burden. Companies with NRR above 100% need less new ARR each quarter to hit any given growth target, because the base is compounding on its own.
The valuation connection is direct. Per Software Equity Group's analysis of NRR and SaaS valuation, companies with NRR above 120% trade at a 63% premium over the market median — a relationship that has persisted even as the overall SaaS multiple compressed:
- NRR above 120% commands median EV/revenue multiples of approximately 11.7x (Q4 2024 analysis)
- The SaaS index median with median NRR of ~101% runs around 5.6x
- That is a roughly 109% valuation premium for companies that compound their existing base
A 10-point improvement in NRR - sustained over two to three quarters before a fundraise - can translate to a 20–30% increase in valuation, often tens of millions of dollars at growth stage. That is not a retention metric. That is a capital allocation decision.
What experienced investors will specifically ask during diligence:
- What is your GRR alongside NRR? (They will distrust NRR without GRR.)
- What is driving expansion - seat growth, module upsells, or usage? (Each implies a different durability.)
- How is NRR distributed across your top accounts? Is it concentrated in two or three customers?
- What is the trailing 12-month cohort waterfall for each customer vintage?
- How do you define your calculation methodology? (Definition drift is a common diligence friction point.)
If you cannot answer questions 3 and 4 cleanly, the headline NRR number will not hold up in a serious diligence conversation.
The decisions NRR and GRR should each drive
Both metrics are only useful if they change what you do. Here is the operational mapping:
When GRR is the primary signal
If GRR is below 80%:
- Stop treating expansion as the fix. The base retention problem is structural.
- Run a churn root-cause analysis across three variables: onboarding failure (did customers activate core features?), value gap at renewal (can customers articulate ROI?), and pricing misalignment (were initial discounts too deep?).
- Each driver requires a different response. Onboarding failure is a product and CS process problem — McKinsey's research on customer success in SaaS found that top-quartile revenue growth companies materially outperformed median peers specifically on retention, not acquisition. Value gap is a reporting and communication problem. Pricing misalignment is a sales qualification problem.
If GRR is declining quarter-over-quarter:
- Decompose by customer segment, acquisition cohort, and channel. Aggregate GRR decline almost always concentrates in a specific population.
- Do not respond with a blanket CS initiative until you know which population is churning and why.
If GRR is strong (above 90%) but NRR is flat:
- The retention foundation is solid. The constraint is expansion, not churn.
- The question to answer: is there a real upsell path in your packaging, or are you expecting expansion to happen without a structural mechanism?
When NRR is the primary signal
If NRR is above 100% but GRR is below 85%:
- Run the cohort concentration analysis. Which accounts are driving the expansion? How dependent is the NRR on a small number of large customers?
- Model what happens to NRR if the top two expansion contributors stop growing. That is your realistic floor.
If NRR is flat in the 100–103% range for two or more quarters:
- This is not a "steady state" situation at growth stage. It signals either expansion constraints or churn growth that expansion is just barely covering.
- Decompose: what is the churn rate? What is the expansion rate? Are both moving in the same direction?
If NRR is improving but the improvement is driven by a single customer:
- Flag it in your board deck as a contributor, not as a trend.
- Report NRR excluding the top expansion contributor as a second data point so the underlying trend is visible.
Common calculation errors that distort both metrics
These errors consistently appear in board decks at growth-stage SaaS companies. Most make NRR look better than it actually is.
Including new logos in the cohort
Both GRR and NRR are cohort metrics. A customer who signed in month two of your measurement window is not in the month-one cohort and must not be included. Including them inflates both the numerator and denominator in ways that mask real cohort performance.
Fix: Define the cohort at period start. Every customer in the cohort must have been active at time zero.
Forgetting contraction MRR
Companies that only subtract churned MRR and forget to subtract contraction MRR (partial downgrades) overstate NRR by 3–8 percentage points. Every revenue change in the cohort counts - cancellations and partial reductions.
Fix: Track contraction MRR as a separate line item. It is distinct from churn MRR.
Using monthly data for annual benchmarks
Most published NRR benchmarks are annual figures. Monthly calculations are valid for operating reviews but show significantly more volatility - a single large renewal or cancellation can produce dramatic swings. Comparing your monthly NRR to an annual benchmark number will almost always produce a misleading comparison.
Fix: Use trailing 12-month NRR as your primary benchmark metric. Track monthly NRR separately as an early-warning indicator.
Letting the definition drift between periods
NRR means different things to different organizations: some include reactivations, some exclude downgrades, some cap the cohort's MRR at starting MRR (which is GRR by another name). If your definition changes between periods, your trend data is meaningless. As SubJolt's 2026 NRR benchmark reference notes, MongoDB even calls its version "net ARR expansion rate" — functionally the same metric, different label — a reminder that definition alignment matters before any cross-company comparison.
Fix: Write down your exact calculation methodology and own it explicitly. When presenting to investors, state the methodology alongside the number. Definition ambiguity in NRR is one of the most common sources of friction in diligence conversations.
Calculating NRR on a blended revenue base
If your company has professional services or implementation revenue alongside subscription revenue, including those in the NRR base distorts comparison to subscription-only benchmarks. Services revenue does not renew and expand the same way MRR does.
Fix: Calculate NRR and GRR on subscription MRR only, then disclose the revenue mix separately.
How to act on the gap between NRR and GRR
The spread between NRR and GRR is the most actionable single number in your retention model. Here is the decision logic:
Small gap (NRR is 5–8 points above GRR):
Your expansion motion is modest relative to your base retention. If GRR is above 90%, this is a healthy business with limited expansion infrastructure. The right move is not to fix churn (which is already low) but to build an explicit expansion path - tiered packaging, seat-based growth prompts, or a usage-based component.
Medium gap (NRR is 10–18 points above GRR):
This is the standard profile for a mid-market SaaS company with a functioning expansion motion. Review the expansion sources: is it coming from a broad set of accounts or a concentrated few? If concentrated, the NRR durability is lower than the headline suggests.
Large gap (NRR is 20+ points above GRR):
This warrants a focused analysis. A 20-point gap means expansion is doing very heavy lifting. The business is fundamentally reliant on accounts that stay continuing to expand. Run the cohort concentration check and model what happens when the top expansion accounts plateau.
Inverted or near-zero gap (NRR is at or below GRR):
This should not be mathematically possible in normal operations - it would imply near-zero expansion. If you are seeing this, the most common cause is a calculation error in the expansion or contraction categories. Check the inputs before drawing any operational conclusions.
What to put in your board deck and investor materials
Board decks should show GRR and NRR side by side on a single slide. Showing only NRR is increasingly read by sophisticated investors as either ignorance of the GRR number or a choice to obscure a weak floor.
The minimum viable retention slide for a growth-stage board deck:
- Trailing 12-month NRR - headline number with period-over-period comparison
- Trailing 12-month GRR - alongside NRR so the spread is immediately visible
- NRR decomposition - expansion rate, contraction rate, churn rate as the three components
- Cohort concentration note - what percentage of expansion is concentrated in the top three accounts
- Segment breakdown - NRR by ACV band or customer segment if you serve multiple segments
This is not about adding complexity to your board pack. It is about controlling the narrative before someone else decomposes it for you. Investors who do rigorous diligence will produce all five of these numbers from your data. Walking them through it yourself puts you in the driver's seat.
At Fiscallion, the cohort-level NRR and GRR decomposition is one of the first frameworks we build with founders preparing for a Series A, B, or C process - because the headline number alone is almost always the thing that creates the most confusion in a term sheet conversation.
Practical checklist: auditing your NRR and GRR
Before your next board meeting or investor conversation, work through this:
- Confirm cohort definition. Are new logos excluded from both GRR and NRR calculations?
- Separate churn MRR from contraction MRR. Both are subtracted. Neither should be missing.
- Verify expansion inputs. Is expansion limited to existing customers, or are any new-logo upsells included?
- Calculate trailing 12-month figures. Not just the most recent monthly snapshot.
- Run the top-account concentration check. What is NRR excluding your top two expansion contributors?
- Segment NRR and GRR by ACV band. A blended number that combines SMB and enterprise customers tells you almost nothing.
- Write down your methodology. One paragraph, shared with anyone who calculates or reports these numbers.
- Check GRR against the 80% floor. If it is below 80%, expansion-focused initiatives should wait until churn is diagnosed.
Conclusion
NRR and GRR are not interchangeable. They answer different questions about your revenue base, and the decision each one drives is distinct.
GRR tells you whether your retention foundation is solid. NRR tells you whether the customer base is growing on its own. Read separately, each can mislead. Read together, they give you the most accurate diagnostic available for the health of your existing revenue.
The 2026 benchmarks make clear that medians differ significantly by segment - 97% NRR is the median for SMB, 118% is the median for enterprise. The gap between GRR and NRR exposes expansion dependency. And GRR below 80%, regardless of segment, indicates a structural retention problem that expansion cannot sustain indefinitely.
For founders at the $5M–$50M ARR stage, the practical priority is this: get both numbers calculated correctly, segmented by ACV band, and decomposed into their three components before any board or investor conversation. A headline NRR without GRR alongside it is a half-answer that creates more questions than it resolves.
If you want a second set of eyes on your retention model - the cohort framework, the calculation methodology, and how to present both metrics in your next board deck - that is exactly the kind of working session we run at Fiscallion.
Frequently asked questions
What is the difference between GRR and NRR in SaaS?
GRR (gross revenue retention) measures how much recurring revenue you keep from existing customers after churn and downgrades, excluding expansion. It is capped at 100%. NRR (net revenue retention) adds expansion revenue back in - upsells, cross-sells, seat additions, usage growth - so it can exceed 100%. GRR tells you whether your retention floor is solid. NRR tells you whether your existing customer base is growing. The gap between them reveals how dependent your revenue growth is on expansion compensating for base churn.
What is the difference between GRR and NRR?
The formulas make the distinction concrete. GRR = (Starting MRR - Churned MRR - Contraction MRR) / Starting MRR × 100. NRR = (Starting MRR + Expansion MRR - Contraction MRR - Churned MRR) / Starting MRR × 100. The only structural difference is that NRR adds expansion MRR to the numerator. Because expansion can outweigh churn and contraction, NRR can exceed 100%. Because GRR excludes expansion entirely, it can never exceed 100%. Read together, a large spread between NRR and GRR signals that expansion is doing heavy lifting over a leaky base.
What is the relationship between NRR and GRR?
The mathematical relationship is: NRR = GRR + (Expansion MRR / Starting MRR × 100). The spread between NRR and GRR directly equals the expansion rate on your starting revenue base. A GRR of 88% and an NRR of 108% means expansion is adding 20 points to the starting MRR. Both metrics measure the same customer cohort over the same period - the distinction is whether expansion is included in the numerator. The practical implication: a high NRR with a low GRR means you have a retention problem that expansion is temporarily masking. When expansion moderates, the leakage shows through.
What is a good NRR for SaaS?
It depends on ACV, ARR stage, and pricing model. The 2026 medians from SaaS Capital's survey of 1,000+ private companies: SMB (ACV below $25K) companies have a median NRR of 97% - top quartile is 108%+. Mid-market (ACV $25K–$100K) has a median NRR of 108% - top quartile is 120%+. Enterprise (ACV above $100K) has a median NRR of 118% - top quartile clears 135%. By ARR stage: early stage (sub-$10M ARR) should target 100–110%; growth stage ($10M–$50M ARR) should target 110–120% with best-in-class above 125%; scale stage ($50M+) targets 105–115%. Bootstrapped companies at $3M–$20M ARR have a 2026 median NRR of 103% with 90th-percentile performers at 117.9%.
