
Most SaaS companies at $10M ARR are cash-flow negative. Most of them expect to stay that way for another 12-18 months. Very few of them can say exactly when or why that will change.
Operating leverage is the answer to that question. Not a vague answer - a measurable one. It is the mechanism that explains how a SaaS business goes from spending $1.40 for every dollar of revenue to spending $0.85, then $0.70, then generating real operating income. Revenue grows; the cost structure does not keep pace. The gap between those two lines is operating leverage.
If you can not articulate your current operating leverage, track it quarter over quarter, and connect it to a forward model, you are flying without instruments on the most important flight path in your company's trajectory.
Key takeaways
- Operating leverage is created when revenue grows faster than operating expenses; it’s about scaling sub-linearly, not cutting absolute costs.
- The most powerful structural driver is high NRR ($115\%+$), which allows you to expand ARR without proportional sales and marketing spend.
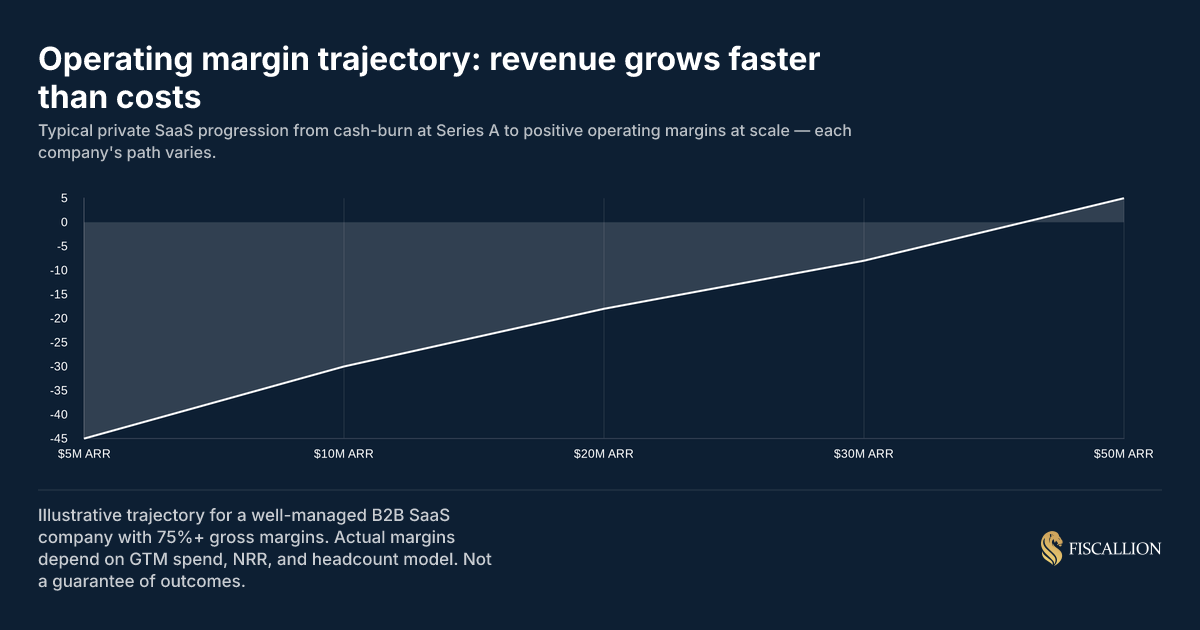
- At $\$10\text{–}20\text{M}$ ARR, a typical target is $-20\%$ to $-10\%$ operating margin. Positive margins at $\$30\text{–}50\text{M}$ ARR signal genuine leverage.
- The rule of 40 is the clearest single-number summary of this growth-profitability trade-off, though the trend matters more than a single-period score.
What operating leverage actually means in a SaaS P&L
Operating leverage is not a single line item. It is a relationship between two sections of your P&L.
The top half is gross profit: revenue minus cost of goods sold (COGS). COGS in SaaS includes hosting and infrastructure, customer success, implementation, and technical support. As revenue scales, COGS grows at roughly the same rate - you spend approximately the same cents-per-dollar of revenue to deliver the product.
The bottom half is operating expenses: sales and marketing (S&M), R&D, and G&A. These costs behave differently. In theory, they are more fixed - or at least semi-fixed. An engineering team can support 2x the customer base without doubling. A finance function does not need to triple headcount to handle tripled revenue. The same brand compounds into inbound pipeline without a proportional ad spend increase.
Operating leverage is created when gross profit increases while operating expenses grow more slowly. The gap between gross profit growth and OpEx growth is what falls to the operating income line.
Here is the simple way to see it in your P&L: if your revenue grows 30% year-over-year and your total OpEx grows only 15%, you have positive operating leverage. If OpEx grows 35% while revenue grows 30%, you are moving in the wrong direction - and no dashboard will show you that unless you are explicitly tracking the ratio.
Why this matters at $5-50M ARR
At this stage, most founders are managing cash burn and growth simultaneously. The default is to assume profitability will come "at scale" - but scale is not a destination, it is a trajectory. The question is whether your cost structure is designed to generate leverage as revenue increases, or whether your operating expenses will simply keep pace with (or outrun) revenue growth.
The companies that build operating leverage intentionally - by structuring headcount decisions, GTM spend, and gross margin architecture in advance - arrive at the $30-50M ARR mark with meaningfully better unit economics than peers who assumed it would happen automatically. This is precisely why FP&A for startups at this stage needs a decision-grade model, not just a reporting layer.
The two operating leverage formulas worth using
There is no single universally agreed-upon formula. Use both, understand what each measures.
Formula 1: the classical degree of operating leverage
Degree of Operating Leverage (DOL) = % Change in Operating Income ÷ % Change in Revenue
A DOL above 1.0 means operating income is growing faster than revenue. A DOL of 2.0 means for every 1% revenue increase, operating income increases 2%. This is the textbook definition.
Limitation: At early-stage SaaS, operating income is negative. A company going from -$2M to -$1M operating income while growing revenue 30% will produce a DOL that is mathematically positive but hard to interpret intuitively. Use this formula when you are approaching or above breakeven.
Formula 2: gross-profit-to-EBITDA flow-through
Operating Leverage = Change in EBITDA ÷ Change in Gross Profit
This is more actionable for growth-stage SaaS. It answers: for every dollar of gross profit we added, how many cents made it to EBITDA?
A ratio of 0.25 means you kept 25 cents of every new gross profit dollar. A ratio of 0.10 means 90 cents was absorbed by OpEx growth. A ratio of 0.00 means EBITDA is flat even as gross profit expanded - you are on a treadmill.
The maximum positive value is 1.0 (OpEx held flat). Anything above 0.20-0.25 on a consistent basis signals that real leverage is accumulating.
Measure this quarterly, not monthly. Monthly OpEx fluctuates with hiring timing, marketing campaigns, and one-time costs. Quarterly smooths the noise.
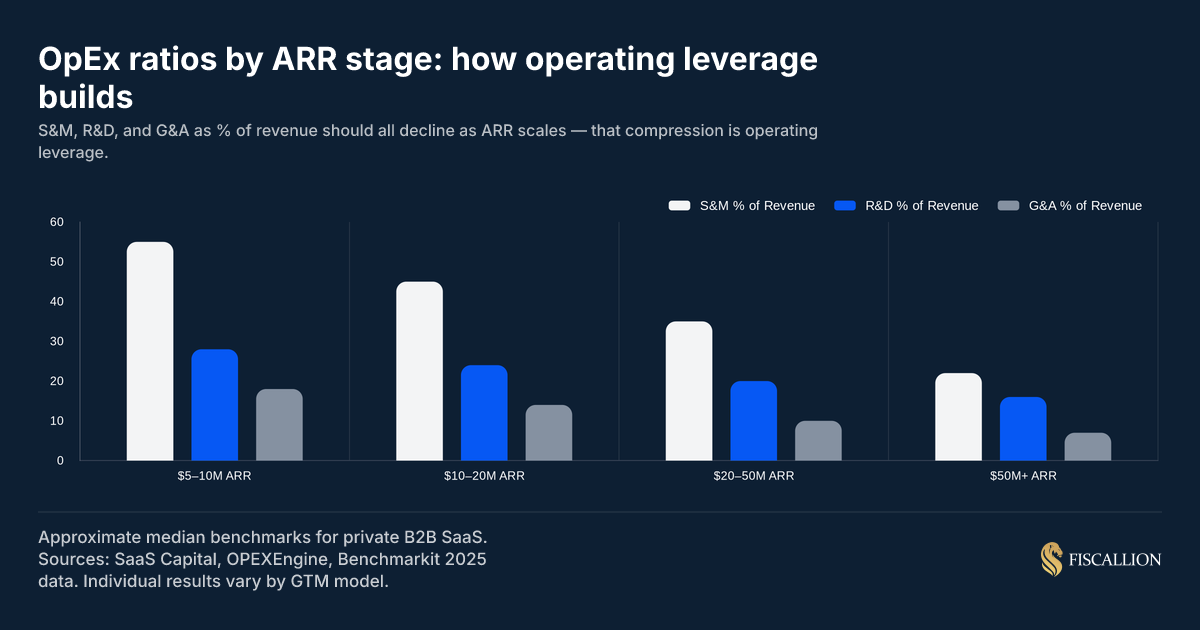
The three OpEx ratios that tell the real story
The most practical way to track operating leverage at $5-50M ARR is not through a single leverage score - it is through three ratios measured as a percentage of revenue, tracked over time.
All three should be declining as revenue scales. If they are not declining, you are not building leverage - you are treading water.
S&M as a % of revenue
This is the most visible signal. High-growth SaaS companies at Series A invest 50-65% of revenue in S&M. That is not a problem - it is a deliberate bet on growth. According to Bessemer Venture Partners' Scaling to $100M benchmarks, S&M expense represents over 50% of revenue even at maturity for most cloud companies - the test is whether that ratio is compressing.
The leverage test is whether that ratio is compressing over time, even as absolute S&M spend increases. A company spending $5.5M on S&M at $10M ARR (55%) that grows to spending $8M on S&M at $20M ARR (40%) has built meaningful S&M leverage - $2.5M more absolute spend, but 15 percentage points of efficiency gain.
The forces that compress this ratio:
- High NRR: expansion from existing customers requires near-zero incremental S&M
- Brand compounding: inbound pipeline replaces expensive outbound over time
- Sales productivity improvement: the same AE headcount closes more ARR as ICP sharpens
R&D as a % of revenue
R&D leverage is subtler. Unlike S&M, R&D does not need to fall dramatically - it needs to grow more slowly than revenue. A company that holds R&D at 20% of revenue as ARR scales from $10M to $40M has generated real R&D leverage in absolute terms.
Bessemer's data shows R&D averaging 35% of revenue at $100M+ ARR for high-performing cloud companies - a significant compression from the early years where it can exceed 90% of revenue. Watch for R&D ratios falling below 12-15% of revenue. That can indicate product underinvestment - a short-term margin improvement that weakens NRR and competitive position over the following 12-18 months.
G&A as a % of revenue
G&A is the most tractable leverage source because it is largely fixed: finance, legal, HR, and executive functions do not need to grow linearly with revenue. Target G&A at 8-12% of revenue at the $5-20M ARR range, declining toward 6-8% at scale.
G&A above 15% of revenue at $10M+ ARR is a signal worth investigating. It typically points to either over-staffed overhead functions, expensive outsourced services that should be brought in-house, or accounting and compliance costs that have not been restructured since an earlier stage. OpenView's 2023 SaaS Benchmarks Survey found that more than 27% of SaaS companies don't track their back-office costs - which means they have no visibility into whether G&A is compressing or expanding as they scale.
Operating margin benchmarks by ARR stage
Operating margin is the output of operating leverage. It is what you have left after gross profit covers all OpEx. Here is how it typically looks across private B2B SaaS:
These are approximate ranges for private B2B SaaS with 70-80% gross margins and enterprise or mid-market GTM. Product-led SaaS companies with lower CAC often show better margins earlier. High-touch, professional-services-heavy models will compress margins further than these ranges suggest.
What is a good operating margin for SaaS?
There is no single "good" operating margin - context defines it. The relevant question is: is your operating margin improving over time, and is the rate of improvement consistent with your gross margin structure and GTM model?
For investors evaluating Series B and C rounds, the expectation is not necessarily positive operating income - it is a credible, model-supported trajectory toward it. A company at $20M ARR with -15% operating margin and a clear path to breakeven at $35M ARR is in a stronger position than a company at $25M ARR with -8% operating margin but flat improvement over six quarters.
A 20% operating margin is an excellent outcome for a SaaS company at scale. At the $30-50M ARR range, it is a top-decile result. At $50M+ with 75%+ gross margins, it is achievable but not typical. Hitting 20% operating margin typically requires S&M below 30% of revenue, R&D at 15-18%, and G&A at 6-8% - a cost structure that only compounds through several years of deliberate leverage-building.
NRR is the structural lever most companies underestimate
Net revenue retention (NRR) is the most powerful and most underutilized source of operating leverage in SaaS.
Here is the math. A company with $20M ARR and 115% NRR grows $3M of ARR from its existing base next year - without spending a dollar of incremental S&M. If their target is 30% total growth ($6M of net new ARR), they only need $3M from new logos. That means new logo S&M only needs to fund half the growth target.
Compare that to a company with 90% NRR at the same $20M ARR: they lose $2M of ARR from churn and contraction before the year begins. To hit 30% growth they need $8M from new logos - nearly 2.7x the S&M spend for the same headline growth rate.
The S&M-as-a-percent-of-revenue ratio for these two companies diverges dramatically, even with identical top-line growth. That divergence is entirely driven by NRR, and it compounds over time.
McKinsey's analysis of top-performing SaaS companies found that those with NRR of 120%+ carry a median EV/revenue multiple of 21x, versus 9x for companies below that mark - not because investors pay a premium for retention as a metric, but because high NRR is a direct proxy for S&M efficiency and operating leverage.
What this means for the $5-50M ARR stage: every point of NRR above 100% is structural operating leverage. It is not a retention metric - it is a cost-efficiency metric. If your NRR is 95%, you are paying a silent S&M tax to stay flat. If it is 115%, your existing customer base is your cheapest growth channel. The mechanics of how NRR compounds into SaaS unit economics - particularly LTV and CAC payback - are worth running through your model explicitly before setting next year's S&M budget.
The NRR leverage ranges that matter
How to interpret your current leverage position
Before you can improve operating leverage, you need to accurately diagnose where you are.
Run this four-step check quarterly:
Step 1. Calculate gross-to-EBITDA flow-through
Take last quarter's gross profit change year-over-year. Divide the EBITDA change by the gross profit change. Anything above 0.20 is moving in the right direction. Below 0.10 is a warning sign that OpEx is consuming almost all gross profit growth.
Step 2. Plot all three OpEx ratios over 6-8 quarters
S&M, R&D, and G&A as a percent of revenue, quarterly. Are all three declining? If S&M is flat or rising while R&D and G&A are compressing, your GTM spend is not becoming more efficient - which means growth depends on continued heavy investment rather than compounding.
According to Aleksandar Stojanovic, CEO & Founder at Fiscallion, when these ratios flatten out at this stage, it is rarely a single line item problem. "The most common hidden cost is a CAC that's quietly rising because the efficient acquisition channel saturated and the company backfilled with a more expensive one without noticing the blended shift," Stojanovic explains. He notes that this ratio flattening is typically a productivity decay that the aggregate ratio is averaging over, meaning founders must look straight to per-unit metrics like channel-specific CAC and G&A headcount growth against revenue growth to find the leak.
Step 3. Decompose S&M into acquisition vs. retention
A blended S&M ratio obscures a critical distinction. If most of your S&M is acquisition-focused and NRR is below 105%, you have an expansion revenue problem disguised as a marketing expense problem. Understanding your CAC payback period by channel - not as a blended company-wide average - is what turns this diagnosis into an actionable number.
Step 4. Project the inflection point
Take your current revenue growth rate and your current OpEx growth rate. At what ARR do they cross? That is your leverage inflection point - the moment where operating income turns positive. If that crossover happens at $60M ARR in your model but you only have 18 months of runway, you have a capital gap, not a leverage gap. A cash flow forecast that models this crossover explicitly - not as a static projection, but as a scenario range - is the instrument you need.
Building operating leverage intentionally: six decisions that matter
Operating leverage does not happen by accident at $5-50M ARR. It is the product of specific structural decisions made before the cost pressure is visible.
1. Set gross margin targets before hiring into COGS
Every customer success hire, every implementation resource, every support tier you add goes into COGS and directly reduces your gross margin floor. Gross margin is the ceiling on operating leverage - you cannot drop more to the bottom line than you keep after delivering the product.
If your gross margin is 68% and you target it at 75%, build a specific plan for what changes: support automation, infrastructure tiering, CS coverage model restructuring. Without an explicit target and an owner, gross margin drifts downward as a company scales. Establishing the right SaaS gross margin benchmark for your delivery model is the starting point. Bessemer's benchmarks show that top-performing cloud companies at $25-50M ARR carry gross margins of 75%+ - a ceiling that collapses quickly if COGS hiring is not explicitly governed.
2. Model headcount growth against revenue growth, not just capacity
The most common operating leverage mistake at Series A and B: hiring into functions because the team feels stretched, not because the unit economics support it. Every hire increases the fixed cost base - which means your OpEx ratio stays flat or grows unless revenue is accelerating faster.
Before each significant hire, run the leverage test: if we add this headcount, what does the S&M-to-revenue ratio or G&A-to-revenue ratio look like in four quarters at our projected growth rate? That is the test. "We need the person" is not the test. A working SaaS financial model makes this a 10-minute exercise, not a board-prep exercise.
3. Treat NRR improvement as a P&L investment, not a success metric
Expansion MRR programs - seat growth, tier upgrades, usage-based expansion - are not just retention initiatives. They are the most capital-efficient way to build S&M leverage. A dollar invested in improving NRR from 105% to 115% has a higher operating leverage return than a dollar invested in new logo acquisition at most ARR stages above $10M.
OpenView's 2023 benchmarks data showed that changing pricing and packaging produced a median +14% improvement in net dollar retention among expansion-stage SaaS companies - one of the highest-leverage, lowest-cost structural changes available.
4. Design GTM efficiency before adding headcount
Adding sales reps before the GTM motion is repeatable is a leverage destroyer. Each incremental AE extends your S&M ratio without the productivity improvement that compresses it. The leverage test for GTM: is quota attainment improving as you scale? Is sales cycle shortening? If not, adding headcount widens the S&M ratio rather than driving it down.
McKinsey's research found that top-quartile SaaS companies recover their customer acquisition costs in under 16 months, while bottom-quartile players take nearly four years - a 3x efficiency gap that compounds directly into the S&M ratio and operating leverage trajectory. Tracking LTV to CAC ratio by segment before you add reps is what separates a repeatable GTM motion from one that just scales cost.
5. Fix pricing before you hit $20M ARR
Pricing affects operating leverage through two channels: gross margin (if lower-tier pricing subsidizes high-touch delivery) and NRR (if there is no room to expand within the pricing model). A flat per-seat model with no usage or tier upside creates an NRR ceiling that limits leverage regardless of how efficiently you run the rest of the business.
If pricing is capped, the only levers are cost reduction and new logo growth. Both are harder to sustain than expansion revenue built into the pricing architecture.
6. Automate finance and reporting before it becomes a constraint
G&A bloat often comes from the finance and reporting function growing headcount to manage fragmented data, manual reconciliations, and board prep cycles. Companies that build a decision-grade FP&A infrastructure early - clean metrics definitions, a working financial model, automated variance reporting - run a materially leaner G&A function at $20-50M ARR than peers who rely on manual processes.
This is not a technology argument. It is a cost structure argument. A G&A ratio of 9% versus 14% at $25M ARR is $1.25M of annual operating income - a meaningful contributor to the leverage trajectory. The responsibilities of a SaaS CFO (or a fractional equivalent) include owning exactly this: building the model infrastructure before G&A bloat forces a reactive restructuring.
The Rule of 40 as your operating leverage summary metric
The Rule of 40 is the most widely used single-number summary of operating leverage in SaaS.
Rule of 40 score = ARR growth rate (%) + Profit margin (%)
A score of 40 or above signals that the business is balancing growth and profitability in a way investors consider sustainable. A score below 40 is not automatically alarming at early stage, but the trend direction matters as much as the absolute number.
McKinsey's analysis of over 200 software companies found that businesses exceed Rule of 40 performance only 16% of the time - and that top-quartile SaaS companies generate nearly three times the EV/revenue multiples of those in the bottom quartile. Clearing 40 is genuinely difficult; sustaining it is rarer still.
The Rule of 40 captures operating leverage in aggregate: a rising score over time means either growth is accelerating or margins are improving - both of which require real operating leverage, not just accounting adjustments. For a deeper breakdown of the formula, profitability input choices, and how to present the metric in a board context, the Rule of 40 guide for founders covers the full picture.
What is a good operating leverage score?
The gross-to-EBITDA flow-through formula gives you the clearest answer. A flow-through ratio above 0.25 (25 cents of every new gross profit dollar reaching EBITDA) is solid for a growth-stage SaaS company. Above 0.40 is strong. Above 0.60 suggests either very efficient OpEx management or growth is slowing.
While a high flow-through ratio looks great on paper, it can easily disguise deep structural issues. If your efficiency gains are achieved by stalling essential product development or customer support, you are simply borrowing from your future retention.
For the Rule of 40 specifically:
- Below 25: needs explanation at any ARR stage above $10M
- 25-39: acceptable with positive trend, but not competitive for growth investors
- 40-55: healthy range for Series B and C
- 55+: top-quartile; demonstrates structural leverage is working
Common mistakes and the replacement moves
Mistake: conflating gross margin improvement with operating leverage
Gross margin improvement is a prerequisite for operating leverage, not the same thing. You can have a 78% gross margin and still have no operating leverage if S&M and R&D are growing faster than revenue.
Replace with: track gross margin AND all three OpEx ratios separately. A scorecard that shows gross margin alongside S&M, R&D, and G&A as a percent of revenue is the minimum viable leverage dashboard. The contribution margin in SaaS is a related but distinct cut of the same data - useful for understanding per-product and per-segment profitability before it rolls up to the operating income line.
Mistake: cutting R&D or S&M to manufacture margin improvement
A one-quarter improvement in operating margin driven by cutting product investment or delaying hires is not operating leverage. It is a withdrawal from the asset base.
Replace with: improve margins through efficiency - sales productivity, NRR expansion, infrastructure cost reduction, and G&A automation - not through inputs that directly harm future growth capacity.
Mistake: reporting operating income without decomposing the drivers
Telling your board "operating margin improved by 4 percentage points this quarter" is a headline, not an analysis. Investors and board members want to know which ratio moved, what caused it, and whether the improvement is structural or temporary.
Replace with: present operating margin with component decomposition - gross margin, S&M ratio, R&D ratio, G&A ratio. Show each quarter for the past 6-8 periods. This is a 20-minute build in a working financial model and a material upgrade to the quality of your board conversation.
Mistake: assuming operating leverage will happen at scale without building for it
"We'll get more efficient as we grow" is an assumption, not a plan. Companies that assume leverage will appear naturally - because that is what SaaS is supposed to do - often arrive at $30M ARR with the same cost structure ratios they had at $15M ARR.
Replace with: set explicit targets for where each OpEx ratio should be at your next ARR milestone. Assign ownership. Review quarterly. If S&M is not compressing, investigate whether the GTM motion is genuinely more efficient or whether the team is just running harder.
Mistake: treating all S&M spend as equal in the leverage calculation
A company with $8M of S&M spend split 70/30 between new logo acquisition and customer success is in a very different leverage position than one spending 90/10 on the same ratio. If most S&M is supporting retention rather than driving growth, the S&M ratio will never compress - because you need that spend to prevent NRR from collapsing.
Replace with: segment S&M by function. Customer success and retention spend belongs inside a clear framework tied to NRR targets. New logo acquisition spend belongs inside a CAC payback model. Blending them obscures both.
A practical dashboard for tracking operating leverage
You do not need a complex tool to track this. You need five clean metrics, measured quarterly, over at least six periods.
Add NRR to this dashboard and you have a complete picture of whether operating leverage is building, stalling, or reversing.
The Fiscallion approach to financial modeling and board reporting is built around exactly this structure: metrics that are decision-ready, tied to real operational inputs, and owned by someone who can act on the number when it moves. A well-structured SaaS financial model will surface these ratios automatically and connect them to your forward projections. If your current model does not show you OpEx ratios trending over eight quarters, that is the gap to close first - before any of the six structural decisions above will be legible in the numbers.
What this dashboard should trigger:
- If S&M ratio rises two quarters in a row: investigate GTM efficiency before the next hire
- If R&D ratio falls below 14% of revenue: flag potential product underinvestment for board discussion
- If G&A ratio is above 12% at $15M+ ARR: audit the overhead structure
- If flow-through drops below 0.10: identify which OpEx bucket is consuming gross profit growth
Frequently asked questions
What is a good operating margin for SaaS?
"Good" depends on ARR stage and trajectory. For private B2B SaaS, operating margin typically runs at -30% to -15% at Series A/B ($10-20M ARR) and narrows toward breakeven by $35-50M ARR. Investors at Series B and C care less about the absolute number and more about the improvement trend and your modeled path to positive margins.
At scale ($50M+ ARR), a 15-20% operating margin is a strong result. Below 5% operating margin at $50M+ ARR with 75%+ gross margins indicates the cost structure is not compressing - which usually points to a GTM inefficiency problem or a G&A overhead problem that needs explicit attention.
A 20% operating margin is an excellent outcome at scale. Achieving it typically requires S&M below 30% of revenue, which in turn requires NRR above 110% and a well-established brand that generates significant inbound pipeline without proportional spend increases.
What is a good operating leverage ratio?
Using the gross-to-EBITDA flow-through formula, anything above 0.20 (keeping 20 cents of each new gross profit dollar) signals positive operating leverage for a growth-stage SaaS company. Above 0.30 is strong. The maximum is 1.0 (all gross profit growth falls to EBITDA, with zero OpEx growth) - practically speaking, 0.40-0.60 reflects a business with exceptional cost discipline.
Using the classical degree of operating leverage formula (% change in operating income ÷ % change in revenue), a ratio above 1.0 is positive leverage by definition. Above 2.0 signals that profitability is expanding twice as fast as revenue - a strong result.
Is 20% operating margin good for SaaS?
Yes - 20% operating margin is a genuinely strong result, and at the $5-50M ARR range it is top-decile. Context matters: a 20% operating margin at $15M ARR with 80% gross margins means you are running a very lean cost structure, possibly at the expense of growth investment. A 20% operating margin at $50M ARR with 76% gross margins reflects a company that has built real operating leverage over several years.
For investors evaluating growth-stage SaaS, a 20% operating margin is compelling but not the primary filter. They will ask: is this margin achieved while maintaining strong ARR growth? If growth is 15% and margin is 20%, the Rule of 40 score is 35 - below the threshold. If growth is 30% and margin is 20%, the score is 50 - top-quartile.
The risk of optimizing aggressively for a 20% operating margin before the business has fully scaled its GTM model is that you achieve the margin by cutting the investments that drive growth - particularly R&D, customer success, and mid-funnel marketing. That trade-off can show up as NRR compression 12-18 months later, at which point recovering the growth engine costs more than the margins saved.
What is the Rule of 40 for SaaS?
The Rule of 40 states that a SaaS company's ARR growth rate (%) plus its profit margin (%) should equal at least 40 for the business to be considered a healthy, investor-grade scaling company.
Rule of 40 score = ARR growth rate (%) + Profit margin (%)
Example: 30% ARR growth + 12% FCF margin = 42. Above the threshold.
The rule captures the growth-profitability trade-off: fast-growing companies with negative margins can still clear 40, while slower-growing companies need positive margins to compensate. Free cash flow margin is increasingly preferred over EBITDA margin as the profitability input, because it is harder to manipulate through accounting adjustments.
At the $5-20M ARR stage, fewer than 30% of private B2B SaaS companies clear the Rule of 40 - so falling short early is the norm. By $30-50M ARR, the top quartile consistently clears 40, and it becomes an important filter in growth equity and Series C conversations. A rising trend toward 40 over 6-8 quarters is often more persuasive to investors than a static score above it.
Understanding how revenue recognition in SaaS affects the profitability input in your Rule of 40 calculation matters more than most founders expect - particularly if you have a mix of annual and monthly contracts, or deferred revenue balances that shift meaningfully quarter to quarter.
Operating leverage is a design choice, not a milestone
Operating leverage is not something that happens to your business. It is something you design into it.
The companies at $5-50M ARR that arrive at their Series C with real margin expansion - not manufactured through cost cuts, but through structurally declining OpEx ratios - did not get there by accident. They set gross margin targets before headcount decisions. They treated NRR as a P&L lever, not a success metric. They tracked S&M, R&D, and G&A as ratios every quarter. They built financial models that projected the leverage inflection point and held the org accountable to the path.
If you can not currently answer "when does our operating leverage inflection point arrive, and what needs to be true for that to happen on schedule?" - that is the gap to close.
The starting point is a working financial model that tracks the right ratios, owns the assumptions, and connects operational decisions to the operating margin trajectory. If you want to audit your current model or build one that supports these decisions, book a working session with the Fiscallion team.
