

This guide covers what a startup cash flow forecast needs to contain, how to build the two models that work in parallel, where assumptions break, and how to run a decision cadence around your numbers rather than a reporting exercise.
Key takeaways
- A cash flow forecast and a P&L are not the same thing. Your company can show MRR growth and still run out of cash if the timing of collections, payroll, and headcount hires are not modeled explicitly.
- Startups at the $5M-$50M ARR stage need two forecast horizons running in parallel: a 13-week direct forecast for liquidity management, and an 18-month indirect forecast for capital allocation and runway planning.
- The most common forecasting failure is not the math - it is the assumptions. Someone needs to own the inputs, update them on a fixed cadence, and flag when actuals diverge from plan.
What we'll cover
- Why cash flow forecasting is a different problem than revenue forecasting
- Direct vs. indirect methods - and when to use each
- The SaaS-specific inputs that most forecasts miss
- How to build the 13-week direct forecast
- How to build the 18-month indirect forecast
- Scenario modeling that supports real decisions
- The decision cadence that turns a forecast into a management tool
- Common mistakes and the replacement moves
Cash flow visibility and revenue growth solve different problems
You can run a business at $15M ARR and still face a cash crisis in Q1. Revenue forecasting tells you about bookings, ARR, and MRR growth.
Confusing top-line revenue acceleration with structural cash runway clarity frequently blindsides leadership teams during sudden market shifts. While adding new revenue scales the business over time, maintaining absolute visibility into your cash timeline is what preserves the operational flexibility required to survive long enough to scale.
Cash flow forecasting tells you when money lands in your bank account relative to when it leaves. These two things diverge materially in SaaS for a few reasons:
- Annual contracts create a mismatch between recognized revenue and actual cash received.
- New hires create cash outflow 30-90 days before they contribute to any revenue.
- Deferred revenue appears healthy on the P&L but does not fund operations until the cash lands.
- Collections on net-30 or net-60 invoices mean your billings this month might not hit the bank for two months.
This is the gap that makes cash flow forecasting a discipline of its own - separate from your MRR model, separate from your income statement, and closer to a rolling operating decision than a quarterly finance exercise.
The founders who get into trouble are not usually the ones ignoring their numbers. They are the ones reading the wrong numbers. Their MRR is growing, their pipeline is strong, and their burn rate looks manageable - but the timing is off. As Andreessen Horowitz notes in their cash management guide, "the fundamental tenet of managing your liquidity as a startup is that timing and maturity matter" — and accounts receivable is not cash until it actually clears your bank account. A proper cash flow forecast is what tells you the timing.
Direct vs. indirect forecasting: the two models you need to run in parallel
There is a common confusion at the $5M-$50M ARR stage about which forecast to use. The answer is both - for different purposes, with different update frequencies.
Direct forecasting: your operational liquidity tool
The direct method tracks cash inflows and outflows transaction by transaction over a short time horizon - typically 13 weeks. You start with your current bank balance, add every expected cash receipt (subscription payments, one-time fees, grant drawdowns), and subtract every expected cash payment (payroll, software subscriptions, tax obligations, vendor invoices).
This model answers the question: will we have enough cash to cover payroll in six weeks?
It is updated weekly. It is owned by whoever has visibility into your AR aging, payment schedules, and vendor invoice timing - usually a CFO, controller, or fractional finance lead. The direct forecast is your early warning system. If a variance appears at week 3, you have nine weeks to respond.
Indirect forecasting: your runway and capital allocation tool
The indirect method builds your cash position from your P&L and balance sheet assumptions over 18-24 months. It starts with operating profit (or EBITDA), then adjusts for non-cash items, working capital changes, capex, and debt service.
This model answers the question: how long does our runway extend under different growth assumptions, and when do we need to raise?
It is updated monthly and reviewed in board meetings. The indirect forecast is where you model scenarios - what happens to runway if ARR growth slows from 80% to 40%? What if your top customer churns? What if the fundraise takes 4 months longer than planned?
The following chart illustrates why scenario modeling in the indirect forecast matters. A 20% increase in churn compresses runway by more than 8 months relative to the base case:
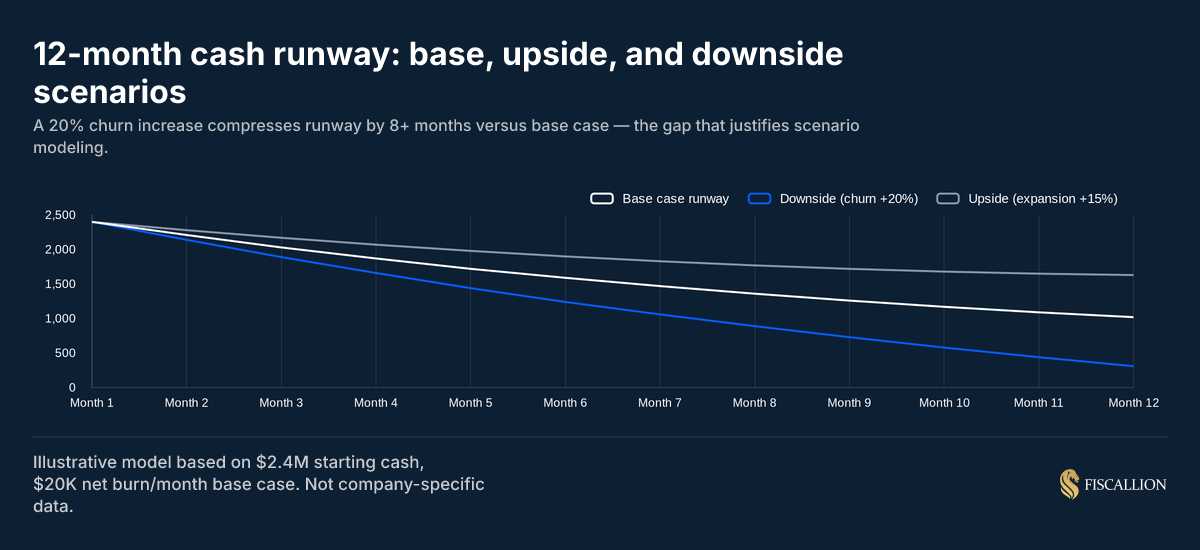
Running only one of these models is a decision quality problem, not a reporting gap. The direct model without the indirect gives you short-term visibility but no capital planning horizon. The indirect model without the direct gives you strategic clarity but no operational guardrails.
The SaaS-specific inputs that most cash flow forecasts miss
Generic cash flow templates miss the mechanics of SaaS revenue. Here are the inputs that need to be built explicitly into your model.
Billing cadence and collections timing
If you have a mix of monthly and annual customers, model the cash collection timeline for each. An annual contract signed on March 1 at $120,000 creates a very different cash profile depending on whether it is paid upfront, quarterly, or monthly. Build an AR aging assumption into your direct forecast that reflects your actual collections history, not your billing terms.
Deferred revenue movement
When you collect annual subscriptions upfront, the cash lands before revenue is recognized. This makes your cash position look better than your income statement suggests - until you stop growing new ARR. At that point, deferred revenue begins to unwind and cash collections fall below recognized revenue. Model this explicitly, especially if your mix is shifting toward annual billing. This dynamic is also one of the primary reasons the transition from cash to accrual accounting trips up founders at the $5M-$20M ARR stage — the divergence between cash collected and revenue recognized becomes impossible to ignore once you're on accrual.
Headcount lag
New hires create a cash outflow 30-90 days before they generate any measurable contribution to revenue. For an engineering hire, the productivity lag might be 3-6 months. In your direct forecast, model salary and benefit payments from the first payroll. In your indirect forecast, model the revenue contribution assumptions with an explicit lag by role type.
Payroll taxes and benefits timing
Employer payroll taxes, 401k match, health benefits, and equity-related tax obligations often hit in lumpy, irregular amounts. Model these separately from base salaries. A Q1 payroll tax catch-up or an annual benefits renewal can move your weekly cash position by 5-10% if you have not accounted for it.
Software and infrastructure step costs
Hosting costs, key SaaS tool contracts, and data infrastructure often have thresholds where costs jump materially at specific usage or seat levels. These are not linear. Build your infrastructure cost assumptions as a schedule with known step-up points, not a percentage of revenue.
Commission and bonus payouts
Sales commissions and performance bonuses are often paid one period after they are earned. Model the payment timing explicitly - a strong Q4 sales month creates a Q1 commission cash outflow that will not appear in your income statement in the same period.
How to build your 13-week direct cash flow forecast
The direct forecast is built from the bottom up. Here is the structure:
Opening balance: your actual bank balance at the start of the week.
Cash inflows (by week):
- Subscription collections (monthly billing customers paying this week)
- Annual upfront collections (by contract)
- Professional services or one-time payments expected
- Any other operating receipts
Cash outflows (by week):
- Payroll runs (model actual pay dates, not monthly averages)
- Payroll taxes and benefits
- Software and infrastructure invoices
- Vendor invoices (accounts payable by due date)
- Rent and facilities
- Commission payouts
- Any loan or debt service payments
Closing balance: opening + inflows - outflows, carried forward as the next week's opening balance.
Update this model every Monday with actuals from the prior week. When actual cash does not match the plan, do not just update the number - document why. This variance log becomes the source of truth for assumption quality improvement over time.
The direct forecast should be available to your finance lead, CFO or fractional CFO, and CEO. It is not a board document. It is an operational tool that informs real-time decisions about payment timing, payroll funding, and credit line usage.
How to build your 18-month indirect cash flow forecast
The indirect forecast is built from your existing financial model. If you do not have a three-statement model (income statement, balance sheet, cash flow statement), building one is the prerequisite. The three statements must link mechanically - changes in accounts receivable, deferred revenue, and accounts payable flow through to the cash flow statement automatically when the model is built correctly.
The indirect cash flow calculation is:
Net income (or loss)
- Depreciation and amortization
- Stock-based compensation (non-cash)
+/- Change in accounts receivable
+/- Change in deferred revenue
+/- Change in accounts payable and accrued liabilities
= Cash from operations
Then subtract:
- Capital expenditures
- Debt repayments
Add:
- Equity financing proceeds
- Debt draws
= Net change in cash
Apply this net change to your opening cash balance each month to get your ending cash position. Your runway is the point at which your projected cash balance reaches zero (or your minimum operating buffer).
The assumptions that most affect this model at the $5M-$50M ARR stage:
Each row in this table should have a named owner. When Fiscallion works through a cash flow model with a client, one of the first things we identify is which assumptions have no owner. Those are the ones that will be wrong.
Burn rate: what you're actually measuring and what it tells you
Net burn rate is the most commonly cited cash metric in startup finance, and also the most commonly misread.
A useful framework from Paul Graham: before you can confidently plan ahead, you need to know whether your startup is default alive or default dead — meaning, will you reach profitability on current trajectory before you run out of cash, or not? That question has to be answered with a dynamic burn model, not a static runway number. Our startup runway calculation guide walks through how to build that model correctly.
Net burn = Total cash outflows - Total cash inflows (operating)
The metric tells you how much cash the business consumes per month in net terms. At a $2M net burn and $6M in the bank, you have approximately 3 months of runway - but only if that burn rate holds constant, which it almost never does.
The more useful question is: what drives burn, and which levers are within your 30-90 day control window?
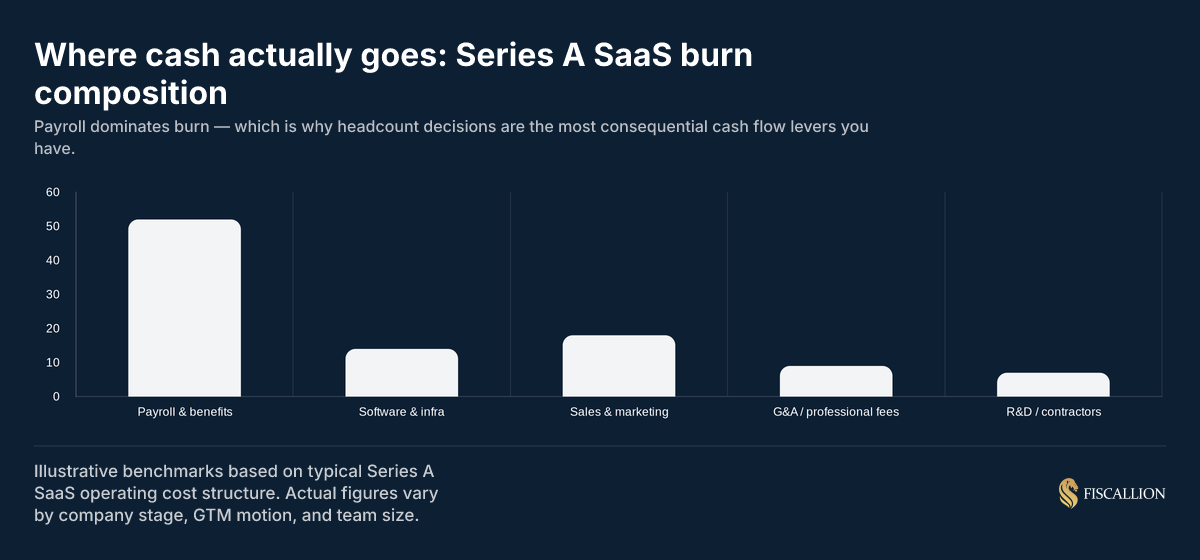
Payroll and benefits represent the single largest component of burn for most Series A and Series B SaaS companies - typically 50-55% of total monthly cash outflow. This matters because it means headcount decisions are not HR decisions. They are the most consequential cash flow decisions you make. Every hire you approve should be modeled against its cash impact on runway, not just its expected output.
The common misread of burn rate is treating it as a fixed number. Net burn changes materially when you sign a large annual contract (inflows spike), when you make a batch hire (outflows spike), or when a customer churns (inflows drop). The forecast needs to model these events explicitly, not smooth them into a monthly average. For a detailed breakdown of how net burn and burn multiple differ — and why conflating them creates real board-level confusion — see our burn rate vs. burn multiple explainer.
Scenario modeling: what the board deck actually needs to answer
A cash flow forecast that only shows one outcome is not a planning tool. It is a reporting exercise. The difference between a board-ready cash position narrative and a historical summary is the scenarios.
At minimum, model three:
Base case: your operating plan assumptions - expected new ARR growth rate, planned hiring, current churn, current billing mix.
Downside: churn increases 15-25% from base, new ARR growth decelerates by 30-40%, a large deal slips a quarter. This is your "what if the year goes sideways" model.
Upside: expansion revenue outperforms, a large deal closes early, a planned hire is deferred. This is your "what do we do if we have more headroom than expected" model.
Each scenario should show:
- Monthly ending cash balance for 18 months
- Runway in months from today
- The key assumption that changes most between base and downside
- A specific decision trigger: "If ARR growth drops below X% for two consecutive months, we initiate these three actions"
This last element - the decision trigger - is what most board decks omit. The scenarios exist, but they do not connect to actions. What you want is a pre-agreed response playbook, built into the model, that removes decision lag when a negative scenario materializes. Sequoia's Adapting to Endure memo made the same case to founders at scale: know your scenarios before you need them, and define the operating actions tied to each before the pressure hits.
The decision cadence that makes a forecast useful
A forecast that is updated quarterly is a planning document. A forecast that is updated weekly (direct) and monthly (indirect) with variance reviews becomes a management tool.
Here is the cadence that turns cash flow forecasting into a decision-making discipline:
Weekly (direct forecast review):
- Finance lead updates actual cash receipts and payments from the prior week
- Variance from plan is documented and categorized (timing vs. structural)
- Flag any week within the 13-week window where projected cash falls below the operating buffer
- Output: a one-line cash status note to the CEO - "Current balance $X, projected 13-week trough $Y on [date], current plan holds / flag"
Monthly (indirect forecast review):
- Update actuals for the prior month
- Reforecast the next 18 months with updated growth assumptions
- Review scenario model: which scenario is the business tracking toward?
- Identify any assumption changes that affect runway by more than 30 days
- Output: updated runway slide and cash bridge for the board or leadership team
Quarterly (board meeting):
- Present all three scenarios with current tracking
- Frame the capital allocation decision: at current burn and trajectory, when is the next decision point (raise, cut, or accelerate)?
- Surface any structural assumption changes that require a decision before the next board meeting
- Output: a board-level recommendation, not a historical summary
The goal is to think proactively and have the right person act at the right time. Harvard Business Review's research on forecasting practice reinforces this: the most accurate forecasts are not the most sophisticated ones — they are the ones updated most consistently against actuals.
Common mistakes and the replacement moves
Most cash flow forecasting mistakes are timing errors, assumptions errors, and framing errors that only surface when the cash position is already under pressure.
Mistake 1: treating MRR growth as cash flow confirmation
MRR is recognized revenue. Cash is what hits your bank account. They diverge whenever you have annual billing, net-60 terms, deferred onboarding revenue, or a large AR balance. Replace the habit of reading MRR as a cash proxy with a monthly cash bridge reconciliation that shows the translation from ARR growth to actual cash collected.
Mistake 2: single-scenario planning
Building one forecast and calling it the plan makes every deviation feel like a surprise. Run three scenarios, assign a probability weight to each (e.g., 60% base, 25% downside, 15% upside), and define the actions tied to each. When actuals track closer to downside for two months in a row, the response does not require a new analysis - it triggers the pre-built plan.
Mistake 3: no owner on assumptions
The most fragile part of any forecast is the assumptions that nobody formally owns. The hiring plan input owned by the CEO is updated quarterly. The churn assumption owned by Customer Success is updated monthly. The collections timing assumption owned by nobody is updated when something goes wrong. Map every key assumption to a named owner and a review frequency.
Isolating cash projections within the finance team completely separates the model from the real-world activities that drive cash consumption. Forcing department leaders to actively own the operational triggers behind their budgets is the only way to maintain a forecast that reflects reality.
Mistake 4: using net burn as a static number for fundraising timing
"We have 18 months of runway" is a meaningful statement only if burn is held constant. At most growth-stage SaaS companies, burn accelerates through the year as hiring plan executes. Calculate your runway dynamically - apply the month-by-month net burn projection from your model, not a simple division of cash divided by current monthly burn. The real runway figure is almost always shorter than the static number suggests.
Mistake 5: presenting cash as an output, not a decision frame
When the board deck shows "cash: $7.2M, runway: 14 months" without context, it answers the wrong question. The useful framing is: "At current trajectory, we reach our next fundraise trigger at month 10. To extend runway to 18 months without new capital, we need to hold ARR growth above 60% MoM or defer Q3 hiring by one quarter. Here is the trade-off." That is a board conversation. The first version is a report.
Your cash flow forecasting starting checklist
Most cash flow forecasting failures are assumptions failures. Someone set a number nobody owns, nobody updates, and nobody questions until the variance is too large to ignore. Use this checklist as a diagnostic before building or auditing your model:
Model completeness
- Direct (13-week) and indirect (18-month) forecasts both exist and are maintained separately
- Three-statement model links P&L, balance sheet, and cash flow statement mechanically
- Deferred revenue schedule built explicitly and tied to billing cadence
- Headcount plan modeled by hire date with salary, benefits, and payroll tax by month
- AR aging and collections timing assumption is specific, not averaged
- Commission and bonus payout schedule is modeled on actual payment dates
Assumptions governance
- Each key assumption has a named owner
- Actuals vs. plan variance is reviewed weekly (direct) and monthly (indirect)
- Variance log exists and documents root cause of deviations
Scenario and decision layer
- At least three scenarios (base, downside, upside) are built and current
- Each scenario has a defined trigger condition (not just a range of outcomes)
- Pre-agreed response actions exist for the downside scenario
- Runway is calculated dynamically, not as a static division
Board and leadership output
- Monthly cash bridge reconciles ARR growth to actual cash collected
- Board materials present trade-offs and decision triggers, not just historical cash position
- Next capital decision point is explicitly named in the forecast
The forecast is only useful if it drives a decision
A cash flow forecast is not a finance team deliverable. It is a leadership tool. When it is built correctly, it tells you when to hire, when to hold, when to raise, and what the actual cost of each decision is measured in months of runway.
The companies that get into cash trouble between $5M and $50M ARR are almost never the ones who lacked revenue growth. They are the ones whose timing was off - collections lagged, hiring pulled forward, a deal slipped, and nobody had modeled the combination explicitly. A forecast that runs both time horizons, maintains named assumption owners, and connects scenarios to pre-agreed actions closes that gap.
If your current cash visibility lives in a static burn rate and a monthly bank statement, the gap between that and a decision-grade forecast is closer than it looks. Fiscallion builds and maintains the forecasting infrastructure for scaling SaaS companies who need CFO-level financial judgment without a full-time finance org. Audit your metrics definitions and forecasting model to see where the gaps are.
