

The term sheet arrives. It says "$12M pre-money valuation." You nod. The investor nods. You both mean different things, and neither of you has confirmed which one.
That single word — pre versus post — can shift your ownership by three to five percentage points. Over a two-round funding path, that difference can represent millions of dollars in exit proceeds. Yet many founders reach Series A without a clear, working model of how the two numbers connect.
This guide covers the formulas, the conversion mechanics, the valuation methods that produce pre-money figures by default, and the four common mistakes that quietly erode founder equity before ink hits paper.
Key takeaways
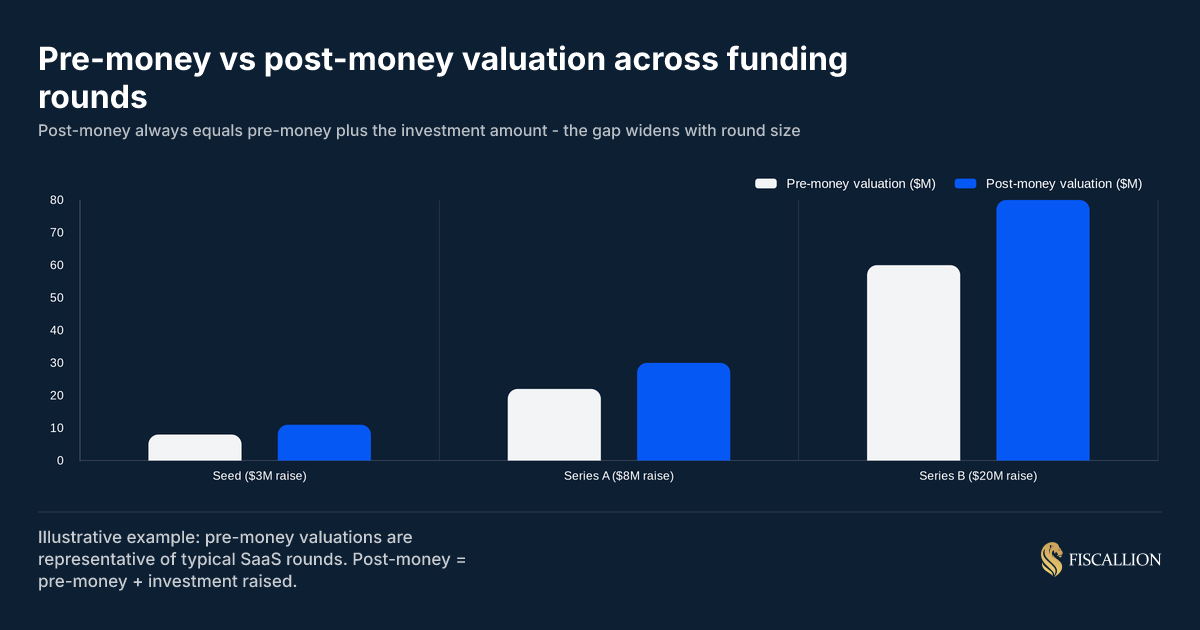
- Post-money valuation is always pre-money plus the investment amount. The math is fixed. The negotiation is around what the pre-money should be.
- Investor ownership percentage is calculated against the post-money figure, not the pre-money. Misunderstanding this is the most common source of cap table confusion.
- DCF and comparable company analysis produce pre-money valuations by default. You convert to post-money by adding the proposed investment.
- Post-money SAFEs lock in investor ownership immediately. Pre-money SAFEs leave ownership floating until a priced round — and that ambiguity almost always cuts against you.
- The option pool shuffle routinely adds 3–5 percentage points of effective dilution that does not appear in the headline pre-money number.
What we'll cover
- The core definitions and the one formula that governs everything
- How to calculate pre-money, post-money, and investor ownership from any starting point
- A worked example using a real funding scenario
- How to convert between pre-money and post-money
- Whether DCF is pre-money or post-money
- Pre-money vs post-money SAFEs and why the distinction matters more than the cap
- The option pool shuffle and how it inflates effective dilution
- 2026 valuation benchmarks by stage
- The four mistakes founders make during term sheet negotiations
The one formula you need to know
Everything in startup valuation mechanics flows from a single relationship:
Post-money valuation = Pre-money valuation + Investment amount
That is not a simplification. That is the complete formula for a priced equity round. The pre-money valuation is what both parties agree the company is worth before new capital arrives. The post-money valuation is what the company is worth immediately after, with that capital included.
From this, three additional calculations follow directly:
The reason investor ownership is calculated against the post-money figure — not the pre-money — is that after the round closes, the investor's capital is inside the company. Their percentage represents their share of the total value, which now includes their own contribution.
Founders who calculate ownership against the pre-money figure consistently overestimate what they're retaining. The error is small at low round sizes and large at higher ones. Investopedia's breakdown of pre-money vs. post-money mechanics illustrates why this denominator distinction is the most commonly misunderstood point in early-stage financing.
How to calculate pre-money and post-money valuations
Starting from a negotiated pre-money
This is the most common scenario in a priced round. The term sheet states a pre-money valuation and an investment amount.
Example: Series A, $10M pre-money, $3M investment.
- Post-money = $10M + $3M = $13M
- Investor ownership = $3M ÷ $13M × 100 = 23.1%
- If you held 100% before: your new ownership = 100% × (1 − 23.1%) = 76.9%
Starting from a post-money figure
Investors sometimes present offers in post-money terms. "We'll invest $5M at a $25M post-money."
- Pre-money = $25M − $5M = $20M
- Investor ownership = $5M ÷ $25M × 100 = 20%
Always confirm which number is being quoted. The phrase "we're offering $2M at a $10M valuation" has two very different meanings:
- If pre-money: post-money = $12M, investor gets 16.7%
- If post-money: pre-money = $8M, investor gets 20%
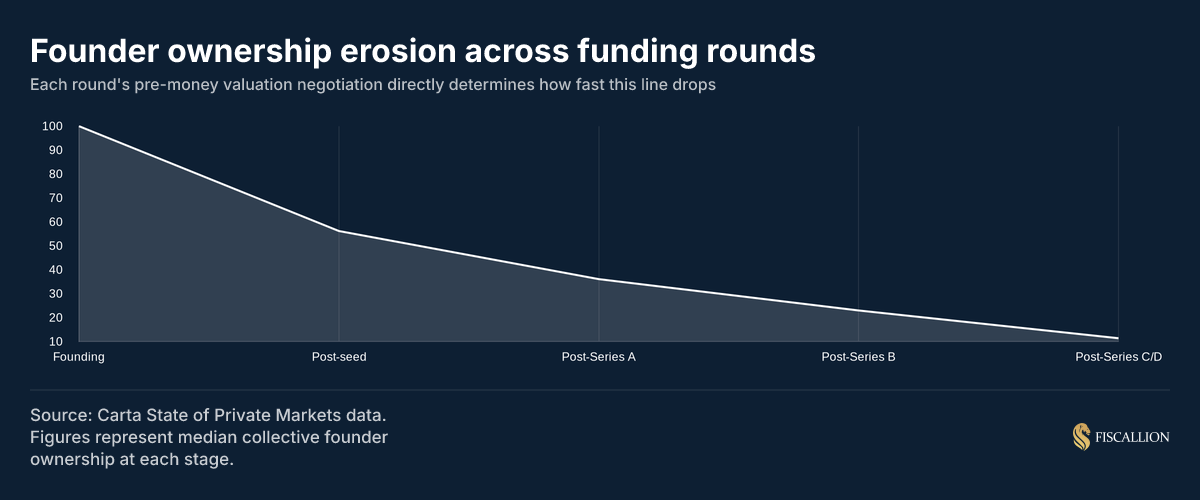
That 3.3 percentage point gap compounds across subsequent rounds. The cumulative ownership erosion from multiple rounds — each individually reasonable — adds up faster than most founders model. For a round-by-round picture of how founder ownership declines from pre-seed through Series B, see our guide on equity dilution in startups.
Working backwards from a target ownership
If an investor says they need exactly 25% of your company, and the agreed pre-money is $8M:
Investment = $8M × (25 ÷ 75) = $8M × 0.333 = $2.67M
Verify: post-money = $8M + $2.67M = $10.67M. Investor % = $2.67M ÷ $10.67M = 25%. Correct.
The fully diluted share count matters
When you calculate investor ownership, the denominator should be the fully diluted share count — all issued shares plus any options, warrants, and convertible securities. Using the basic share count understates dilution. Investors will model on a fully diluted basis. You should too.
Carta's overview of share dilution mechanics is a useful reference for understanding how each instrument type contributes to the fully diluted count — particularly when you have multiple SAFEs and an option pool in play simultaneously.
A worked pre-money valuation example
Scenario: SaaS company, $4M ARR, growing at 80% year-over-year, 75% gross margin. You're raising a Series A. Comparable SaaS companies at your stage trade at 12–15x ARR. You model a $48M pre-money valuation. An investor offers $8M.
Step 1: Confirm pre-money
Agreed pre-money: $48M
Step 2: Calculate post-money
Post-money = $48M + $8M = $56M
Step 3: Calculate investor ownership
Investor % = $8M ÷ $56M × 100 = 14.3%
Step 4: Model your dilution
If you held 70% (accounting for earlier dilution from a seed round and option pool):
New ownership = 70% × (1 − 14.3%) = 60%
Step 5: Check against the option pool requirement
If the investor requires a 12% option pool created pre-money, the effective pre-money drops:
Effective pre-money for existing shares = $48M × (1 − 0.12) = approximately $42.2M
That pool creation eats 7.7 percentage points of the stated pre-money before the investor's dilution is applied. It is real dilution that does not appear in the headline number.
How to convert pre-money to post-money valuation
Converting between the two is always the same operation. There are no conversion factors, adjustment ratios, or approximations required.
Pre-money to post-money: Add the investment amount.
Post-money to pre-money: Subtract the investment amount.
Where founders run into trouble is when the "investment amount" is ambiguous — specifically, when unconverted SAFEs or convertible notes are sitting on the cap table.
If you have $1.5M in outstanding post-money SAFEs and you raise a priced Series A, those SAFEs convert alongside the new investment. The total dilutive effect is the new equity investment plus the shares issued upon SAFE conversion. Your effective post-money includes all of it.
The practical implication: before your Series A, model the conversion of every outstanding convertible instrument and calculate your pro-forma cap table. The stated pre-money valuation in your term sheet does not automatically account for SAFE dilution. That is a separate calculation you must run yourself. Our SAFE note startup guide includes the full conversion math with worked examples across single and stacked SAFE scenarios.
Many founders map out their future ownership based strictly on the headline pre-money figure, overlooking how drastically converting notes will alter the final math during a priced round. When un-capped or heavily discounted instruments finally convert, the resulting equity distribution frequently delivers a severe shock to the founding team.
Is DCF pre-money or post-money?
DCF (discounted cash flow) analysis is a pre-money valuation method.
Here is why: DCF estimates a company's intrinsic value by projecting future free cash flows and discounting them back to present value at a rate that reflects the company's risk profile. That calculation is entirely independent of any proposed investment. It measures what the company is worth based on what it can generate — not based on capital that has not yet been deployed.
The same is true of comparable company analysis (revenue multiples, ARR multiples, EBITDA multiples). These methods produce a standalone enterprise value based on the company's current metrics. That is the pre-money figure. Harvard Business School's primer on discounted cash flow walks through the mechanics in depth and is worth reading before you use DCF as a valuation anchor in negotiations.
The workflow:
- DCF or comps analysis produces your pre-money valuation
- You agree on an investment amount with your investor
- Pre-money + Investment = post-money valuation
- Post-money ÷ Investment = investor ownership %
For SaaS companies at $5–50M ARR, DCF is rarely the primary method. The discount rate required to reflect actual venture risk (30–50% for a Series A company) often produces a number that conflicts with what the market is willing to pay. Comparable transaction multiples tend to be the anchor, with DCF serving as a sanity check or a negotiation tool. Investopedia's guide to valuing startup ventures covers why market-based approaches tend to dominate intrinsic methods at the early stages.
SaaS-specific note: If your model uses an ARR multiple to arrive at your pre-money, that multiple should be applied to your current ARR (or forward ARR with an explicit adjustment), not your post-money ARR assuming the capital has already been deployed. Mixing the time reference distorts the output.
Pre-money vs post-money SAFEs: the distinction that costs founders real equity
SAFEs (Simple Agreement for Future Equity) defer the valuation conversation to a future priced round. But the pre-money vs post-money distinction in a SAFE is not about the company's valuation — it is about how the conversion calculation works when the SAFE eventually converts.
In Q1 2025, SAFEs accounted for 90% of all pre-seed rounds. By Q3 2024, 87% of all SAFEs were post-money, up from 43% at the start of the decade. Y Combinator's shift to post-money templates drove much of this. Understanding what you're signing matters more than ever. For the full mechanics — including conversion price formulas, the valuation cap, discount rate, and SAFE stacking scenarios — see our SAFE note startup guide.
How a post-money SAFE converts
With a post-money SAFE, the investor's ownership percentage is fixed at the moment of signing. If they invest $500K on a $10M post-money cap:
Investor ownership = $500K ÷ $10M = 5%
That 5% is locked. If you issue another post-money SAFE to a second investor, they dilute the founders, not the first SAFE investor. Carta's guide to pre-money vs. post-money SAFEs is the clearest reference document on this structural difference and the one most Series A investors will expect you to have read.
How a pre-money SAFE converts
With a pre-money SAFE, the ownership is floating. The conversion price is calculated at the time of the priced round based on the company capitalization before the SAFE investments are counted. This means multiple SAFE investors dilute each other, not just the founders.
For a founder with several pre-money SAFEs outstanding, the final ownership split is genuinely unknowable until the Series A closes.
The practical difference on a cap table
Using the same inputs — founders hold 8M shares, two investors each put in $500K on a $10M cap, Series A has a $15M pre-money and $3M investment, plus a 2M-share option pool:
The founders retain slightly more with post-money SAFEs in this scenario because the SAFE investors absorb less. But the more important point is predictability. With post-money SAFEs, you know your ownership percentage from the moment each SAFE is signed. With pre-money SAFEs, you do not.
The standard advice: use post-money SAFEs, accept the transparency trade-off, and negotiate the cap carefully. The cap is the variable with the most leverage. A $10M cap versus a $12M cap on a $500K SAFE is a difference that will show up concretely on your cap table at Series A.
SAFE stacking is a real risk
Each additional post-money SAFE you issue dilutes the founders, and the cumulative effect compounds. If you raise $500K, then $300K, then $400K across three SAFEs on the same $10M cap, you have collectively sold 12% of the company before a priced round. Many founders model each SAFE in isolation and underestimate the total. Map out your total SAFE obligations in a pro-forma cap table before you sign each new agreement. Our cap table management guide includes a SAFE stacking model and shows the compounding dilution effect across multiple instruments converting simultaneously.
Treating early-stage convertible notes as isolated, minor dilution events is a systemic trap that quietly erodes founder control before a formal round even begins. Maintaining absolute mathematical discipline requires tracking the cumulative impact of these instruments against a hard, pre-determined equity ceiling.
The option pool shuffle: dilution hiding in plain sight
The option pool shuffle is the mechanism by which investors require an employee stock option pool to be created before the investment closes, sized as a percentage of the post-money cap table.
The effect: the pool comes out of the pre-money valuation. Founders bear the entire dilution cost of the pool. Investors do not. The original analysis on this dynamic — The Option Pool Shuffle by Venture Hacks — remains the clearest articulation of how the mechanism works and why it consistently benefits investors over founders.
Example:
- Agreed pre-money: $10M
- Investor requires 15% option pool created pre-money
- Effective pre-money for existing shareholders: $10M × (1 − 0.15) = $8.5M
- Stated headline: "$10M pre-money"
- Actual value of your existing shares: $8.5M
The replacement move is to push for post-money option pool creation, which spreads the dilution across all shareholders including the incoming investor. Even if you cannot achieve that, negotiate the pool size down to what you actually need to hire over the next 18 months — not the maximum a term sheet might suggest. Andreessen Horowitz's explainer on how startup options and ownership work provides useful context on how institutional investors model option pool requirements and what negotiation leverage looks like in practice.
A 10% pool on a $10M pre-money versus a 15% pool means $500K more in effective founder equity. It is worth the conversation. Our guide on equity dilution in startups includes the counter-offer framework for option pool negotiations, including how to size your ask against a documented 18-month hiring plan.
2026 valuation benchmarks by stage
These figures provide context for where the market sets pre-money valuations across funding stages. They are not a formula — they are a starting point for comparison.
Source: Carta State of Private Markets, Q3 2025.
Two patterns worth noting for SaaS companies in the $5–50M ARR range:
AI premium is real. AI-native companies are receiving pre-money valuations approximately 42% higher than non-AI peers at seed stage. If you are not AI-native, do not anchor your pre-money expectations to AI comps.
Down rounds remain elevated. Roughly 19% of new rounds in early 2025 came in below the previous round's valuation. Agreeing to an aggressive pre-money creates down-round risk in your next fundraise if growth does not match the implied trajectory. A sustainable step-up (2–3x pre-money from one round to the next) is more defensible than a headline number that requires heroic performance to justify.
What the valuation methods actually produce
Different valuation approaches feed the pre-money figure. None of them automatically produce a post-money number.
Comparable company analysis (market approach)
Identify 5–10 SaaS companies at your stage and growth profile. Apply their median ARR multiple to your ARR.
Example: Comparables trade at 12x ARR. Your ARR is $4M. Implied pre-money = $48M.
Adjust for differences in growth rate, net revenue retention, and gross margin. A company growing at 100% YoY with 115% NRR commands a premium over a 60% growth company with 95% NRR, even at the same ARR.
Discounted cash flow (income approach)
Project 3–5 years of free cash flows. Discount at a rate appropriate to your stage: 30–50% for a Series A company, 20–30% for Series B and beyond. Add a terminal value (exit multiple method is more appropriate for startups than perpetuity growth).
The output is a pre-money enterprise value. Add your proposed investment to get post-money.
DCF is most useful as a constraint check — it tells you whether the market multiple you are negotiating toward can be supported by the underlying cash generation of the business. If comparable transactions imply a $50M pre-money but your DCF produces $22M, one of your growth assumptions is aggressive. Know which one before an investor asks. HBS Online's guide to understanding venture capital financing explains how institutional investors triangulate across multiple methods and why DCF alone is rarely sufficient at early stages.
Venture capital method
Work backward from an exit scenario:
- Estimate exit value in 5 years (e.g., $200M at 10x ARR on $20M ARR)
- Apply a target return multiple (e.g., 10x for a Series A investor)
- Required post-money today = $200M ÷ 10 = $20M
- Pre-money = $20M − Investment amount
This is how many VC investors actually anchor their offers. Understanding it lets you pressure-test their proposed pre-money against their own assumptions.
Four mistakes that cost founders equity at term sheets
Even during late-stage term sheet negotiations, founders routinely sacrifice equity by misjudging how subtle structural clauses alter their actual ownership. Review the following four breakdown failures to ensure these hidden valuation traps are completely engineered out of your next term sheet negotiation.
1. Treating the stated pre-money as the effective pre-money
The option pool shuffle, outstanding SAFEs that convert at round, and convertible notes with interest all affect your actual dilution beyond the headline pre-money figure. Run the full pro-forma before signing.
Replacement move: Build a round-by-round cap table model before you enter term sheet negotiations. Know your fully diluted ownership under multiple scenarios: base case, conservative pre-money, and aggressive option pool size. Our cap table management guide walks through exactly this modeling exercise, including how to structure the pro-forma for a Series A conversation.
2. Conflating "higher pre-money" with "better deal"
A higher pre-money that comes with a larger option pool requirement, higher liquidation preferences, or weighted-average anti-dilution protection can be economically worse than a lower pre-money with clean terms.
Replacement move: Evaluate the full term sheet — ownership percentage, liquidation stack, board composition, and protective provisions together. Model a downside exit scenario ($50M) and a base exit ($150M) to see where founders and investors actually land under each set of terms.
3. Issuing SAFEs without modeling conversion
Founders often raise multiple SAFE rounds without a live pro-forma cap table. They discover the actual dilution at Series A, after the term sheet is signed.
Replacement move: Every time you issue a new convertible instrument, update your conversion model. Assume a realistic Series A pre-money (not an optimistic one) and calculate the dilution at that implied valuation. The conversion scenarios belong in the same model as your runway and headcount plan. The SAFE note startup guide includes a section specifically on modeling SAFE stacking across different priced-round valuation scenarios.
4. Accepting an investor's ownership percentage claim without verifying it
Investors sometimes state their ownership target without specifying whether it is calculated on a basic or fully diluted basis, before or after option pool expansion.
Replacement move: When an investor says they need "20%," confirm: 20% of what share count, measured when (before or after pool creation), and on basic or fully diluted shares. The answer changes the required investment amount and your residual ownership significantly. For context on how equity compensation is structured within the fully diluted stack, our startup equity compensation guide covers how options, RSUs, and vesting schedules interact with cap table math at each round.
The dilution decision is a FP&A problem, not just a legal one
Here is what most founders miss: pre-money vs post-money valuation is not a legal question you hand off to counsel. It is a forecasting and capital allocation question that connects directly to your runway, your hiring plan, and your next fundraise.
The pre-money you agree to today sets the implied valuation trajectory for your Series B or C. If you lock in a $50M pre-money at Series A, you will need to demonstrate $150–200M in value at Series B to show a credible step-up. If your growth assumptions that justified the $50M do not materialize, you face a down round — with all the anti-dilution consequences that follow.
The connection to unit economics is direct. A SaaS company at $4M ARR with 80% gross margin and 130% net revenue retention can credibly support a higher pre-money than one with the same ARR but 60% gross margin and 90% NRR. The multiple investors are willing to apply tracks those metrics. Knowing your unit economics precisely — CAC payback, LTV/CAC by cohort, NRR by segment — is not just reporting practice. It is the foundation of a defensible pre-money negotiation.
At Fiscallion, we build the financial model that connects your ARR, gross margin, and cohort metrics to a defensible valuation range before you enter the fundraise. That model includes SAFE conversion scenarios, option pool sensitivities, and the implied pre-money you will need to hit at the next round to avoid a down. It is the same work a strong VP Finance or fractional CFO would do — without the six-month hiring timeline.
Pre-money vs post-money: a decision checklist
Before you sign any term sheet involving a pre-money valuation or convertible instrument, work through these steps:
Valuation mechanics
- Confirmed whether the quoted valuation is pre-money or post-money
- Calculated post-money = pre-money + investment
- Verified investor ownership using post-money as the denominator
- Confirmed calculation uses fully diluted share count
Option pool
- Identified whether pool creation is pre-money or post-money
- Sized the pool using your actual 18-month hiring plan
- Calculated effective pre-money after pool creation
- Negotiated pool size down to the minimum defensible level
Convertible instruments
- Modeled conversion of all outstanding SAFEs at the proposed pre-money
- Calculated total SAFE dilution separately from new round dilution
- Confirmed whether SAFEs are pre-money or post-money
- Updated pro-forma cap table with all instruments converting simultaneously
Term sheet evaluation
- Modeled full dilution including pool expansion and SAFE conversion
- Compared liquidation preference stack against exit scenarios
- Assessed anti-dilution provisions and their trigger conditions
- Evaluated board and voting rights changes alongside economic terms
Next round implications
- Calculated required Series B pre-money for a credible 2–3x step-up
- Confirmed current growth trajectory supports that implied valuation
- Identified the ARR and NRR milestones that justify the pre-money you are accepting
Frequently asked questions
How do you calculate pre-money and post-money valuations?
Post-money = pre-money + investment. That is the only formula you need for a priced round. Investor ownership = investment ÷ post-money × 100. To reverse-engineer pre-money from a stated post-money, subtract the investment. To find the required investment for a target ownership stake, use: investment = pre-money × (target % ÷ (100 − target %)). For multi-round dilution, compound the calculations multiplicatively — not additively. Two 20% dilution events leave you with 64% (100% × 80% × 80%), not 60%.
What is an example of a pre-money valuation?
A SaaS company at $3M ARR growing 90% year-over-year, with comparable transactions trading at 14x ARR, might support a $42M pre-money valuation at Series A. An investor offers $7M. Post-money = $42M + $7M = $49M. Investor ownership = $7M ÷ $49M = 14.3%. If the founders held 75% before the round, their new ownership = 75% × (1 − 14.3%) = 64.3%. The pre-money ($42M) is the agreed value of the business before the capital arrives. It is what the revenue multiple, comparable analysis, or DCF produces before you add any new investment to the calculation.
Is DCF pre-money or post-money?
DCF produces a pre-money valuation. The model values the company's projected future cash flows independently of any incoming investment. The result is an intrinsic enterprise value — what the business is worth based on what it can generate. Post-money is derived afterward by adding the proposed investment. The same is true of ARR multiples and comparable transaction analysis. All standard valuation methods anchor on a pre-money figure. You convert to post-money by adding the investment, which is a separate, mechanical step.
How do you convert pre-money to post-money valuation?
Post-money = pre-money + investment. There is no conversion factor or ratio. The only complexity arises when the "investment amount" includes SAFE conversions, convertible note principal plus accrued interest, or multiple investors closing at different times. In those cases, sum all forms of new capital entering the company — including converting instruments — and add that total to the agreed pre-money. The result is your post-money. For a SAFE-heavy cap table, run the full conversion model to see what the effective post-money looks like after every instrument converts, not just the new priced equity.
Modeling the total dilution before the term sheet arrives
Pre-money and post-money are not just vocabulary. They determine how much of your company you retain, what your effective valuation is after option pool mechanics are applied, and what trajectory you're locking yourself into for the next fundraise.
The formula is simple. The negotiation complexity comes from hidden variables: option pool timing, SAFE stacking, fully diluted versus basic share counts, and the compounding effect of liquidation preferences in an exit below your post-money valuation.
Your job before any term sheet conversation is to run the full model — not just the headline pre-money number. Know your effective pre-money after pool creation. Know your total SAFE dilution. Know the implied growth trajectory you're committing to by accepting the current round's terms.
If you want a working model that connects your current ARR, unit economics, and cap table structure to defensible valuation ranges and round-by-round dilution scenarios, book a working session with Fiscallion. We'll build the model together, before you walk into the negotiation.
