
Most deals that fall apart in due diligence don't collapse because the business is bad. They collapse because the numbers weren't organized, the assumptions weren't documented, and the investor found a gap the founder couldn't explain on the spot.
Due diligence is not the moment to discover your own metrics. It's the moment to defend a story you've already stress-tested. The difference between founders who close quickly and founders who drag through eight weeks of back-and-forth is almost always preparation quality — not company quality.
This guide gives you the full due diligence checklist across every category investors examine at Series A through Series C, with specific attention to the financial and FP&A layers where most SaaS deals stall.
Key takeaways
- Investors are verifying coherence, not just completeness. A model that doesn't reconcile with your bank statements will create more friction than a messy cap table with a clear explanation.
- Financial model gaps and unit economics issues cause the majority of deal-stage friction at Series A and Series B/C — not legal or HR problems.
- The fastest way to pass due diligence is to build your data room before you start fundraising, not after you receive a term sheet.
- Most founders entering diligence don't have a documentation problem — they have an assumptions-ownership problem. Someone needs to own every input.
What we'll cover
- What due diligence actually tests at each stage
- The complete checklist: corporate, financial, product, customers, people, legal
- The financial layer in depth — where most SaaS deals stall
- What your data room structure should look like
- Common mistakes that slow or kill deals — and what to do instead
- How to run the process without losing three months of operational momentum
What investors are actually measuring
Due diligence is not a compliance exercise. Investors are trying to answer three questions:
- Is this company what it says it is?
- Where are the risks I'm not being told about?
- Does this team understand its own business well enough to allocate capital well?
The third question is the one most founders underestimate. An investor who sees a model full of flat-line assumptions, or a founder who can't explain why net revenue retention moved from 108% to 94% last quarter, doesn't just flag a metric problem. They flag a leadership problem.
At Series A, the bar is: organized, honest, and directionally sound. At Series B and Series C, the bar shifts to: defensible assumptions, clean unit economics by cohort, and a financial model that connects to your operating plan. The documents matter. The explanations matter more.
As a16z's 16 Startup Metrics framework makes clear, investors aren't just looking for good numbers — they're looking for founders who understand why the numbers are what they are and can speak to the inputs behind them.
Depth increases significantly by stage
The complete due diligence checklist
The six categories below are what every serious VC or growth-equity investor will work through. Organize your data room around them.
Category 1: Corporate foundation
This is the fastest category to clean up and the most damaging to leave messy. A single unresolved co-founder equity issue or a missing IP assignment can pause a term sheet for weeks.
Documents required:
- Certificate of incorporation, bylaws, and all amendments
- Shareholder agreements and voting agreements
- Board consents and meeting minutes for all significant decisions (fundraising, option grants, major contracts)
- Cap table - fully diluted, including SAFEs, convertible notes, option pool, and any warrants
- All prior financing documents: term sheets, stock purchase agreements, side letters
- Founder vesting agreements, including any acceleration provisions
- Option plan documents, grant schedules, exercise prices
Red flags that slow or kill deals:
- Verbal equity promises to early advisors or contractors that aren't papered
- SAFEs or convertible notes with unusual MFN provisions or side letters investors haven't seen
- Former co-founder who departed without a formal separation agreement or buyout
- Option grants that weren't properly authorized by board consent
- IP assignment agreements missing for contractors who built core product functionality
What to do before you open the data room: Have your corporate attorney run a quick audit. The cost is a few thousand dollars. The cost of a deal pause at term sheet is far higher in time, momentum, and leverage.
Category 2: Financials and FP&A
This is where the majority of Series A and Series B diligence friction lives. The chart below shows the distribution of diligence-stage deal complications by category.
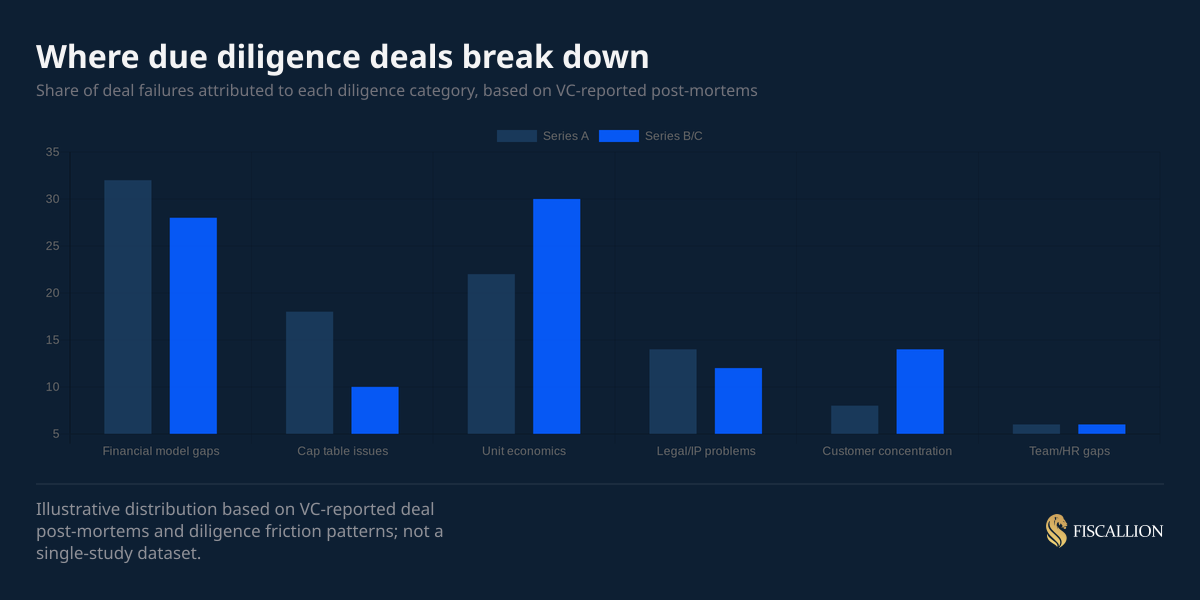
Financial model gaps and unit economics issues together account for more than half of deal complications at both stages. Legal and HR problems, which get disproportionate founder anxiety, are a distant third and fourth.
Historical financials required:
- Monthly P&L for the last 24 months minimum (36 months preferred at Series B+)
- Balance sheet as of the most recent quarter-end
- Cash flow statement — direct method preferred, indirect acceptable
- Bank statements reconciled against your accounting system
- Accounts receivable aging report
- Deferred revenue schedule (critical for SaaS with annual or multi-year contracts — if you're unclear on how this flows through your financials, see our guide on deferred revenue in SaaS)
Forward-looking financials required:
- 3-year financial model with explicit assumptions tab
- At least three scenarios: base, upside, downside
- Monthly granularity for year 1, quarterly for years 2-3
- Headcount plan by function and role, mapped to the financial model
- Runway calculation using net burn on a 3-month trailing average
Metrics package required:
- MRR/ARR bridge: new, expansion, contraction, churn, net new
- Gross revenue retention (GRR) and net revenue retention (NRR) by cohort
- CAC by channel — not a blended number
- CAC payback period (gross margin-adjusted)
- LTV by cohort and customer segment — not a single average
- Gross margin by revenue line
- Sales efficiency ratio or magic number
The assumption ownership test: Every forward-looking input in your model needs an owner and a rationale. "We assume 15% monthly growth" is not an assumption — it's a wish. "We assume 15% monthly growth based on Q3 and Q4 trailing conversion rates from inbound, which averaged 12-18% over the last two quarters" is an assumption an investor can interrogate and accept. The former creates skepticism. The latter creates conversation.
Category 3: Product, technology, and security
Technical diligence has become materially more rigorous at Series A and above. Investors increasingly have technical advisors or operating partners reviewing code quality, architecture decisions, and security posture.
Product and technology documents required:
- Product roadmap (current quarter and next two quarters minimum)
- Architecture diagram — current state, not a planned future state
- Hosting and infrastructure description: cloud provider, regions, redundancy
- CI/CD pipeline description and release cadence
- Uptime and incident history for the last 12 months
- SLA commitments in customer contracts vs. actual uptime performance
Security and compliance documents:
- SOC 2 Type II report (if completed) or in-progress timeline
- GDPR/CCPA data processing agreements (if applicable)
- Privacy policy and terms of service
- Data retention and deletion policies
- Access control and permissions model documentation
For AI-native products (increasingly common at Series A):
- Model cards or equivalent documentation for any proprietary models
- Description of how customer data flows through AI features and what is retained
- Third-party API dependencies and their data handling policies
- Training data sourcing and licensing documentation
You don't need a 40-page security report. You need to show you've made deliberate decisions, not default settings.
Category 4: Customers and revenue quality
This section answers the question investors care about most: is the revenue real, durable, and repeatable?
Documents and data required:
- Full customer list with ARR, start date, contract end date, and renewal status
- Top 10-20 customers as a percentage of total ARR (revenue concentration analysis)
- Contract samples: MSA, order forms, any custom or non-standard terms
- Churn log: who left, when, why, and what happened after
- Pipeline snapshot with stage, ARR, probability, and expected close date
- NPS or CSAT data if available
- Cohort retention chart by ARR
What investors are looking for:
- No single customer above 15-20% of ARR at Series A (higher at earlier stages)
- Gross revenue retention above 85% (90%+ preferred at Series B)
- Net revenue retention above 100% (110%+ is the benchmark that changes a conversation)
- Pipeline coverage ratio of 3-4x for the current quarter
SaaS Capital's 2025 retention research confirms that NRR benchmarks are most meaningfully segmented by ACV — not company size or industry — meaning you need to benchmark your retention against your own pricing tier, not the SaaS market at large. A useful breakdown by ARR stage and ACV is covered in our net revenue retention benchmark guide.
Revenue concentration is the issue most founders underestimate. A SaaS company at $8M ARR with one customer at $2M of that is not a $8M ARR company for diligence purposes - it's a $2M customer-dependent business with $6M of supporting revenue. Investors will model it that way.
Category 5: Team and organization
Documents required:
- Org chart (current and 12-month planned)
- Headcount plan with role, function, start date, and cost
- Employee agreements and offer letters for all current team members
- Contractor and consultant agreements
- Option grant schedule and vesting status for all employees
- Equity agreements for any departing employees
- Benefits summary
What investors are evaluating:
At Series A, the primary question is team completeness relative to the next stage. Do you have the functional leaders you need to execute the next 18 months of the plan, or are you one departure away from a critical gap?
At Series B and C, the question shifts to organizational depth. Can this company hire 30 people without the founder becoming a bottleneck in every interview and onboarding decision?
Key red flag: a headcount plan that doesn't connect to the financial model. If your model shows 25% revenue growth and your headcount plan shows flat hiring in sales and customer success, the model isn't credible. Someone needs to own the reconciliation between growth assumptions and headcount inputs.
Category 6: Legal, compliance, and contracts
Documents required:
- All material customer contracts (any contract above 5% of ARR)
- Vendor and supplier agreements with material financial commitments
- Office leases and other real property agreements
- Intellectual property portfolio: trademarks, patents, domain registrations
- IP assignment agreements for all founders, employees, and contractors
- Pending or threatened litigation documentation
- Regulatory compliance documentation (varies by industry and geography)
Specific items that stall deals:
- Customer contracts with unusual termination-for-convenience clauses that create churn risk
- Vendor agreements with auto-renewal and penalty provisions that affect burn projections
- Missing or incomplete IP assignments from contractors who wrote early code
- Equity or compensation promises in verbal agreements or casual email threads that aren't formalized
The financial model is where most SaaS deals actually slow down
The gap Fiscallion most often sees when working with founders preparing for fundraising is not missing documents — it's missing assumptions. The model exists, but no one owns the inputs.
An investor reviewing your three-year model will run stress tests within the first 20 minutes. They'll drop your growth rate by 5 points, extend your sales cycle by 30 days, and model a 3-point increase in churn. If your model hasn't been built with scenario infrastructure, it breaks. And when it breaks, the conversation shifts from "what's the right growth rate to model" to "is this team in control of their own financial picture."
The five financial model problems that generate the most investor friction
1. Flat-line burn assumptions
A model that projects $200K/month burn for 36 months, flat, is not a real model. Burn is not flat. It increases with headcount, software costs, and market expansion. If your model assumes flat burn while also projecting 3x revenue growth, the investor sees a contradiction.
Fix: Model burn bottom-up by headcount. Each hire has a salary, a start date, a benefits load factor (typically 15-20% on top of base), and equipment/software costs. That model is defensible. Our SaaS financial model template guide walks through how to build headcount-driven cost structure that holds up under investor scrutiny.
2. Single-point CAC with no channel breakdown
A blended CAC of $4,200 tells an investor almost nothing. If paid search CAC is $11,000, inbound organic CAC is $1,800, and outbound CAC is $7,500, the blended number masks a completely different story about where you're actually growing efficiently.
Fix: Break CAC by channel. Show each channel's spend, attributed new ARR, and CAC. Then show the channel mix trend over 12 months. That's a diligence-grade presentation. The problem with blended CAC payback numbers is covered in depth in why your blended CAC payback is lying to you — a pattern that surfaces consistently in pre-fundraise audits. OpenView's research on CAC payback confirms that channel-level CAC is one of the first things sophisticated growth-stage investors ask for.
3. NRR and GRR not calculated on the same cohort basis
Investors at Series B+ will ask you to walk through your cohort retention model. If your NRR is calculated on a trailing 12-month basis for all customers and your GRR is calculated on a rolling quarter basis for enterprise-only customers, the numbers aren't comparable and you can't use them together to defend your revenue model.
Fix: Define the exact cohort methodology for every retention metric. Lock it. Document it. Use it consistently across every presentation, board deck, and data room document. Our SaaS cohort analysis guide covers how to structure the cohort table so it's both internally consistent and investor-legible.
4. Runway calculation that doesn't match the model
If your data room says you have 18 months of runway and your model implies 14 months under any reasonable stress scenario, the investor will find it. They'll assume the 18-month number is the one you want them to believe and the 14-month number is the one that's real.
Fix: Reconcile the runway number explicitly to the model. State the burn rate, the cash balance, and the method (trailing average, forward projection, or current period). As covered in the startup runway calculation guide, the most defensible presentation uses net burn on a 3-month trailing average and states the assumptions explicitly.
5. No scenario infrastructure
A single-scenario model signals that you haven't pressure-tested your own assumptions. Every serious investor at Series A and above will want to see a downside case and understand the decisions you'd make in it. "If growth comes in 30% below plan, what do you cut first and what does that do to runway?" is a question you should be able to answer in the room, with a model to back it up.
Fix: Build at minimum a base case and a downside case. The downside case should show at least 18 months of runway with a credible set of cost responses. The upside case is optional — investors are far more interested in how you think about the downside than how optimistic you can be.
What your data room structure should look like
A well-organized data room signals the same thing as a clean set of board materials: this team is in control. A disorganized data room — files named "final_v7_ACTUAL_USE_THIS.xlsx", folders with no clear logic, documents missing dates — signals the opposite.
a16z published a practical insider's guide to data rooms that outlines what sophisticated investors expect to find — and more importantly, what absence of organization communicates about how a team runs its business. The structure below aligns with that standard and maps to how investors actually work through diligence.
Recommended folder structure
01 - Corporate and cap table
    ├── Incorporation documents
    ├── Cap table (fully diluted)
    ├── Shareholder agreements
    └── Board consents and minutes
02 - Financials and metrics
├── Historical P&L (24-month monthly)
├── Balance sheet
├── Cash flow statement
├── Financial model (3-year, with assumptions tab)
├── Metrics dashboard or MRR bridge
└── Runway calculation


03 - Legal and contracts
├── Material customer contracts
├── IP assignments (founders, employees, contractors)
├── Vendor agreements
└── Litigation disclosure


04 - Product and technology
├── Architecture overview
├── Security posture / SOC 2 (if applicable)
└── Roadmap


05 - Customers and GTM
├── Customer list with ARR and contract dates
├── Churn log
├── Pipeline snapshot
└── Cohort retention chart


06 - People and HR
├── Org chart
├── Headcount plan
└── Option grant schedule


07 - Board and investor materials
├── Last 3 board decks
└── Investor updates (last 6 months)Use version-dated filenames: 2026-04_Financial-Model.xlsx is better than Model_v3_Final.xlsx. Give investors view-only access with an NDA in place. Maintain an audit log of who viewed what.
Build the data room before you start raising
The most common mistake is building the data room reactively — after you receive interest or a term sheet. That puts you in the position of assembling documents under time pressure while also managing investor conversations, scheduling calls, and negotiating terms.
Build the data room when you're 60-90 days away from starting outreach. Populate it systematically. Flag the gaps and address them before any investor asks.
Y Combinator's Series A diligence checklist — one of the most referenced frameworks in the ecosystem — shows how comprehensive the document list actually is when you map it out. Most founders seeing it for the first time significantly underestimate the assembly time required.
The founders who close fastest are not the ones with the cleanest businesses. They're the ones who are most organized about communicating what they have.
Common mistakes that slow or kill deals
Mistake 1: Treating due diligence as a document-gathering exercise
The documents are evidence. The real test is whether you can explain them, defend the assumptions behind them, and contextualize the gaps. Investors have seen hundreds of data rooms. They can tell the difference between a founder who built the model and a founder who handed it off to a consultant and never read it.
Replace with: Know every major assumption in your financial model. Be able to explain the methodology behind your NRR and CAC calculations without looking at a slide. If you built it with outside help, walk through it until you can explain any number in any cell.
Mistake 2: Hiding problems instead of contextualizing them
Every company has problems. Investors know this. What they can't tolerate is discovering a problem you knew about but didn't disclose. One large customer on a month-to-month contract, a former contractor with an unresolved IP dispute, a Q3 that came in 20% below plan - these are all manageable if you surface them with context and a clear explanation of what changed or what you're doing about it.
Replace with: Create a brief "known issues" or "context on historical performance" document. Frame each item as: what happened, what it means for the business, and what you've changed or plan to change. Investors respect founders who have clear-eyed command of their own risks.
The same problem produces opposite signals depending on who surfaces it first.
A case from a Fiscallion engagement: a company going into a Series B process had a known concentration risk — largest customer at 23% of ARR. The founder didn't fix it before raising and didn't hide it. In the first call with each investor, they put it on the table directly: "Our largest customer is 23% of ARR. Here's what we've done to reduce dependency, here's the evidence the customer is not at risk, and here's what happens to the business if they leave."
The data room framing matched — a slide titled "Customer concentration" with the numbers, the trend (down from 31% 18 months earlier), and the actions taken to diversify. No spin, no minimization. Two firms said the proactive disclosure was the reason they got comfortable with the concentration. The deal closed at the founder's target valuation.
Mistake 3: Using a blended NRR number without a cohort view
A single NRR number — even a strong one — without a cohort breakdown is not investor-grade evidence of retention. An NRR of 112% in total could be driven by one or two large expanding accounts, while the rest of the customer base is quietly contracting. Investors at Series B and C have seen this pattern enough to ask for it specifically.
Replace with: Present NRR as a cohort table. Show how each 6-month cohort of customers has grown or contracted over time. A table that shows cohort health by vintage is far more credible than a single aggregate number. McKinsey's analysis of 40 public B2B SaaS companies found that those with NRR of 120%+ had a median EV/revenue multiple of 21x compared to 9x for those below 120% — the cohort breakdown is what makes that number credible rather than questionable. More on structuring that view is in our expansion MRR guide, which covers how to decompose NRR into its components so the retention story holds up.
Mistake 4: Projecting growth without connecting it to the cost structure
A model that shows $30M ARR in three years but keeps headcount flat past year one is not a model - it's wishful thinking formatted in Excel. The growth rate and the cost structure have to be internally consistent. If you're adding 3 new enterprise customers per quarter in year 1 and 12 per quarter in year 3, you need to show the sales capacity that makes that possible.
Replace with: Build the revenue model bottom-up from the headcount plan and go-to-market capacity. The number of AEs, their ramp time, and their average quota drives new ARR. That connects the growth assumption to an operational reality.
Mistake 5: Entering diligence with an undocumented decision log
Sophisticated investors, particularly at Series B and C, want to understand how you make capital allocation decisions. If you've made significant hiring decisions, product bets, or pricing changes without documented rationale, it reads as reactive leadership. Even a short memo or board update that captures the trade-off reasoning behind major decisions is enough.
Replace with: Keep a lightweight decision log for significant capital allocation choices. One paragraph per decision: the context, the options considered, the choice made, and the expected outcome. This doesn't need to be formal - it just needs to exist.
The assumptions ownership principle
Every financial input needs an owner. Not a tool, not a model, and not a consultant — a person inside the company who can explain the number and defend the methodology.
At Fiscallion, the pre-diligence work almost always starts with an assumptions audit: going line by line through the financial model and identifying who owns each input, what the rationale is, and whether it's been back-tested against actuals. The gaps this surfaces are rarely about the numbers themselves. They're about the decisions those numbers are supposed to represent.
A burn rate projection isn't just a number. It reflects a hiring plan, a compensation philosophy, a software spend decision, and an assumption about what activities drive growth. When an investor asks "why does burn go from $400K to $650K in Q2 of year 2," the answer shouldn't be "that's when headcount scales." It should be "that reflects the addition of 4 enterprise AEs at an average fully-loaded cost of $180K, plus 2 customer success managers at $130K, which is the capacity model needed to support the ARR we're projecting in that period."
That's the level of assumption ownership that passes diligence at Series B and C. When ownership isn't there, the gap surfaces in a single question and ends the conversation.
Understanding your LTV to CAC ratio at the cohort level — not just as a blended number — is one of the clearest demonstrations of assumption ownership in a diligence conversation. An investor asking "what's your LTV:CAC?" isn't looking for a single ratio. They're testing whether you understand the inputs.
A case from a Fiscallion engagement: a diligence call where the investor asked the founder how they had calculated the 0.8% monthly churn assumption in their model. The founder said it was "based on cohort analysis." The investor asked which cohort, over what time period. The founder said "our customer base." The investor asked to see the underlying data.
The data didn't exist in any reproducible form. The 0.8% was a number the founder had landed on by averaging their best three months of trailing churn. The number had been used in the model so long that the founder had stopped remembering where it came from.
The investor moved on. Two days later, the founder got a polite email saying the firm was passing — citing concerns about model defensibility and assumption rigor.
The pre-diligence readiness checklist
Use this as your internal audit, 60-90 days before you start fundraising outreach.
Corporate and legal
- Cap table is fully diluted and current, including all SAFEs, notes, options, and warrants
- All founder vesting agreements are executed and filed
- IP assignment agreements exist for all founders, employees, and material contractors
- Board minutes are complete for all major decisions in the past 24 months
- No unresolved co-founder departures, verbal equity commitments, or side agreements
Financials and FP&A
- Monthly P&L is available for 24+ months and reconciles with bank statements
- Balance sheet is current and reviewed
- Deferred revenue schedule is accurate and consistent with how MRR/ARR is reported
- 3-year financial model includes an explicit assumptions tab
- Model has base, downside, and upside scenarios with stated assumptions for each
- Runway is calculated using net burn on a trailing 3-month average and reconciles to the model
- CAC is broken out by channel (not blended only)
- NRR and GRR are calculated with a documented, consistent methodology
- Cohort retention chart is available for the last 6-8 cohorts
Product and technology
- Architecture documentation exists and reflects the current state
- Uptime history for 12 months is available
- SOC 2 timeline or completed report is in place (or an explicit decision not to pursue it, with rationale)
- IP assignment from any significant third-party development work is documented
Customers and revenue
- Customer list with ARR, contract dates, and renewal status is current
- Revenue concentration analysis shows no single customer above 20% of ARR (or explains why it is)
- Churn log exists with at minimum: who left, when, and the primary reason
- Material customer contracts are accessible and reviewed for non-standard terms
Team and organization
- Headcount plan connects to the financial model (same role list, same timing, same cost assumptions)
- All current employee option grants are authorized and documented
- Any significant departures in the past 12 months have a clean paper trail
Build it before you need it
The founder who walks into due diligence with every document accessible, every assumption documented, and a clear explanation for the gaps is not presenting a perfect company. They're presenting a company that operates with financial clarity — and that's the thing investors are actually paying for when they fund a team.
The due diligence checklist above is not a bureaucratic exercise. Each item exists because investors have seen deals fail when it wasn't in place. The financial model with flat-line burn, the CAC number with no channel breakdown, the NRR figure with no cohort view, the cap table with an undocumented verbal promise — these are not technicalities. They are signals about decision quality.
Build the data room early. Own the assumptions. Document the decisions. Know your unit economics at the cohort level, not just the aggregate. And when the gaps exist — because they will — surface them with context before an investor finds them without it.
The founders who close fastest are not the ones with the cleanest companies. They're the ones who are most organized about knowing and communicating what they have.
If you're preparing for a Series A, Series B, or Series C round and want a structured audit of your financial model, data room, and metrics package before you start outreach, book a working session with Fiscallion. We work with 50+ SaaS businesses, marketplaces, and tech-enabled companies to build the financial infrastructure that passes investor scrutiny — starting with assumptions, not just documents.
