
Most SaaS companies track ACV. Very few actually use it to make a strategic decision. Typically, the number simply sits in a board deck, gets compared to a vague benchmark found in a Slack channel, and is quickly forgotten. That is a massive waste of a leading growth indicator. Average Contract Value dictates the exact sales motion your business can afford, how your CAC efficiency will evolve, and whether your upmarket strategy is generating margin or just complexity.
This guide provides the CFO-level framework to calculate ACV accurately, segment it by cohort, and transform it from a passive reporting metric into a core driver of your financial model.
What we will cover
- What ACV is and what it is not
- Is ACV annual or average? (the terminology confusion, resolved)
- How to calculate ACV - the formula, inputs, and edge cases
- ACV benchmarks by ARR stage, vertical, and funding type
- How ACV dictates your sales motion and CAC structure
- ACV growth as a strategic lever
- The 3-3-2-2-2 rule and how ACV fits into it
- The Rule of 40 and what ACV has to do with it
- Common ACV mistakes and the replacement moves
- An ACV tracking checklist
What ACV is - and what it is not
Average contract value is the annualized recurring revenue of a single customer contract, measured at the point of signature.
That sentence has three important constraints.
Annualized. A 3-year contract at $150,000 total has an ACV of $50,000 per year, not $150,000. That total value is TCV (total contract value). Conflating TCV and ACV is one of the most common reporting errors in early-stage SaaS.
Single contract. ACV is a per-deal metric. It becomes useful at the portfolio level when you aggregate across deals to find the median or mean - but the unit of measurement is the individual contract.
Recurring revenue only. Professional services, implementation fees, one-time setup charges, and hardware revenue are excluded. ACV is about the subscription value - the part of the contract that your ARR model is built on.
Here is how ACV relates to the other metrics that frequently get confused with it:
ARR is the sum of all your ACVs at a given point in time. ACV is what feeds ARR - it is the per-unit input. If your new-logo ACV is rising while churn ACVs are falling, your ARR can look fine while your customer quality is improving substantially.
Is ACV annual or average?
Both - and that is the source of most confusion.
ACV stands for Annual Contract Value. It is the annual worth of a specific contract. That is the primary and most widely accepted definition in SaaS finance.
But the metric often gets reported as the average ACV across a cohort of deals - mean or median - for a given time period. When someone says "our ACV is $35K," they almost always mean: the average or median contract value of our new-logo deals this quarter or year.
So the "average" in the phrase "average contract value" is applied secondarily - it describes how you aggregate ACVs across deals, not the definition of ACV itself.
This matters in practice. If your median new-logo ACV is $35K but your mean is $68K, you have a skewed distribution - probably a handful of large enterprise deals pulling the average up while the majority of your deals close at sub-$20K. Reporting only the mean hides that dynamic. Reporting only the median can obscure the contribution of a high-value enterprise segment.
The right approach: track both median and mean ACV, segmented by customer tier (SMB, mid-market, enterprise). The spread between median and mean tells you how evenly distributed your deal flow actually is.
How to calculate ACV
The basic formula
For a single contract:
ACV = Total contract value / Contract length in years
Example 1 - multi-year deal:
A customer signs a 3-year contract at $180,000 total.
ACV = $180,000 / 3 = $60,000
Example 2 - monthly contract:
A customer is on a $4,000/month plan with no fixed term.
ACV = $4,000 × 12 = $48,000
Example 3 - annual with one-time setup:
A customer pays $36,000/year plus a $5,000 onboarding fee.
ACV = $36,000 (the onboarding fee is excluded - it is not recurring)
Calculating portfolio-level ACV
To find your median or mean ACV across a period:
Mean ACV = Sum of all individual ACVs / Number of contracts
Median ACV = The middle value when all ACVs are sorted by size
Use median for internal decisions and benchmarking. Use mean when investors or board members ask, but disclose the skew if there is one.
Edge cases that distort ACV calculations
Usage-based contracts. If pricing is consumption-based with no committed minimum, you have no ACV at signature - only an expected ACV based on usage estimates. Track committed ACV (the contractual minimum) separately from realized ACV (what they actually spend). Both matter; neither alone is sufficient.
Multi-product deals. If a customer buys Product A at $30K and Product B at $20K in one contract, the ACV is $50K. If those are separate contracts with separate renewal dates, they are two separate ACVs.
Discounted first-year pricing. Some companies discount Year 1 and escalate in Years 2+. Your ACV at signature reflects Year 1. Your long-run ACV is higher. Both should be tracked. Board and investor metrics should clearly state which one you are reporting.
Partial-year contracts. A customer who signs mid-year will have a partial-year revenue contribution in the first year. Their ACV remains the annualized value - do not reduce it to reflect the partial contribution. That is what ARR and recognized revenue are for.
ACV benchmarks by ARR stage, vertical, and funding type
According to SaaS Capital's 2025 Annual Survey — covering more than 1,000 private B2B SaaS companies — the median ACV was $26,265, up from $22,357 the prior year. But that blended median is close to meaningless for any specific company, because the distribution is extremely wide.
ACV by ARR stage
The relationship between ARR scale and ACV is directional but not perfectly linear.
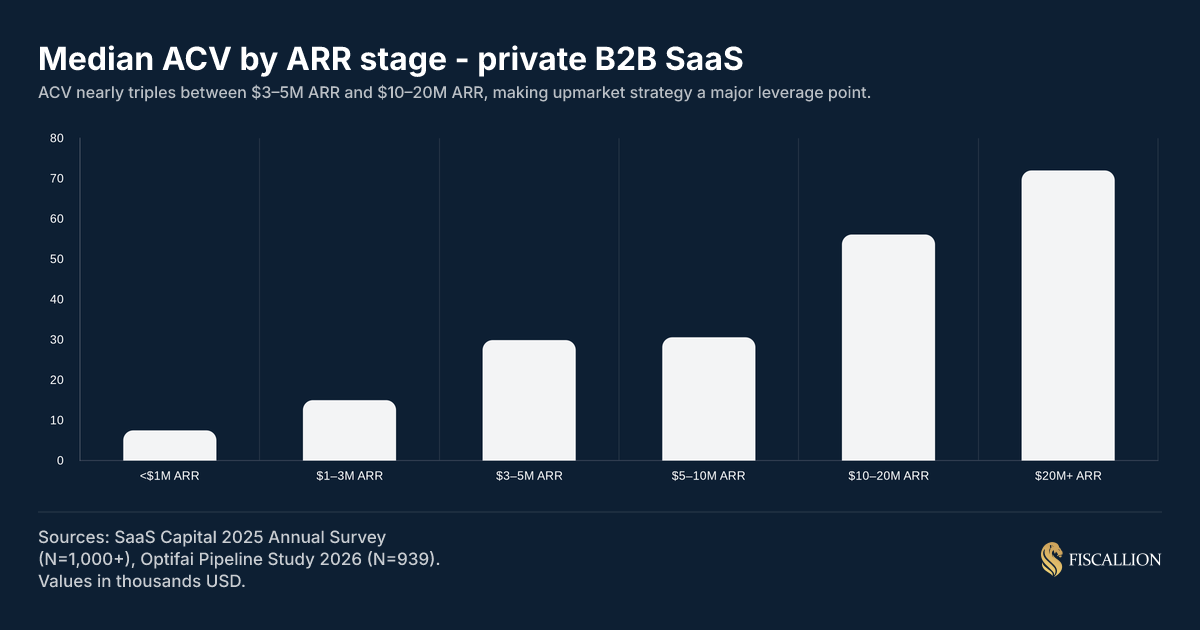
Sources: SaaS Capital 2025 Annual Survey (N=1,000+), Optifai Pipeline Study 2026 (N=939).
The $10-20M ARR band is where ACV tends to accelerate most sharply. Companies that have built a credible enterprise motion — with references, robust onboarding, and a solution that withstands procurement scrutiny — often see ACV nearly double within a two-year window. SaaS Capital's data confirms this: companies in the $10-20M ARR band reported a median ACV of $56,101 in 2024, up from $26,738 just a year prior.
If you are at $8-12M ARR and your ACV has been flat for three or four quarters, that is worth investigating. It often signals either a pricing problem, an ICP drift toward smaller buyers, or a sales motion that is not qualifying for enterprise.
ACV by vertical
Vertical determines the ceiling more than most founders realize. A horizontal SaaS company selling productivity tooling will not reach the same ACV as an enterprise security platform — not because of sales execution, but because the buyer, budget, and procurement process are structurally different.
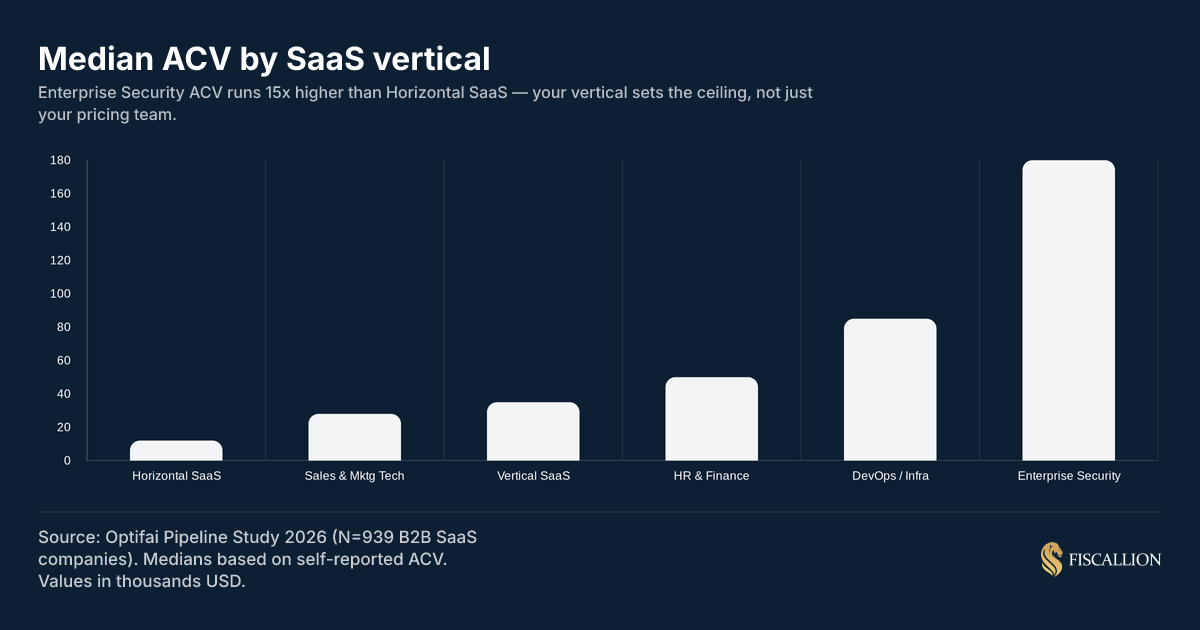
Source: Optifai Pipeline Study 2026 (N=939 B2B SaaS companies).
If your ACV is well below your vertical median, that is a pricing or ICP signal — not a benchmark to shrug off. If your ACV is above the vertical median at a given ARR stage, you are likely building into an enterprise motion faster than peers, which has direct implications for sales cycle, headcount requirements, and CAC payback.
ACV by funding type
SaaS Capital's 2025 data splits private companies into bootstrapped and equity-backed cohorts:
The gap is explained less by pricing strategy and more by investment level in GTM and product expansion. Equity-backed companies spend more to move upmarket faster. Bootstrapped companies tend to optimize for margin efficiency - which usually means staying with customers who have lower procurement friction (and therefore lower ACV potential).
Neither is inherently better. But the implications are different. A bootstrapped company at $4M ARR with a $23K ACV has different CAC payback math than an equity-backed company at $10M ARR with a $35K ACV. Conflating the benchmarks creates bad comparisons.
ACV and net revenue retention
One relationship that rarely gets enough attention: higher ACV companies consistently report higher NRR. SaaS Capital's data shows companies with NRR between 100–110% carry a median ACV of $44,073 — nearly double the $21,017 median for companies with NRR below 90%. The pattern holds even adjusting for company size.
The mechanism is structural. Higher ACV customers tend to buy broader platforms, have more stakeholders engaged, and are more likely to expand into adjacent modules or seats. If your NRR is stuck below 100% and your ACV is in the sub-$20K range, those two signals often have the same root cause: a product footprint that is too narrow for genuine expansion.
ACV dictates your required sales motion
This is where ACV moves from a reporting metric to a decision tool. Your ACV range determines what your customer acquisition cost can be, what sales team structure is sustainable, and what payback periods are realistic.
The relationship is not flexible — it is structural:
Source: Optifai Pipeline Study 2026. CAC payback assumes 80% gross margin. Actual payback varies by churn rate and expansion revenue.
While chasing massive enterprise contracts dramatically boosts your headline ACV, founders heavily underestimate the operational friction required to actually clear procurement. If you do not account for the hidden drain on senior team bandwidth, these landmark deals can quickly become margin-negative.
The mistake that causes the most damage at $5-20M ARR: building a field sales infrastructure — multiple AEs, a VP of Sales, SDRs — while still closing deals at a $15-20K ACV. The CAC math cannot work. You end up with salespeople who cannot hit quota because the deal economics do not support their cost. Then you blame the rep or the manager, when the actual problem is that the ACV and the motion are mismatched.
If your median new-logo ACV is below $25K, the inside sales model with tight SDR-to-AE ratios is likely the correct motion. If it is consistently above $50K, you need specialist enterprise AEs and a different pipeline qualification framework. The ACV number tells you which org design is defensible — not the other way around.
ACV growth as a strategic lever
Across more than 1,000 private SaaS companies, the data shows a consistent pattern: companies with rising ACV grow faster than those with flat or declining deal sizes. This holds even after controlling for ARR stage. Research by Randall Lucas on changing ACVs as a hidden control lever of SaaS company value — cited by SaaS Capital — confirms that higher ACV growth correlates directly with faster ARR growth, while flat or shrinking ACVs correlate with the slowest-growing companies in the dataset.
The mechanism is straightforward. Higher ACV means:
- More ARR added per deal closed, without proportionally higher CAC
- Longer average contract terms (customers paying more tend to commit to longer deals)
- Higher NRR potential, because expansion revenue is often proportional to the initial contract value
- Better gross margin stability, since implementation and support costs are more diluted against a larger revenue base
This pattern — sometimes called "ACV creep" in the data — shows up almost universally as companies mature. According to Optifai's benchmark research, ACV rises 15-25% year-over-year even without a deliberate upmarket strategy, driven by feature maturity, stronger reference customers, and a sales team that gradually self-selects for higher-value deals.
The risk is when ACV creep happens accidentally. Sales cycles lengthen without teams noticing. Win rates fall in the SMB segment that used to be core. Support and CS teams start getting overwhelmed by enterprise-level demands that the current infrastructure was not built for.
According to Aleksandar Stojanovic, CEO & Founder at Fiscallion, accidental upmarket drift is almost always a comp-plan-and-excitement problem before it is a strategy problem. "Reps chase larger deals because they're more exciting, but the upmarket deals end up worse on every efficiency dimension," Stojanovic warns.
His playbook requires segmenting all GTM metrics by deal size and realigning the compensation plan. "Either commit to moving upmarket and invest in the architecture enterprise requires, or re-anchor on the core. Drifting upmarket without the supporting architecture is the worst of both worlds."
The check: measure ACV alongside sales cycle length (in days), win rate by deal size band, and customer success cost per account. If ACV is rising but so is sales cycle length and CS cost per account, the upmarket move may not yet be margin-positive. That is the data you need before doubling down on an enterprise motion.
The 3-3-2-2-2 rule and what ACV has to do with it
The 3-3-2-2-2 rule is a SaaS revenue growth trajectory — not a profitability metric. Starting from $1M ARR, it targets tripling revenue for two consecutive years, then doubling for three:
It is the more capital-efficient evolution of the T2D3 framework from the mid-2010s, adapted for a market where investors now demand growth plus efficiency — not growth in isolation. For a full breakdown of the framework and how it connects to the Rule of 40 in SaaS, including the formula and current benchmarks by ARR stage, see Fiscallion's dedicated guide.
ACV is one of the highest-leverage inputs to whether you can hit this trajectory. Here is why.
To triple from $1M to $3M ARR, you can do it through volume alone — acquiring many low-ACV customers quickly. But to triple from $3M to $9M ARR, and then double from $9M to $18M, pure volume rarely scales fast enough. The CAC economics get strained, and headcount requirements to support hundreds of low-ACV customers compound your cost structure.
The companies that sustain 3-3-2-2-2 trajectories typically combine volume in early years with deliberate ACV expansion in later years. By Year 3 or 4, they are not just acquiring more customers — they are acquiring larger ones. ACV expansion is what makes the doubling years achievable without proportionally tripling the sales team.
The practical implication for your planning: if you are currently at $5-10M ARR and targeting a 2x growth year, model two scenarios — one where you hit the target through volume (more deals at flat ACV) and one where you hit it through ACV lift (fewer deals at higher ACV). The second scenario usually requires less CAC spend and produces better gross margin. The first scenario is often the default path teams take because it looks like execution they already understand.
The 3-3-2-2-2 rule is a board and investor conversation framework. ACV trajectory is the underlying engine. Presenting your growth path without showing how ACV is expected to evolve tells only half the story.
The Rule of 40 and ACV's role in it
The Rule of 40 is calculated as:
Rule of 40 score = ARR growth rate (%) + Profit margin (%)
A score of 40 or above is the standard investor filter for a healthy, scalable SaaS business. The metric was originally articulated by Brad Feld in 2015 after hearing it from a late-stage investor, and it has since become one of the most widely used efficiency benchmarks in SaaS. The two inputs — growth rate and margin — are both affected by your ACV trajectory.
Growth component. Higher ACV per deal accelerates ARR growth without requiring proportional CAC increases. If your ACV rises from $25K to $40K on the same volume of closed deals, your ARR grows 60% faster — directly lifting the growth component of your Rule of 40 score. This is why ACV expansion is often the most capital-efficient path to improving the growth rate component.
Profitability component. ACV affects gross margin indirectly. Higher ACV contracts typically come with longer terms and lower per-contract support load relative to revenue. A customer at $60K ACV does not require six times the CS effort of a $10K ACV customer. As ACV rises, the gross margin profile of the book of business tends to improve — lifting the profitability component.
One calibration point worth knowing: BCG's 2025 benchmark data found that only 9% of companies with less than $30M ARR beat the Rule of 40. Falling short at that stage is the norm, not the exception. What matters is whether ACV is moving in a direction that makes the growth component durable. For more on interpreting your score and improving both components, see the SaaS quick ratio — a complementary metric that reveals whether your ARR growth is being driven by new revenue or just offset churn.
The framing for board and investor conversations: do not report ACV and Rule of 40 as separate facts. Show how ACV trajectory feeds your growth rate over the next four to six quarters, and how that translates to Rule of 40 progress. That connective tissue — the chain from ACV to ARR growth rate to Rule of 40 — is what distinguishes decision-grade FP&A from scoreboard reporting.
Common ACV mistakes and the replacement moves
Mistake 1: Reporting mean ACV without median
If you have three enterprise deals at $120K and twelve SMB deals at $10K, your mean ACV is about $37K. Your median is $10K. The mean makes your business look more enterprise than it is. Investors and board members who find this out during diligence will not be pleased.
Replacement move: report both, and segment by customer tier. Be transparent about the distribution.
Mistake 2: Including one-time fees in ACV
Implementation fees, onboarding charges, and setup costs are not recurring revenue. Including them inflates ACV and misleads your CAC payback math — because the first-year economics look better than the renewal year economics will actually be.
Replacement move: strip all non-recurring revenue from ACV calculation. Track professional services separately as a distinct revenue line.
Mistake 3: Treating ACV as independent of sales motion
Some teams celebrate rising ACV without asking whether the sales infrastructure can actually support it. A $45K ACV deal requires a different qualification process, longer sales cycle, and different close motion than a $12K deal. If your team is not built for it, rising ACV creates a pipeline of stalled deals.
Replacement move: before pursuing deliberate ACV expansion, model the required CAC and sales cycle changes. Confirm that payback periods remain within your acceptable range.
Mistake 4: Ignoring ACV by cohort
Blended ACV hides which segments are pulling the number up or down. An overall median ACV of $30K can coexist with a declining SMB cohort at $9K and a growing mid-market cohort at $52K. The blend looks stable while the underlying mix is shifting.
Replacement move: run ACV analysis by customer tier and by acquisition cohort (quarter of close). Both dimensions reveal things the blended number conceals.
Mistake 5: Setting quota without anchoring to ACV
Sales reps quota'd on a revenue number without reference to ACV will often take whatever deal closes fastest. That typically means lower ACV deals, shorter sales cycles, and worse long-run economics. Over time, this drift lowers your median ACV without anyone making an explicit decision to go downmarket. This dynamic also shows up in SaaS valuation multiples — acquirers and investors discount businesses whose ACV has been drifting down without a deliberate strategic reason.
Replacement move: set both a revenue quota and a minimum ACV threshold. If the threshold is $20K, deals below it should require manager approval or be declined. The threshold enforces ICP discipline at the deal level.
ACV tracking checklist
Use this as the standard for how ACV should be measured and reported inside your business:
Definition layer (who owns inputs)
- ACV definition is documented — what is included, what is excluded
- Non-recurring fees are explicitly excluded from all ACV calculations
- Multi-year contracts are annualized correctly
- Usage-based contracts distinguish committed ACV from expected ACV
- Partial-year contracts are annualized, not pro-rated
Calculation layer
- Median new-logo ACV is tracked by quarter
- Mean new-logo ACV is tracked alongside median, with distribution noted
- ACV is segmented by customer tier (SMB, mid-market, enterprise)
- ACV is segmented by acquisition channel
- Expansion ACV is tracked separately from new-logo ACV
Interpretation layer
- ACV trend is compared against your vertical benchmark and ARR-stage peer group
- ACV growth rate is reviewed alongside sales cycle length and win rate
- CS cost per account is monitored relative to ACV band
- ACV movement is connected to ARR growth rate projections in the financial model
Decision layer
- New sales motions are evaluated against ACV-to-CAC ratio before launch
- Minimum ACV threshold is set and enforced in deal approval process
- Board updates include ACV trajectory alongside ARR, NRR, and gross margin
Frequently asked questions
What is average contract value in SaaS?
Average contract value (ACV) is the annualized value of a single SaaS customer contract, excluding one-time fees. For a 3-year contract worth $120,000 in total, the ACV is $40,000. For a $4,000/month subscription, the ACV is $48,000. At the portfolio level, ACV is typically expressed as the median or mean across a cohort of new-logo deals in a given period. It differs from ARR (which aggregates all customer ACVs), TCV (the total value over the full contract term), and average deal size (which may include non-recurring elements). ACV is most useful as a signal of your required sales motion, your CAC efficiency range, and the maturity of your upmarket strategy.
Is ACV annual or average?
ACV stands for Annual Contract Value — so "annual" is part of the definition, not the average. The "annual" refers to the annualized worth of a single contract: a 3-year $150,000 deal has an ACV of $50,000 per year. "Average" enters the picture when you aggregate ACVs across many deals to find a median or mean for a given period. So when someone says "our ACV is $35K," they typically mean the average or median Annual Contract Value across recent deals. Both uses of the term are common. The key is to be explicit about which one you are reporting: the value of a specific contract, or the central tendency across a deal cohort.
What is the 3-3-2-2-2 rule of SaaS?
The 3-3-2-2-2 rule is a SaaS revenue growth benchmark used primarily by venture-backed founders as a planning framework. Starting from approximately $1M ARR, it targets tripling revenue in Year 1 ($1M to $3M), tripling again in Year 2 ($3M to $9M), then doubling in each of Years 3, 4, and 5 — reaching roughly $72M ARR over five years. It is the more capital-efficient evolution of the T2D3 framework, and it reflects the post-2022 shift toward sustainable growth rather than growth at any cost. The rule is not universal: it is most relevant for VC-backed companies targeting large-scale outcomes. Bootstrapped companies or niche vertical SaaS businesses often follow different and equally valid growth trajectories. From an ACV perspective, companies that sustain 3-3-2-2-2 trajectories typically combine volume acquisition in early years with deliberate ACV expansion in the doubling years — because volume alone rarely sustains the required growth rates without compressing margin.
What is the Rule of 40 in SaaS valuation?
The Rule of 40 states that a healthy, investable SaaS business should have an ARR growth rate (%) plus a profit margin (%) that equals or exceeds 40. A company growing at 35% with a 10% free cash flow margin scores 45 — above the threshold. A company growing at 15% with a -10% margin scores 5 — well below. The metric was popularized by Brad Feld in 2015 as a shorthand for evaluating whether a SaaS company was scaling sustainably. For the profitability input, free cash flow margin is increasingly preferred over EBITDA margin, because FCF is harder to adjust away and more directly reflects capital efficiency. According to BCG's 2025 benchmark data, only 9% of private SaaS companies with under $30M ARR beat the Rule of 40 — so falling short at early and mid-stage is typical, not a red flag by itself. What matters is the trend direction and the components driving the score. ACV connects to the Rule of 40 through both inputs: rising ACV improves ARR growth without proportional CAC increases, and higher ACV contracts tend to support better gross margins and lower per-account support costs.
Turning ACV from a slide metric into a decision input
ACV is not a vanity metric. It is the per-deal input that determines what sales motion you can afford, whether your growth trajectory is sustainable, and how your unit economics will evolve as you scale.
The most common failure is treating ACV as a reported output rather than a decision input. If your ACV is flat for three quarters while your peer cohort is moving upmarket, that is a pricing or ICP signal — not a stable benchmark. If your ACV is rising but your sales cycle is doubling and your win rate is falling, the upmarket move is creating cost before it creates margin.
The metric becomes useful when it is tracked by tier, compared against the right peer group, connected to your CAC and payback model, and woven into your ARR growth projections — not when it sits alone on a slide next to a blended number from a survey you found on Google.
At Fiscallion, the FP&A work we do with founders at the $5-30M ARR stage almost always includes rebuilding ACV analysis from scratch: cleaning up what is included, segmenting by customer tier, and connecting it explicitly to the growth assumptions in the financial model. If your ACV analysis does not answer "what sales motion can we afford and at what growth rate does the math work," it is not done yet.
Audit your ACV definition and model - book a working session with Fiscallion.
