

Your ARR is growing. The board deck shows a positive trajectory. But your finance function is quietly hemorrhaging $1 of hard-won recurring revenue for every $1.10 it adds. The SaaS quick ratio is the metric that exposes exactly that tension - and it does it with four numbers that most finance teams already have but rarely combine.
This article covers what the quick ratio actually measures, how to calculate it correctly, what the benchmarks mean at your stage, and - critically - what to do when the number is moving in the wrong direction.
Key takeaways
- The SaaS quick ratio measures the net direction of your recurring revenue by comparing MRR gained (new plus expansion) against MRR lost (churn plus contraction).
- A ratio above 4 signals healthy, efficient growth. Between 1 and 4 means you are growing but working harder than you need to. Below 1 means revenue is contracting.
- The ratio does not tell you why revenue is leaking - it tells you that it is, and by how much. The diagnostic work comes after you run the number.
- Improving the quick ratio almost always starts with churn, not acquisition. Fixing the denominator is cheaper and faster than inflating the numerator.
What the SaaS quick ratio actually measures
The quick ratio was originally a balance-sheet liquidity metric - current assets divided by current liabilities. The SaaS version, popularized by Mamoon Hamid at Social Capital, repurposes the concept entirely. It has nothing to do with liquidity. It answers one specific question: for every $1 your recurring revenue base loses to churn and downgrades, how many new dollars is it adding?
That makes it a directional metric, not an efficiency metric. It does not tell you what you spent to acquire that revenue. It does not factor in gross margin. What it does tell you is whether the recurring revenue base is expanding, holding steady, or quietly shrinking beneath the surface of a positive-looking ARR number.
That distinction matters at the $5–50M ARR stage, where the business is large enough that churn compounds meaningfully but still small enough that a few bad months can reverse twelve months of sales progress.
The difference between quick ratio and related metrics
The quick ratio is often confused with net revenue retention (NRR) and the SaaS magic number. They are related but answer different questions.
NRR looks backward at a cohort. The quick ratio looks at current-period flows. Both belong in your monthly reporting package, but they answer different questions - and conflating them will lead to the wrong diagnosis. Andreessen Horowitz's 16 Startup Metrics framework makes a related point: gross churn and net churn are not interchangeable, and blending upsells with absolute churn understates what the business is actually losing.
How to calculate the SaaS quick ratio
The formula
Quick Ratio = (New MRR + Expansion MRR) / (Churned MRR + Contraction MRR)
Four inputs. All of them come from your MRR waterfall, which you should already be tracking monthly.
Input definitions
Reactivation MRR - revenue from customers who churned and then resubscribed - is sometimes included in the numerator. Include it if it is material. If reactivations represent less than 2–3% of total new plus expansion MRR, the impact is negligible.
A worked example
Say your SaaS company closes the month with the following:
- New MRR: $150K
- Expansion MRR: $225K
- Churned MRR: $75K
- Contraction MRR: $15K
Quick Ratio = ($150K + $225K) / ($75K + $15K) = $375K / $90K = 4.2
That is a healthy number. The expansion MRR is doing real work here - it is $75K larger than the new MRR, which means your existing customer base is growing revenue without the full cost of new customer acquisition.
Now change one variable. Keep everything the same but drop expansion MRR to $45K - a common scenario when upsell motions are weak or untested.
Quick Ratio = ($150K + $45K) / ($75K + $15K) = $195K / $90K = 2.2
Same churn. Same new logo motion. But the ratio falls from 4.2 to 2.2 because expansion dried up. That is a product or CS problem masquerading as a growth problem.
ARR vs. MRR: does it matter?
No, as long as you are consistent. If your business tracks ARR, plug in ARR movements. If you track MRR, use MRR. Mixing periods - monthly inputs against annual outputs, or vice versa - is the most common calculation error and will produce a meaningless result.
Quarterly calculation
For board reporting, many companies calculate the quick ratio on a quarterly basis. Sum each input across the three months of the quarter before applying the formula. Do not average monthly ratios - that introduces noise from month-to-month seasonality.
What a good SaaS quick ratio looks like
The benchmark most frequently cited in investor conversations - and the threshold Mamoon Hamid publicly applied as an investment filter - is 4. For every $1 lost to churn and contraction, the business adds $4 in new and expansion revenue.
That benchmark is accurate but context-free. At Series A on $4M ARR, a ratio of 4 is strong. At $30M ARR with a maturing customer base, a ratio of 3.5 with low churn and high NRR may be healthier than a ratio of 5 propped up by aggressive new logo discounting.
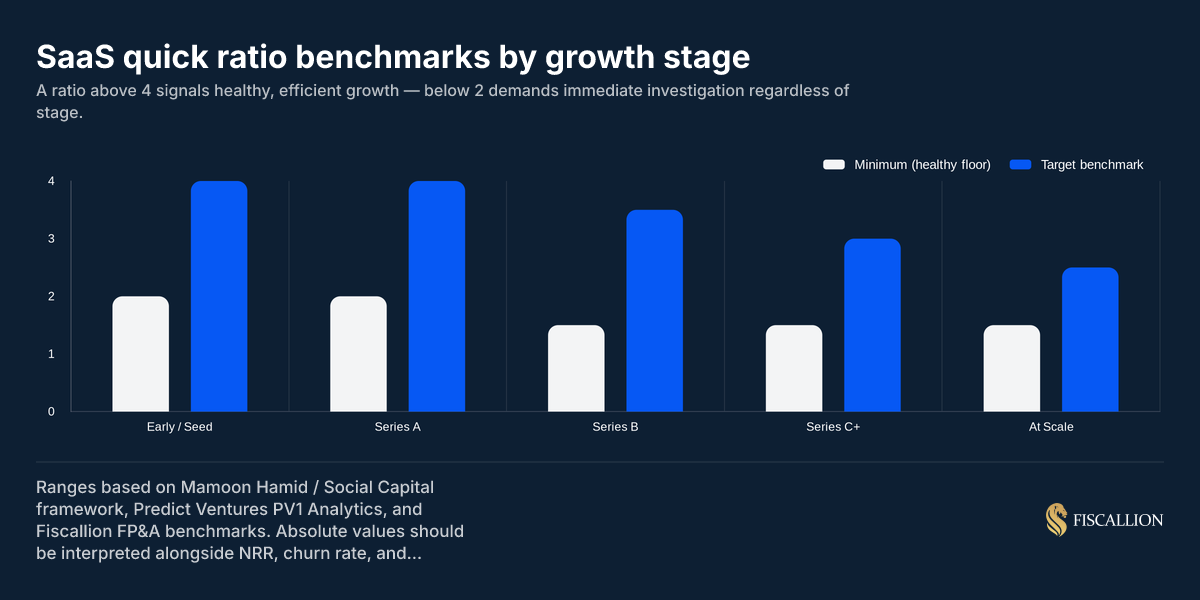
Benchmark ranges by stage
The floor drops slightly at scale because the absolute dollar volumes are higher and because NRR in a mature book of business tends to be more stable. A $100M ARR company with a 2.0 quick ratio and 110% NRR is not in trouble. The same ratio at $5M ARR with 85% NRR is a much more urgent signal. The High Alpha and OpenView 2024 SaaS Benchmarks Report - which surveyed 800+ SaaS companies - found median NRR stabilizing at 110%, with top performers reaching 120%+. That context anchors what "acceptable" NRR looks like alongside your quick ratio at each stage.
What a ratio below 1 means in practice
A quick ratio below 1 means the denominator exceeds the numerator. Churn and contraction are outpacing new and expansion revenue. If that continues for more than two months, the MRR base is contracting month over month regardless of how many new logos the sales team closes.
This is the "leaky bucket" problem in its most quantified form. It is entirely possible to report 30% new bookings growth while simultaneously losing ground on total ARR - because the existing base is eroding faster than new revenue lands.
A ratio below 1 is not automatically a crisis in month one. But it is a signal that demands an immediate audit of churn cohorts, contract timing, and contraction triggers. Not next quarter. This month.
When a company's quick ratio slips below healthy thresholds, the common operational reflex is to aggressively scale up top-of-funnel sales activities rather than pausing to fix the leaky foundation. However, piling more acquisition expense onto an unexamined retention crisis only burns cash faster while leaving the actual root cause completely untouched.
Is a quick ratio of 0.7 good?
No. A quick ratio of 0.7 means you are losing $1 of recurring revenue for every $0.70 you add. Your ARR base is contracting. The pace depends on the absolute dollar volumes, but the direction is negative. Sustained for three or more months, a 0.7 quick ratio will consume cash, erode sales team momentum, and compress runway faster than most burn models capture - because most burn models assume revenue growth, not revenue decline.
The corrective action at 0.7 is not to spend more on acquisition. It is to stop the denominator from growing. Identify the highest-churn cohorts (by segment, acquisition channel, contract structure, or tenure) and address the root cause before layering on more acquisition spend.
Four quick ratio scenarios: what the components reveal
The headline ratio can look similar across very different underlying businesses. Breaking the formula apart tells you more than the single number does.

Scenario A (QR = 1.2): Minimal expansion MRR, high churn. Sales is working hard to keep the business flat. The customer success function is absent or ineffective. This is a product-market fit or retention problem.
Scenario B (QR = 2.5): Moderate expansion, moderate churn. The business is growing but requires constant high-volume acquisition to compensate for ongoing attrition. CAC payback extends and gross dollar retention is weak.
Scenario C (QR = 4.2): Expansion MRR significantly exceeds new MRR. This is the expansion-led growth model - the highest-quality SaaS revenue profile because it grows margin dollars faster than headcount. Churn is present but manageable.
Scenario D (QR = 6.0): High new MRR, solid expansion, and well-controlled churn. This is an aggressive acquisition phase with retention holding. Sustainable only if the new logos maintain similar retention profiles to the existing cohort.
The insight here: you can arrive at a ratio of 4 through very different paths, and those paths carry different implications for CAC payback, headcount needs, and runway. Fiscallion's view is that a ratio of 3.5 driven primarily by expansion MRR is frequently more durable - and more capital-efficient - than a ratio of 5 driven almost entirely by new logo volume.
The SaaS quick ratio and the rule of 40
The rule of 40 in SaaS is a composite score: revenue growth rate (%) plus EBITDA margin (%). A score of 40 or above is considered healthy for investor-grade comparisons.
The quick ratio and the rule of 40 measure different things and should not be treated as substitutes.
- The quick ratio measures whether recurring revenue is net-growing or net-shrinking within a period. It is operational and diagnostic.
- The rule of 40 measures whether the balance between growth and profitability meets investor expectations. It is a summary efficiency score.
A company can pass the rule of 40 while running a quick ratio below 2. That happens when topline growth is high but driven by an eroding base - every new dollar costs more because churn removes dollars from the denominator. Conversely, a company can have a quick ratio of 5 while failing the rule of 40 because it is burning heavily to fuel that growth.
For private SaaS companies in 2025-2026, rule of 40 scores have been contracting across nearly all ARR tiers - primarily due to slowing growth rates, not deteriorating margins. That context matters when boards use the rule of 40 as a benchmark: the peer group is weaker, so clearing 40 today is more notable than it was in 2021.
Use both metrics in your board reporting. Let the rule of 40 frame the growth-vs-profitability trade-off. Let the quick ratio frame the health of the revenue engine itself. And for how the rule of 40 interacts with deferred revenue recognition on your balance sheet, the deferred revenue accounting implications for SaaS FP&A are worth understanding before your next board deck.
The 3-3-2-2-2 rule and what it implies for quick ratio targets
The "triple, triple, double, double, double" framework - coined by Battery Ventures' Neeraj Agrawal and often called T2D3 - maps a path from roughly $2M ARR to $100M ARR through a specific growth cadence. Agrawal published the original framework on TechCrunch and expanded on it via Battery Ventures, based on patterns he observed across Salesforce, Workday, Zendesk, and other public SaaS companies:
- Triple ARR in year one (e.g., $2M to $6M)
- Triple ARR in year two ($6M to $18M)
- Double ARR in year three ($18M to $36M)
- Double ARR in year four ($36M to $72M)
- Double ARR in year five ($72M to $144M)
This framework is a pattern, not a prescription - most companies that attempt T2D3 do not hit it, and many strong SaaS businesses never reach $100M ARR on that curve.
The implication for quick ratio: at the tripling stages ($2M–$18M ARR), rapid new logo growth can mask a low quick ratio. New MRR alone may generate a 3 or 4 ratio even with weak retention, because the denominator is small in absolute terms. As the company enters the doubling stages ($18M–$100M ARR), the base is large enough that churn compounds materially. A quick ratio of 4 becomes harder to sustain purely through new logo volume - expansion MRR must carry more of the numerator.
The practical test: if your quick ratio is above 4 but expansion MRR represents less than 20% of the numerator, you are likely in a new-logo-dependent growth model. That is fine at early stage. By Series B and beyond, it is a fragility you need to address.
What to do when the quick ratio signals a problem
The ratio identifies the symptom. These are the actions that address the cause.
1. Segment churn by cohort before doing anything else (owner: Head of CS or CEO)
Do not act on aggregate churn data. Segment by acquisition channel, contract structure (monthly vs. annual), ARR band, use case, and tenure. In most $5–30M ARR businesses, 60–70% of churn concentration will be visible in two or three cohort slices. Fixing those cohorts will move the denominator faster than any acquisition program.
As SaaStr's Jason Lemkin notes, churn benchmarks vary materially by customer segment - VSBs can churn at 3–5% per month while enterprise cohorts often show net negative churn. Blending those numbers produces a confusing aggregate that leads to the wrong fix.
2. Run a contraction MRR audit separately from a churn audit (owner: Finance or RevOps)
Churned MRR and contraction MRR are different problems. Churn is a retention failure. Contraction is often a pricing or packaging failure - customers have downgraded because the product's value-to-price ratio at their current tier is not holding. Treating them the same way in the analysis leads to the wrong fix.
Lumping full cancellations together with simple tier downgrades dilutes your data, as the two issues stem from entirely different operational failures. Contraction is rarely a failure of the product itself, but rather a structural signal that your pricing packages lack the natural flexibility required to scale cleanly with user consumption.
3. Identify the top 3 expansion triggers in your existing customer base (owner: CS + Product)
Expansion MRR does not happen by default. In most SaaS businesses at $5–30M ARR, expansion happens when a customer hits a usage threshold, hires more users, adds a second use case, or is actively prompted by a CS or sales conversation. Map the trigger. Run the motion deliberately. Adding $30K of expansion MRR per month on a base where churned plus contraction MRR is $90K moves the quick ratio from 2.5 to 3.3 without adding a single new logo.
4. Stop discounting new logo deals if contraction MRR is high (owner: CEO + Head of Sales)
Aggressive discounting to win new logos at the Series A and B stage is one of the most common root causes of a deteriorating quick ratio. Heavily discounted customers are more likely to negotiate further on renewal, downgrade at the first opportunity, or churn when the discount expires. Track the expansion and retention rates of discounted cohorts separately. The quick ratio will tell you the total impact; cohort analysis will confirm whether discounting is the driver.
5. Review contract structure if contraction MRR exceeds 20% of total denominator (owner: Finance + Sales)
If contraction MRR - downgrades without full cancellation - is disproportionately large relative to churned MRR, the signal is a pricing or packaging problem, not a product problem. Customers are not leaving; they are reducing. That often means the highest tier is overpriced relative to perceived value, or that customers were sold into a tier they did not need. Restructuring packaging to make the mid-tier more defensible is a faster fix than re-architecting the product.
6. Set a trailing 3-month quick ratio floor and escalate when it is breached (owner: CEO or Head of Finance)
Monthly quick ratio variance is noise. A single bad month driven by a large customer churn is not a structural signal. But a declining three-month trailing average is. Set a floor - 3.0 at Series A, 2.5 at Series B - and treat a breach as a formal escalation trigger, not a metric to note and move past in the board review.
Common mistakes in how teams use the quick ratio
Even sophisticated finance teams frequently miscalculate retention by relying on surface-level dashboard data. Avoid these critical operational mistakes to ensure your core retention metrics reflect actual customer behaviors and true unit economics.
Mistake 1: Reporting the quick ratio without the component breakdown
A ratio of 2.8 that is driven by strong new MRR and near-zero expansion looks identical to a 2.8 driven by moderate new MRR and solid expansion. They are very different businesses. Always show the four components alongside the headline ratio in your monthly reporting.
Replacement move: Add a simple MRR waterfall table to your monthly metrics pack. New MRR, expansion MRR, churned MRR, contraction MRR, net MRR change. The quick ratio is the summary; the waterfall is the context.
Mistake 2: Treating a declining quick ratio as a marketing or sales problem by default
When the ratio drops, the instinct is to increase acquisition spend. That is almost always the wrong first move. A declining quick ratio is more often caused by increasing churn or decreasing expansion than by insufficient new logo volume. Adding top-of-funnel to a leaking bucket accelerates cash burn without fixing the underlying issue.
Replacement move: Run the denominator analysis first. If churned plus contraction MRR has grown as a percentage of the prior month's MRR base over the last 90 days, the problem is retention, not acquisition. Fix that before adjusting GTM spend.
Mistake 3: Comparing quick ratios across stages without adjusting expectations
A Series C company growing at 35% YoY will rarely sustain a quick ratio above 4. The absolute denominator is large, expansion motions are more complex, and growth naturally decelerates. Benchmarking against early-stage targets creates false urgency. The High Alpha 2024 SaaS Benchmarks data shows top-quartile growth at 40% YoY for mature SaaS businesses - context that should calibrate your quick ratio expectations against actual peer performance.
Replacement move: Stage-adjust your benchmark. At $20M+ ARR, a quick ratio of 2.5 to 3.0 with strong NRR (115%+) is a defensible profile. Use NRR as the companion metric to contextualize the quick ratio.
Mistake 4: Excluding reactivation MRR inconsistently
Some teams include reactivation MRR in the numerator one month and exclude it the next. This creates an artificial ratio spike that misrepresents the trend. Reactivation MRR should be included consistently (or consistently excluded if it is immaterial) and labeled separately in the waterfall.
Mistake 5: Calculating the quick ratio once for a board deck and then not tracking it monthly
The quick ratio is a trailing signal. Its value is in the trend over time - are you improving, holding, or deteriorating? A single-point calculation for a fundraising deck is nearly useless without a 12-month trend line that shows the trajectory.
Replacement move: Add the quick ratio to your monthly metric close. It should take less than 15 minutes to calculate once your MRR waterfall is clean. Track it alongside NRR and net new ARR in your standard reporting cadence.
The quick ratio in board reporting: what it should and should not answer
Most board decks that include the quick ratio stop at the number. "Our quick ratio is 3.4." That is a data point, not an insight, and it is not enough for the board conversation.
The framing that makes the quick ratio useful in a board deck:
- Trend: Is it improving, stable, or declining over the last four quarters?
- Component driver: Is the change driven by the numerator (expansion or new MRR) or the denominator (churn or contraction)?
- Implication: What does the current trajectory mean for net new ARR in the next two quarters if the ratio holds?
- Trade-off: What would it cost in CS headcount, product investment, or discounting to improve the ratio by 0.5 over the next two quarters?
That last question is the one most boards want answered and most finance teams are not prepared for. It requires connecting the quick ratio to a decision about resource allocation - and that is where FP&A judgment matters more than metric definition. That same discipline applies to how SaaS valuation multiples are actually built: investors underwriting a multiple are effectively pricing the durability of the quick ratio trend, not just the current ARR number.
Quick ratio dashboard checklist
Use this as the minimum viable quick ratio reporting setup for a $5–50M ARR SaaS company:
Monthly close (always)
- New MRR this month
- Expansion MRR this month
- Churned MRR this month (full cancellations only)
- Contraction MRR this month (downgrades only)
- Quick ratio = (New + Expansion) / (Churned + Contraction)
- Trailing 3-month average quick ratio
- Month-over-month change in each component
Quarterly board pack (add)
- Quarterly quick ratio (sum of monthly inputs, not average of monthly ratios)
- 4-quarter trend chart for quick ratio
- NRR for the same period (companion metric)
- Component breakdown: what drove any change vs. prior quarter?
- Churn cohort summary: which segments drove churned MRR?
Fundraising diligence (add)
- 12-month trailing quick ratio by month
- Quick ratio by customer segment if you serve materially different ICP profiles
- Expansion MRR as a percentage of total numerator (trend over 12 months)
- ARR impact model: what happens to ARR in 12 months if quick ratio holds vs. improves by 0.5?
If you need a working structure for any of these, the SaaS financial model template guide covers how to build MRR waterfall tracking into a decision-grade model, including the quick ratio as an auto-calculated output.
Moving from surface growth to capital efficiency
The quick ratio is one of the cleaner signals in SaaS finance: four inputs, a single number, and a clear directional read on whether your recurring revenue base is growing or eroding. That clarity is also its limitation - the ratio tells you what, not why, and it tells you nothing about the cost of the growth it is measuring.
Used correctly, the quick ratio functions as an early warning system. A sustained decline - two or more quarters of downward movement - is an operational signal that demands a structured diagnosis before any change in acquisition spend. A sustained improvement, especially one driven by expansion MRR growth rather than new logo volume alone, is one of the strongest indicators of long-term capital efficiency a $5–50M ARR company can show to investors, a board, or itself.
The companies that use the quick ratio well do not just track it. They own the inputs - someone on the team is accountable for new MRR accuracy, expansion MRR attribution, and the churn and contraction data that feeds the denominator. Metric ownership at the input level is what separates a dashboard number from a decision-grade tool.
If your MRR waterfall is not clean enough to calculate the quick ratio with confidence today, that is the first problem to solve - not the ratio itself.
Audit your MRR waterfall and quick ratio inputs with Fiscallion. If the four components are not tracked consistently, the number is not reliable enough to act on. Book a working session to get your recurring revenue reporting to decision-grade accuracy.