

Most board decks report what happened. A few explain why it happened. Almost none frame what to do next - and that gap is what makes the average board meeting a history lesson instead of a decision session.
At $5M to $50M ARR, your board isn't there to audit the past. They're there to help you allocate capital, pressure-test assumptions, and approve moves that require their authority. When the deck centers on performance review, you burn through the only two hours of concentrated board attention you have each quarter on material they could have read in a pre-read memo. The asks and the trade-offs - the part that requires the room - arrive last, when attention is spent.
The fix isn't a prettier deck. It's a different architecture.
Key takeaways
- A board deck is not the output of your FP&A process. It is the communication layer on top of a model that runs continuously. When the deck becomes the trigger for doing analysis, you are operating with a 30-45 day lag.
- Slide headlines should state conclusions, not label topics. "Q2 ARR" tells the board nothing. "Q2 net new ARR came in 18% below plan, driven by two slipped enterprise deals" tells them what to ask.
- Every board deck needs a dedicated asks slide. If the board leaves without making a decision or providing a specific resource, the meeting was a review, not governance.
What a board deck is actually for
A board deck is not a pitch deck with better numbers. A pitch deck persuades investors who don't yet own a piece of the company. A board deck governs a business alongside directors who already do.
That distinction changes everything. Board members have read your prior decks. They remember the commitments you made last quarter. They have their own models of the business. Slides that re-explain your product, or bury the lead in three pages of market context, signal that you don't know your audience.
The purpose of a board deck is threefold:
- Update - what changed since the last meeting, stated as a delta, not a recap
- Analyze - why it changed, with a clear owner of the interpretation
- Decide - what you're asking the board to approve, advise on, or resource
Most decks do the first, partially do the second, and mostly skip the third. The session then fills that decision vacuum with reactive questions and the meeting runs long.
A well-structured board deck is a thinking document. The metrics are evidence. The narrative is the argument. The asks are the point.
As Bain Capital Ventures notes in their board deck guide, the biggest red flag in any board deck is anything hidden, missing, or omitted — it is far better to be direct and upfront about what isn't working than to bury it and have the truth surface later with compounding damage to board trust.
The structural spine that works at Series A through C
The debate about how many slides a board deck should have misses the actual question: does each section earn its place in the room?
The following structure works for $5M-$50M ARR SaaS companies at quarterly cadence. Adjust depth per section based on what's live for the quarter.
Total: 12-18 slides plus appendix. The appendix is where supporting detail lives. If a director wants the full cohort table, it's there. The main deck doesn't carry it.
The sequence matters. Start with the conclusion (executive summary), then the evidence (KPIs and financials), then the context (strategic narrative and risks), then the decision items. Directors who read the deck in advance should be ready to act before they walk in.
The 8 slides that carry the most weight
Not all slides get equal scrutiny. Experienced board members have a reading pattern: executive summary first, KPI dashboard second, financials third, asks last. Every other slide is supporting context.
1. Executive summary - one slide, three bullets
The format is simple: what went well, what didn't, and what you need from the board. Add a traffic-light status across four operating quadrants (growth, retention, efficiency, profitability) and you've given a director everything they need to form a pre-meeting view.
The mistake here is leading with the wins. That signals that you're managing perception rather than governing the business. Lead with the delta - what changed versus last quarter's forecast and last quarter's commitments.
2. KPI dashboard - the slide board members read first
Directors scan this slide in 30 seconds. It anchors every subsequent question they ask. The dashboard should show each metric against three reference points: plan, prior period, and year ago.
Six to ten metrics is the right range. More than that and the board can't hold a mental model. Fewer than six and you're omitting material information.
The six non-negotiable metrics for any SaaS board deck:
- ARR and MRR - current period vs plan, with a net new ARR split (new, expansion, churn)
- NRR (Net Revenue Retention) - the single best indicator of revenue quality
- Gross margin - needed to contextualize every efficiency metric
- CAC payback period - months to recover blended customer acquisition cost
- Burn multiple - net burn divided by net new ARR added, the most honest efficiency signal
- Runway - months of cash at current net burn, with a 12-month forward scenario
Add ARR growth rate, Rule of 40, pipeline coverage, and forecast accuracy if you have clean definitions and consistent calculation.
3. Financial review - show the story, not the spreadsheet
Three slides, not five. P&L summary (revenue, COGS, gross profit, OpEx by category, EBITDA), ARR waterfall (opening ARR + new + expansion - churn - contraction = closing ARR), and cash (opening balance, net burn, closing balance, runway in months).
Every number needs a comparison point. Actuals vs plan, actuals vs prior period, or both. A number with no context is noise. A number contextualized against a commitment is accountability.
4. ARR waterfall - the slide that shows revenue quality
This single chart tells a more complete story than the top-line ARR number alone. Show five components:
- Opening ARR
- New ARR (from new logos)
- Expansion ARR (from existing customers)
- Churned ARR (customers lost)
- Contracted ARR (downgrades)
- Closing ARR
When expansion ARR is growing faster than churn, the business is compounding. When churn is growing and expansion is flat, the top-line ARR number masks a retention problem. The waterfall makes that visible. The raw ARR number doesn't.
5. Retention deep dive - NRR is the single most important metric
NRR above 110% means the business grows even if it never signs a new customer. NRR below 90% means expansion can't outpace churn and every new logo adds to a leaking bucket.
Show NRR as a trend across at least four quarters. A single-quarter number is a snapshot. Four quarters is a signal. If NRR is improving from 88% to 98% over three quarters, that trajectory is more meaningful to a board than a static 110%.
Add GRR (Gross Revenue Retention) alongside NRR. The spread between the two tells you whether expansion is structural or episodic. For a deeper breakdown of what NRR benchmarks look like across ARR stages and ACV bands, see our SaaS NRR benchmark guide.
6. Cash, runway, and scenarios - the slide directors scrutinize most
Directors carry fiduciary responsibility. Cash is the first thing they're legally obligated to assess. Don't bury it in the appendix or present it last.
Show three things on one slide:
- Current cash balance and net burn rate
- Runway at current burn (months)
- Runway under two scenarios: flat growth and a 20% revenue shortfall
The scenario view turns a single runway number into a decision framework. It tells the board what the downside looks like without requiring them to model it themselves during the meeting.
7. Strategic narrative - the "diff" from last quarter
Board members want to know what changed in your thinking, not just what happened in the numbers. The strategic narrative slide answers: if you were to write your investor memo today, what would be different compared to three months ago?
This is where you surface new learnings about ICP fit, pricing assumptions, competitive dynamics, or product positioning. It's also where you present pivots you're considering and the trade-offs between them.
One to two slides. Bullet points. No throat-clearing about "the macro environment."
8. Asks and decisions - the point of the meeting
Every board deck needs a discrete asks slide. Not buried in the executive summary. Not surfaced ad hoc at the end of the meeting. A named, numbered list of what you are requesting from the board this quarter.
Format each ask the same way: the decision or resource needed, the context (why now, what changes if it's delayed), and the specific action you want from the board.
Example:
- Hiring approval - approving 3 new sales headcount at $280K fully loaded annual cost per hire, adding $840K to annual burn, targeting a 12-month payback based on current pipeline coverage
- Board intro - warm introductions to two enterprise procurement leads in healthcare for the ABM pilot
- Strategic input - guidance on whether to prioritize APAC expansion or extend the US mid-market motion in Q3
Specific asks change the meeting dynamic. Directors come prepared. Decisions happen in the room instead of in follow-up emails two weeks later.
Which metrics belong in the deck and how to frame each one
The metrics you include signal what you believe matters. The framing signals whether you understand what they mean.
Here are the eight most common board-deck metrics, with stage-appropriate context and the interpretation traps to avoid.
ARR (Annual Recurring Revenue)
What it measures: committed, recurring subscription revenue annualized.
What to show: current ARR, quarterly net new ARR, and trailing-twelve-month ARR growth rate.
The trap: presenting contracted ARR (total contract value including multi-year commitments) as ARR. Board members at your next raise will reconcile the numbers, and discrepancies destroy credibility.
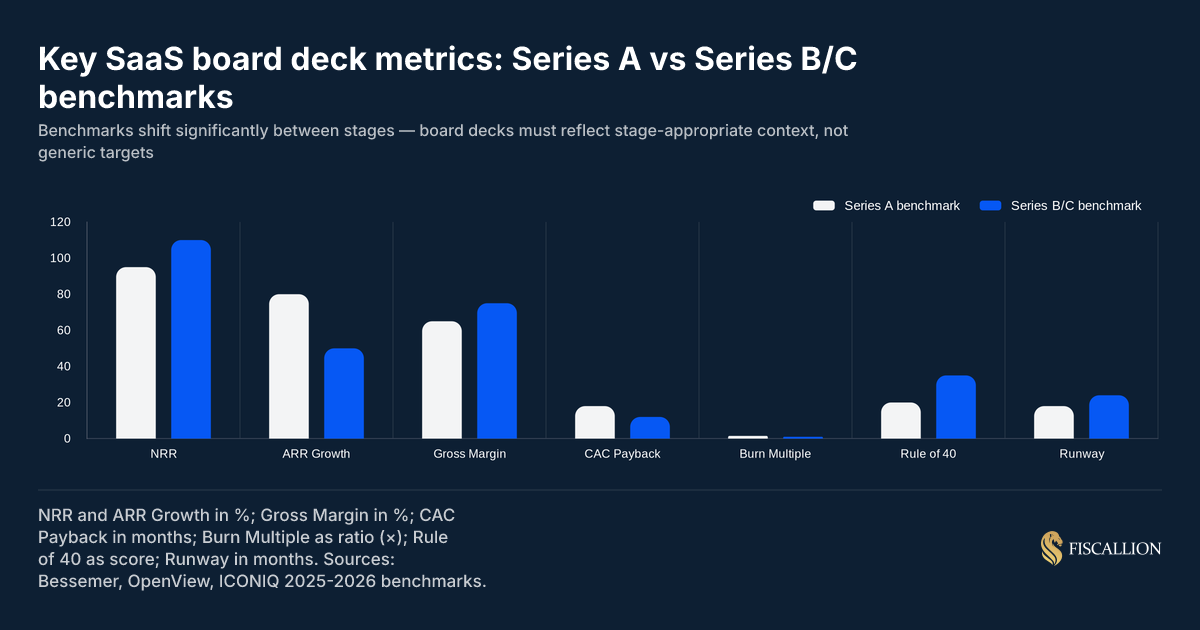
Benchmark context: at Series A, ARR growth rate of 80-100% is strong. At Series B/C, 40-60% with improving efficiency is expected by most institutional investors. OpenView's SaaS Benchmarks provide annual stage-specific ranges that are worth running against your own numbers before the meeting.
NRR (Net Revenue Retention)
What it measures: revenue retained and expanded from the prior period's customer base, expressed as a percentage.
Formula: (Beginning ARR + Expansion ARR - Churn ARR - Contraction ARR) / Beginning ARR × 100
Benchmark: above 110% is strong at any stage. Below 90% is a structural problem that no amount of new logo growth solves permanently. SaaS Capital's annual benchmarking survey, which tracks over 1,000 private SaaS companies, consistently shows top-quartile Series A companies posting 120%+ NRR.
What to show: NRR as a trend across four or more quarters. If definitions changed, footnote it explicitly. For a full breakdown of what NRR ranges signal at different ARR stages, see our NRR benchmark guide.
Gross margin
What it measures: revenue minus cost of goods sold, as a percentage of revenue.
Why it matters for the board deck: every efficiency metric (burn multiple, Rule of 40, CAC payback) is only interpretable in the context of gross margin. A 70% gross margin business and an 85% gross margin business can report the same ARR growth and be in materially different financial positions. For context on what belongs in SaaS COGS and how to calculate gross margin correctly, our SaaS unit economics guide walks through the inputs.
Benchmark: 65-75% is acceptable at Series A. 75-85% is the target by Series B/C for most B2B SaaS businesses. Below 60% warrants an explicit explanation in the deck.
CAC payback period
What it measures: months required to recover the fully loaded sales and marketing cost of acquiring a new customer.
Formula: (Total S&M spend in period) / (Net new ARR × Gross margin %) × 12
Benchmark: under 18 months is strong at Series A. Under 12 months is strong at Series B/C. Above 24 months means the current GTM motion doesn't work at scale unless expansion economics make up the difference.
The trap: using a blended CAC that doesn't distinguish between channels. Mid-market inbound CAC and enterprise outbound CAC are different numbers. Presenting one blended figure hides which motion works. Our guide on CAC payback period in SaaS covers how to segment it correctly and what the board will ask when you don't.
Burn multiple
What it measures: net burn divided by net new ARR. How much are you spending to generate each dollar of new ARR?
Formula: Net burn / Net new ARR
Benchmark: below 1.5x is good. Below 1.0x is excellent. Above 2.0x means the business is consuming capital faster than it's generating revenue, and needs a clear path to improvement. Scale Venture Partners' burn multiple benchmark data, drawn from several hundred SaaS companies, shows that burn multiples are size-dependent — companies at $25M–$50M ARR average around 1.4x, while earlier-stage companies run higher as they invest in GTM.
What to show: burn multiple as a trend. A business moving from 2.5x to 1.8x to 1.3x is demonstrating capital discipline. A business flat at 2.5x for three quarters is not.
Rule of 40
What it measures: the sum of ARR growth rate and EBITDA margin as a proxy for the balance between growth and profitability.
Formula: ARR growth rate (%) + EBITDA margin (%)
Benchmark: above 40 is the target. At Series A with high growth, a low EBITDA margin is acceptable if growth covers the gap. At Series C, declining growth with no margin expansion is a red flag. For context on how the Rule of 40 fits into the broader unit economics picture, see our SaaS unit economics guide.
Pipeline coverage ratio
What it measures: total qualified pipeline value divided by revenue target for the period.
Formula: Total qualified pipeline / Revenue target
Benchmark: 3x-4x coverage is standard for most SaaS GTM motions. Below 2.5x means the quarter is at risk regardless of close rate assumptions.
The trap: presenting total pipeline (including early-stage, unqualified opportunities) rather than qualified pipeline. The number looks larger. The board eventually asks about close rates and the conversation collapses.
Runway
What it measures: months of cash available at current net burn rate.
Formula: Cash balance / Average monthly net burn
What to show alongside it: a 12-month forward view under two scenarios - flat ARR growth (base case) and a 20% revenue shortfall (downside case). The single runway number tells the board where you are. The scenarios tell them what happens if the forecast misses. Our startup runway calculation guide covers how to build the scenario model and the five most common mistakes that make runway numbers unreliable when you need them most.
How to present bad news without losing board confidence
A deck that surfaces only wins is a governance failure, not a leadership flex.
Board members who sit on multiple company boards have seen enough decks to know when numbers are being spun. They can feel it in the slide order (bad news in the appendix), in the language (passive voice for misses: "ARR came in below plan"), and in the absence of root cause.
The counterintuitive truth: surfacing problems early and owning them builds more board confidence than clean numbers with no explanation.
Here is the format that works for presenting a miss:
- State the miss plainly - "Net new ARR in Q2 was $1.1M, $400K below our plan of $1.5M."
- Name the root cause - "Two enterprise deals slipped to Q3 due to procurement delays. One early-stage opportunity in the mid-market segment churned before close."
- Show the decision you made in response - "We've moved the two enterprise deals into Q3 with signed LOIs. We've added a qualification gate to mid-market pipeline to catch budget-approval timeline risk earlier."
- State the forward implication - "Q3 pipeline coverage is 3.8x at current close rates. If both enterprise deals close as expected, Q3 net new ARR reaches $1.7M and partially recovers the Q2 shortfall."
That four-part structure - miss, root cause, response, forward implication - is what separates an honest management team from a reactive one. The board didn't just hear bad news. They heard a diagnosis and a plan.
The prep cadence that makes decks cheaper to build
The most expensive part of a board deck isn't the design or the narrative. It's the data reconciliation - pulling numbers from disconnected tools, resolving definition mismatches between the CRM and the finance model, and discovering at 10pm the night before the meeting that your NRR calculation changed because someone updated the ARR definition in a spreadsheet.
That problem is structural. A solid FP&A framework for startups separates the model from the deck. The model runs continuously - actuals update monthly, metrics are defined once and calculated consistently, and the board deck is the communication layer on top, not the trigger for doing analysis.
The prep cadence that prevents last-minute scrambles:
Four weeks before
- Confirm meeting date with all board members
- Circulate a proposed agenda and ask for additions
- Assign section owners and deadlines (CFO owns financials, VP Sales owns pipeline, CEO owns strategic narrative)
- Flag any items requiring formal board approval to legal counsel
Two weeks before
- Close the quarter's data
- Draft each section
- Identify what the numbers actually say - don't discover a miss the night before the meeting
- Pre-wire key board members individually on anything sensitive or complicated
One week before
- CEO reviews all sections for narrative consistency
- Reconcile any definition mismatches across sections
- Send the completed deck to board members 48 hours before the meeting
At the meeting
- Assume the board read the deck. Don't narrate the slides.
- Use the meeting time for the questions, decisions, and asks you can't resolve asynchronously
48 hours after
- Send a written meeting summary with decisions made and action items assigned
- Document any board commitments to follow up on (intros, resources, approvals)
The 48-hour post-meeting follow-up closes the governance loop. It also creates a paper trail that makes the next board deck easier to write - you'll know exactly what commitments to track in the prior commitments section of the appendix.
Why the deck fails when FP&A is missing
A common failure pattern at $5M-$20M ARR: the board deck is assembled from three or four disconnected sources - the CRM for pipeline, a spreadsheet for ARR calculations, QuickBooks or Xero for actuals, and a separate model for runway.
Each source has its own definition of ARR. The reconciliation happens the week before the board meeting. The CEO or finance lead spends two to three days resolving discrepancies instead of interpreting what the numbers mean.
The result is a deck that reports numbers without context, because there wasn't time to build context - there was only time to assemble figures.
The replacement move is to treat the board deck as the output of a working FP&A system, not the system itself. When metrics are defined, calculated, and updated monthly, the board deck becomes a 4-6 hour job rather than a two-day scramble. More importantly, the CEO walks into the board meeting having already interpreted the numbers, not just assembled them.
This is the core argument behind a decision-grade FP&A framework: the five outputs FP&A must produce (runway with scenario splits, rolling 12-month forecast, actuals vs. plan with variance owners, unit economics as a decision input, and a headcount model linked to cash) are what make the board deck possible in hours rather than days.
Underpinning all of it is a reliable three-statement financial model — one where a single assumption change cascades into the P&L, balance sheet, and cash flow statement simultaneously. Without that integration, runway estimates are approximations and boards will sense it.
A connected consideration: the cash flow forecast is not a finance team deliverable — it is a leadership tool. When it is built correctly, it tells you when to hire, when to hold, when to raise, and what the actual cost of each decision is measured in months of runway.
At Fiscallion, the companies that get the most value from board meetings have already done the interpretive work before the deck is finalized - running scenarios, identifying the two or three decisions the board can actually influence, and framing each ask with a clear trade-off.
Where board time actually goes - and where it should go
Most board meetings spend the majority of the session reviewing past performance. Very little time is allocated to the forward-looking decisions and strategic trade-offs that require the board's judgment and authority.
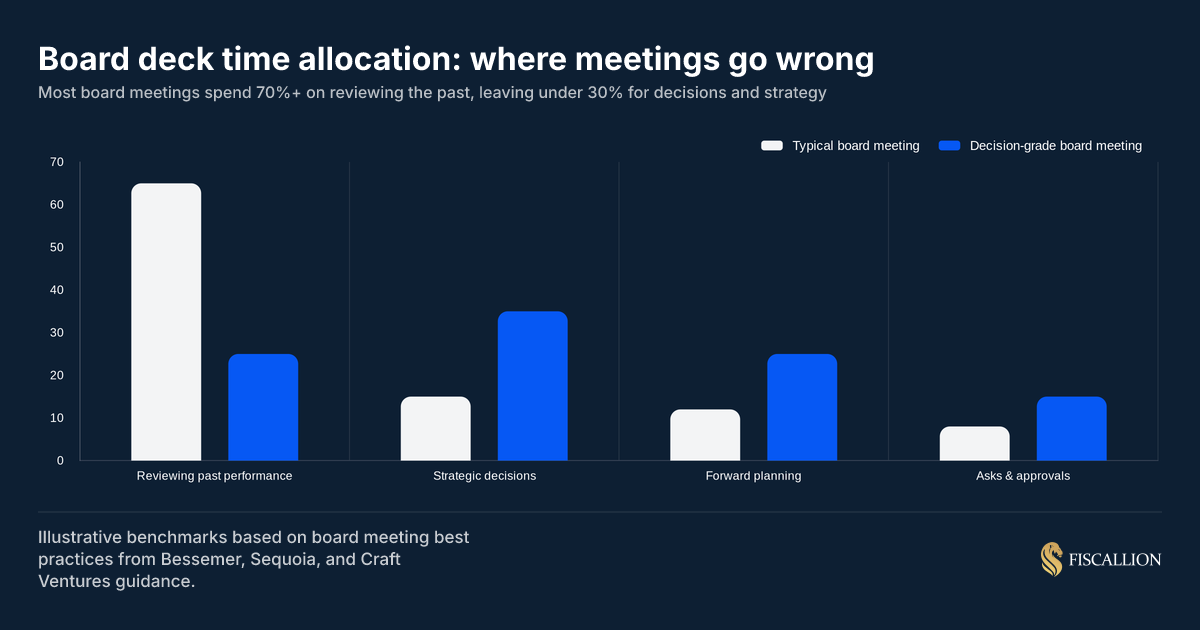
The gap between "typical" and "decision-grade" is a structural problem, not a discipline problem. It's caused by decks that front-load history and back-load asks. Reverse the order, and the meeting dynamics change.
Common mistakes and the replacement move for each
Mistake 1: Slide titles that label, not conclude
What it looks like: slides titled "Q2 Revenue," "Sales Update," "Financials."
The problem: a director reading the deck in advance can't form a view from a label. They have to read through the slide to understand what you're saying.
Replacement move: write every slide title as a conclusion. "Q2 net new ARR missed plan by 18% on two deal slips" tells the board what to think before they read the slide. That frees meeting time for the decision instead of the diagnosis.
Mistake 2: Burying cash in the appendix or slide 14
What it looks like: a 20-slide deck where cash and runway appear near the end, after strategic narrative and product updates.
The problem: directors have a fiduciary duty. If cash is tight, they need to know in the first five minutes of the meeting, not the last five. Burying the cash slide implies you either don't appreciate its importance or you're managing their attention.
Replacement move: include runway explicitly in the executive summary, even if you have ample runway. A director who reads "runway: 22 months at current burn" in the summary can relax and engage with the strategy discussion. One who doesn't see it will be mentally calculating it from the financials.
Mistake 3: Presenting a single-scenario runway
What it looks like: one runway number: "18 months."
The problem: 18 months assumes your forecast is accurate. If ARR growth slows by 20%, that 18-month runway might be 11 months. Board members know this. Presenting one scenario invites them to ask about the downside, which consumes meeting time you'd rather spend on decisions.
Replacement move: present three scenarios explicitly. Base case (current forecast), downside case (20% revenue shortfall), and upside case (10% ahead of plan). Show the runway implication of each. Our startup runway calculation guide covers the exact method for building a scenario model that a board can interrogate — and the five calculation mistakes that make a single runway number unreliable as a decision input.
Mistake 4: Vanity metrics that signal insecurity
What it looks like: leading with total registered users, gross bookings (before refunds), or total pipeline value (including unqualified opportunities).
The problem: board members who've seen 30-50 decks per quarter recognize vanity metrics immediately. Including them alongside real metrics doesn't strengthen the deck - it weakens the credibility of every other number on the page.
Replacement move: present only metrics you can define precisely and would be comfortable defending in a data room during due diligence. If you can't explain the exact calculation of a metric in one sentence, don't include it in the board deck.
Mistake 5: No named owner for metrics that missed
What it looks like: "NRR declined from 104% to 96% this quarter." No owner. No root cause. No response.
The problem: the board will ask why. If you don't have a clear answer, the conversation becomes exploratory - which wastes 20 minutes of meeting time and signals that you're discovering the problem in the meeting rather than managing it.
Replacement move: for any metric that moved materially - in either direction - have a named owner of the analysis and a clear root cause before the meeting. The board will still ask questions. But they'll be directed, not exploratory. Our SaaS cohort analysis guide shows how to use cohort data to identify the segment and timing of a retention decline before it surfaces as a board question.
Mistake 6: The board deck as the FP&A system
What it looks like: the CEO and CFO spend the last week before each board meeting pulling, cleaning, and reconciling data from multiple systems to build the deck from scratch.
The problem: when the deck triggers the analysis, you have a 30-45 day lag on your own numbers. Decisions that should have been made in month two of the quarter get surfaced at the board meeting in month four. That's too late to course-correct.
Replacement move: separate the model from the deck. The model runs continuously - actuals close monthly, metrics are calculated on consistent definitions, and forecasts are updated on a rolling basis. The board deck takes 4-6 hours to produce because the analysis is already done. This is the structural shift that makes finance a leadership asset rather than a reporting function. It is also the most common gap we find at $5M-$20M ARR, and the one with the highest leverage to fix — detailed in our FP&A for startups guide.
Board deck outline: what to use this quarter
Use this structure as your working template. Adjust the depth of each section based on what's live for the quarter.
Slide 1: Executive summary
- Three bullets: what worked, what missed, top ask
- Traffic light on four quadrants: growth / retention / efficiency / profitability
- Runway and cash balance (always visible, even if healthy)
Slide 2: KPI dashboard
- 6-10 metrics vs plan and prior period
- Trend arrows or traffic light indicators
- No vanity metrics
Slide 3: ARR waterfall
- Opening ARR → new → expansion → churn → contraction → closing ARR
- Comparison to plan and prior period
Slide 4: Financial summary
- P&L: revenue, COGS, gross profit, gross margin %, OpEx by category, EBITDA
- Actuals vs plan, actuals vs prior period
Slide 5: Cash and runway
- Cash balance, net burn, runway in months
- Three-scenario runway view (base / downside / upside)
- Next raise timing if applicable
Slide 6: Growth deep dive
- Net new ARR breakdown by source (inbound, outbound, channel)
- Pipeline coverage ratio (qualified pipeline / target)
- Win rate and average sales cycle trend
Slide 7: Retention deep dive
- NRR and GRR trend (four or more quarters)
- Churn breakdown by segment and reason
- Expansion ARR by type (upsell vs cross-sell vs seat expansion) — for context on how to decompose expansion, see our expansion MRR guide
Slide 8: Efficiency snapshot
- CAC payback by channel
- Burn multiple trend
- Gross margin trend
- Rule of 40 (if applicable at your stage)
Slide 9: Strategic narrative
- What changed in your thinking this quarter
- ICP adjustments, pricing hypothesis updates, competitive dynamics
- Trade-offs you're evaluating for next quarter
Slide 10: Risks
- 2-3 risks stated plainly (not softened)
- Current mitigation for each
- One risk the board would raise if you didn't
Slide 11: Asks and decisions
- Numbered list of specific board inputs needed
- Each with: what you need, why now, and what happens if delayed
- Hiring approvals, capital decisions, strategic guidance, intro requests
Appendix
- Prior quarter commitments tracker (status of each)
- Full P&L and balance sheet
- Cohort retention tables
- Win/loss analysis
- Sales rep performance breakdown
- Headcount plan vs actuals
Architecting the boardroom for decisions
A board deck that reports history is a document. A board deck that frames decisions is a governance tool.
The distinction matters because board time is finite and expensive. Two hours per quarter of concentrated attention from experienced operators and investors is an asset most companies don't fully use. They spend it on review instead of resolution. They present metrics without interpretation. They surface asks at the end of the meeting, when attention is depleted.
The structural changes that fix this aren't cosmetic. They require an underlying FP&A model that runs continuously, metrics defined with one owner and one calculation, and a deck architecture that puts the decision before the data tour.
At Fiscallion, we work with founders at Series A through C who are building that infrastructure - not to produce a better-looking board deck, but to make the board meeting the place where the best decisions get made, not the place where last quarter's numbers get reviewed.
If your board deck is currently the trigger for doing FP&A rather than the output of it, that's the problem to fix first.
Book a working session to audit your board reporting structure and the FP&A model underneath it.
