

Most founders can recite their ARR number without hesitation. Fewer can explain, in one sentence, whether their CAC payback or gross margin is actually healthy for a company their size. That gap is where board conversations stall and fundraising diligence gets uncomfortable.
SaaS unit economics benchmarks are not fixed targets. A CAC payback of 14 months is a warning sign at $2M ARR and a strong result at $40M ARR. Gross margin of 72% is fine pre-Series A and a flag at $60M ARR. The benchmark only means something once you know which stage you are being measured against.
This article gives you a single reference table organized by ARR stage, built from the most current private SaaS data available, so you can stop debating whether your numbers are "good" and start using them to decide what to fix next. It also flags the three ways founders most commonly misread these benchmarks, and which metrics actually belong in a board deck.
What you'll learn
- The nine core unit economics metrics and how they interact as a diagnostic system, not a checklist
- A benchmark table you can hold your own numbers against, organized by ARR stage
- How targets for CAC payback, gross margin, NRR, Burn Multiple, and Rule of 40 shift as you scale from $1M to $50M+ ARR
- The three most common ways founders miscalculate or misuse these benchmarks
- Which unit economics metrics belong in a board report, and why
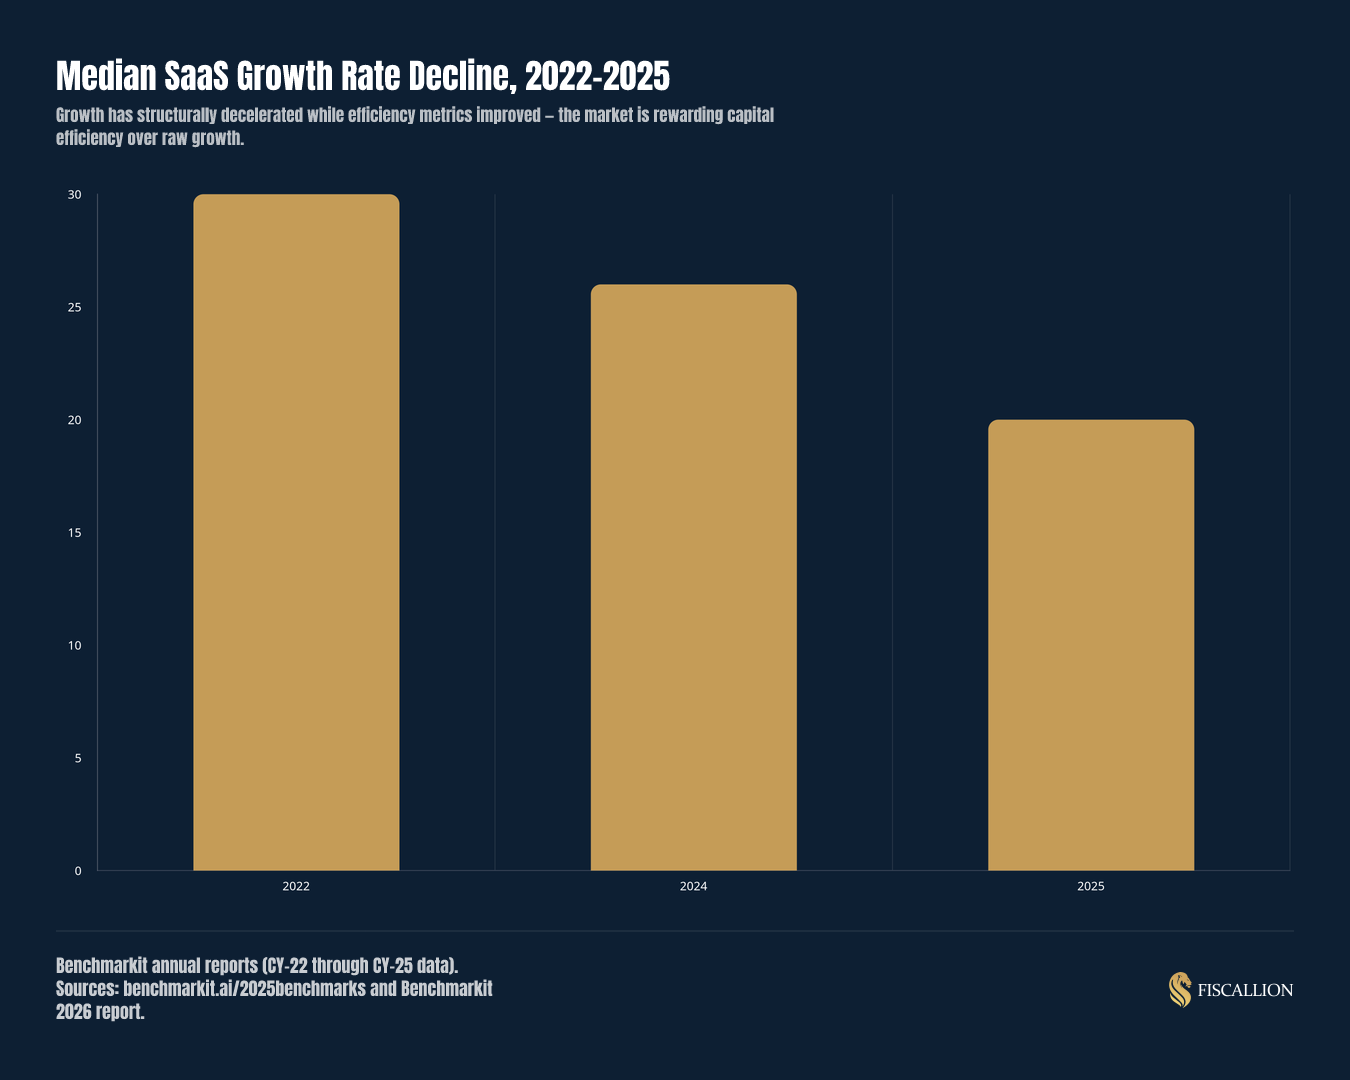
The backdrop for every benchmark below is a market in structural transition: median SaaS growth has declined for four consecutive years while efficiency metrics have improved, rewarding capital discipline over raw growth for the first time in a decade.
The core unit economics metrics, and why they interact
Nine metrics show up in almost every serious SaaS benchmark report: CAC, LTV, LTV:CAC ratio, CAC payback period, gross margin, net revenue retention (NRR), gross revenue retention (GRR), Burn Multiple, and Rule of 40.
Each one answers a different question:
- CAC (customer acquisition cost): what you spend, fully loaded, to close one new customer.
- LTV (lifetime value): the gross-margin-adjusted revenue you expect from a customer over their lifetime, not the raw revenue figure.
- LTV:CAC: whether the revenue a customer generates justifies what it cost to acquire them.
- CAC payback period: how many months of gross margin it takes to recover CAC.
- Gross margin: the percentage of revenue left after cost of goods sold, including hosting, support, and implementation costs.
- NRR / GRR: whether existing customers are expanding, holding steady, or shrinking (NRR includes expansion and downgrades; GRR strips out expansion to show pure retention).
- Burn Multiple: net cash burned divided by net new ARR added, a measure of capital efficiency.
- Rule of 40: growth rate plus profit margin, a combined check on whether growth is coming at a sustainable cost.
None of these numbers means much alone. A strong LTV:CAC built on unadjusted revenue LTV can mask a weak gross margin. A healthy growth rate can hide a Burn Multiple that will run out of cash in eighteen months. This is why Fiscallion's board reporting framework treats gross margin, NRR, CAC payback, and cash runway as a linked set that together tells the complete unit economics story, alongside CAC by segment, LTV, MRR/ARR and committed revenue, pipeline coverage, and headcount versus plan.
The ARR-stage benchmark table
This is the reference to hold your own numbers against. It draws on the most recent private SaaS benchmark data available, primarily Benchmarkit's 2026 report, Fairview's SaaS unit economics guide, SaaS Capital's 2025 retention benchmarks, and ChurnBase's 2026 aggregation of KeyBanc, ChartMogul, and SaaS Capital data.
| ARR stage | LTV:CAC | CAC payback | Gross margin | NRR | GRR | Burn Multiple | Rule of 40 |
|---|---|---|---|---|---|---|---|
| $1M–$10M | 2.5–4:1 | 10–18 months | 65–80% | 95–110% | 82–90% | <1.5x good | Unreliable signal; only 9% of sub-$30M companies beat it |
| $10M–$25M | 3.5–5:1 | 12–18 months | 70–80% | 105–118% | 88–93% | <1.5x good, <1.0x amazing | ~22% of $30M–$80M companies beat it |
| $25M–$50M | 4–6:1 | 8–16 months | 75–85% | 110–118%+ | 88–93% | <1.0x good, <0.75x amazing | Becomes a real investor screen |
| $50M+ | 5–6:1+ | 8–16 months | 80–85%+ | 110–125%+ | 90–95% | <1.0x target | ~26% of >$80M companies beat it |
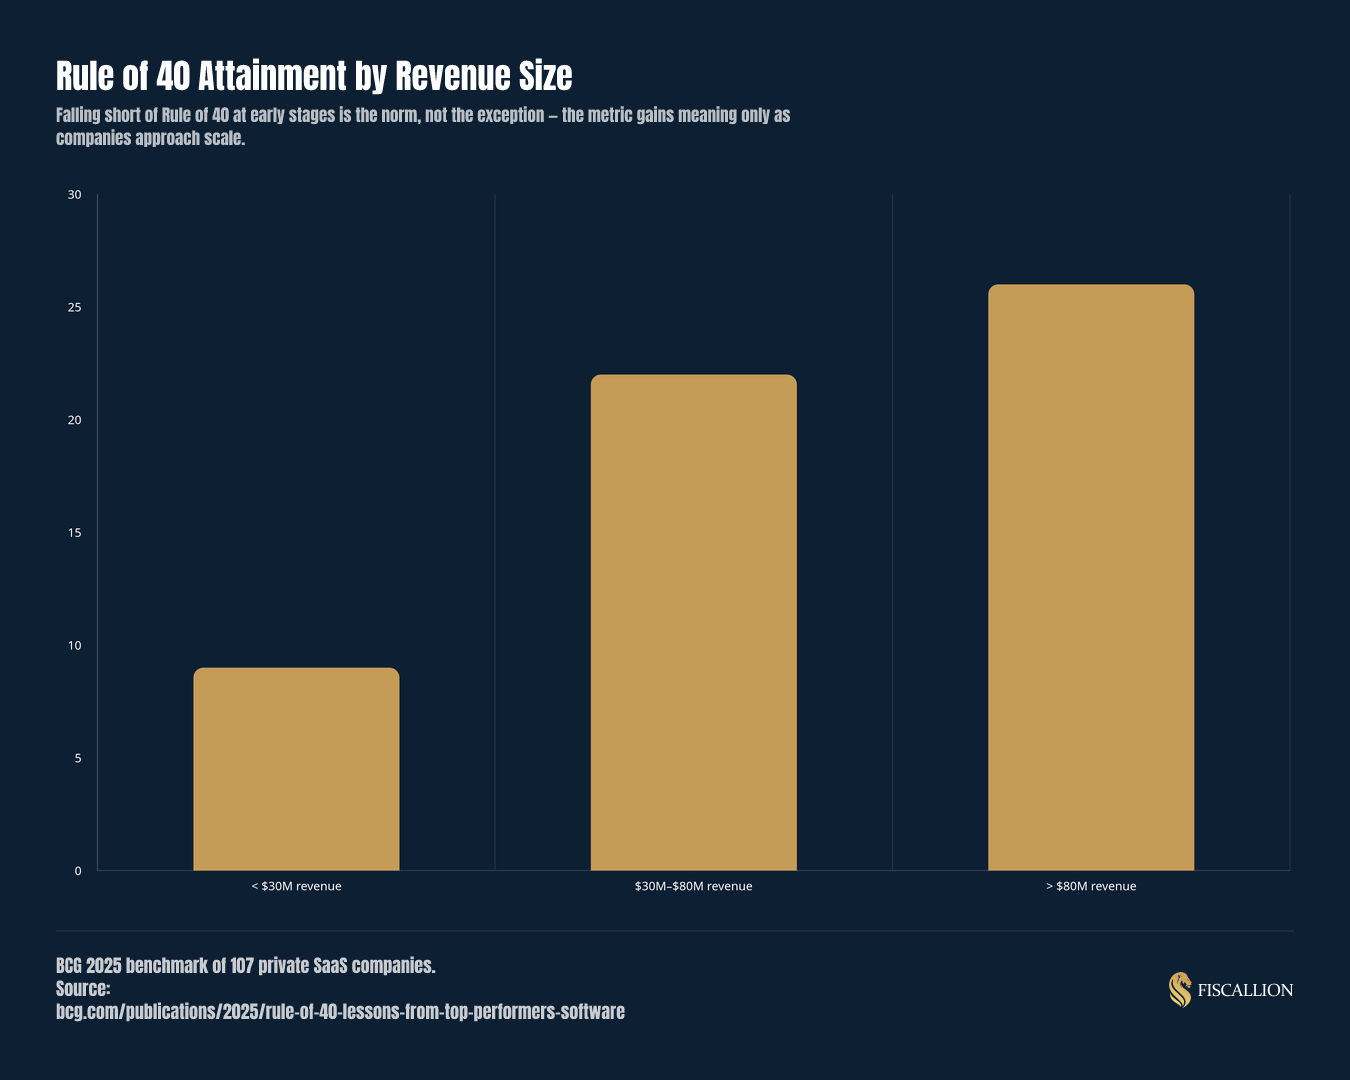
A few notes on how to read this table. LTV:CAC and CAC payback ranges narrow toward the top end as go-to-market motion matters more than ARR size alone: PLG companies can hit sub-6-month payback while enterprise sales-led motions run 18-24 months even at scale. NRR figures vary meaningfully by ACV band; SaaS Capital's 2025 survey found median NRR ranging from 98% for sub-$12K ACV accounts to 106% for accounts above $250K. Rule of 40 attainment rates come from BCG's 2025 study of 107 private SaaS companies, which found only 9% of companies under $30M in revenue clear the threshold, rising to 22% for $30M-$80M and 26% above $80M.
Treat this table as a starting point, not a verdict. If your CAC payback sits at 16 months at $8M ARR, that is inside the healthy range, not a crisis. If it sits at 16 months at $60M ARR, it deserves a conversation.
How targets shift as you scale, stage by stage
$1M–$10M ARR: prove the model works before you scale it
At this stage, the question is not whether your unit economics are elite. It is whether they are directionally sound enough to justify spending more to acquire the next hundred customers.
Net revenue retention above 100% and CAC payback under 18 months are the two signals worth watching most closely here. Rule of 40 is close to meaningless at this size: BCG's data shows just 9% of sub-$30M companies clear it, which means falling short is the norm, not a red flag investors will penalize on its own. Burn Multiple matters more than growth rate alone. A company burning $2 for every $1 of net new ARR is spending faster than it is learning, regardless of how fast the top line is moving.
$10M–$25M ARR: channel-level CAC replaces blended CAC
Somewhere in this range, a single blended CAC number stops being useful. Different channels convert at different costs, and averaging them together hides which motion is actually working.
Burn Multiple should be tightening toward 1.5x or better, and CAC payback should be trending down toward 12 months as sales and marketing processes mature. This is also the stage where segmenting acquisition cost by channel becomes a board-level conversation rather than a nice-to-have, because the growth budget decisions made here compound for years.
$25M–$50M ARR: Rule of 40 becomes a real investor screen
This is where Rule of 40 shifts from an interesting data point to an active filter in diligence conversations. Roughly 22% of companies in the $30M-$80M range clear it according to BCG, which means it is achievable but far from guaranteed.
Burn Multiple targets tighten to under 1.0x for a healthy result, and NRR expectations climb toward 110% or higher. ARR per employee also becomes a meaningful efficiency check; Benchmarkit's 2025 report placed the median around $200,000 in the $50M–$100M ARR range. Growth without margin and cash context stops being credible at this stage.
"A company growing 80% year over year with declining gross margin and accelerating burn is in a fundamentally different position from one with the same growth rate and improving unit economics, and boards at this size know the difference."
— Aleksandar Stojanovic, CEO & Founder at Fiscallion$50M+ ARR: expansion revenue and a visible profitability path
Above $50M ARR, expansion revenue starts carrying more of the growth story than new-logo acquisition. Benchmarkit's 2025 data shows expansion ARR accounting for over 50% of total new ARR for companies past this mark, up from 40% across the broader sample.
Rule of 40 attainment reaches its highest rate here, around 26% of companies according to BCG, but that still means roughly three out of four companies at this scale fall short. The bar has not disappeared, it has just moved. Investors at this stage expect a visible, credible path to profitability, not just a strong growth number standing alone.
The three mistakes that make benchmarks useless
Benchmark tables only help if the numbers behind them are calculated correctly. In practice, most founders get at least one of these wrong.
Mistake 1: Using blended CAC instead of channel-level CAC.
A single average CAC across all acquisition channels hides which motion is actually efficient and which is dragging the average down. If paid acquisition costs three times what outbound costs, blending them tells you nothing actionable. The fix is to segment CAC by channel and compare each segment against the relevant benchmark, not the company-wide average.
Mistake 2: Using revenue LTV instead of gross-margin-adjusted LTV.
Revenue-based LTV overstates value by ignoring the cost of serving that customer. A gross-margin-adjusted LTV applies your gross margin percentage to expected lifetime revenue before comparing it to CAC. Skipping this step is one of the most common reasons an LTV:CAC ratio looks stronger on paper than it performs in cash terms. David Skok's widely cited floor of 3:1 assumes this adjustment; without it, the ratio is not comparable to the benchmark at all.
Mistake 3: Reporting metrics without trend or driver context.
A single-point NRR or CAC payback number, presented without the trend line or the underlying driver, invites questions a board cannot act on. Is CAC payback improving because sales efficiency improved, or because you cut marketing spend and slowed growth? The number alone cannot answer that. Naming the assumption behind each metric turns a status update into a decision-ready report.
Which metrics belong in your board report
Your board report should mirror the structure of this benchmark table, not just list metrics in isolation. Every ARR growth figure needs to be paired with gross margin percentage, net burn, and CAC payback by segment in the same view, so the board can see whether growth is being bought responsibly or subsidized by declining efficiency.
Fiscallion's board reporting framework identifies eight decision-critical metrics that consistently answer this question: net cash runway, CAC by segment and channel, CAC payback period, LTV, NRR, MRR/ARR and committed revenue, pipeline coverage, and headcount versus plan. Each one should carry a one-line explanation of what is driving the number, not just the number itself.
The benchmark table above is the starting point for that conversation. Find your ARR stage, compare your actual numbers against the healthy range, and bring the gap, not just the number, into your next board meeting.
"If a metric sits outside the range for your stage, the useful question is not ‘is this bad,’ it is ‘what decision does this force.’"
— Aleksandar Stojanovic, CEO & Founder at FiscallionFor a deeper look at how to build this reporting cadence into a recurring board rhythm, explore Fiscallion's KPI dashboards and reporting service. Every Fiscallion client works directly with Aleksandar Stojanovic at the CFO layer, not an account manager or a junior delivery team, so the benchmarks in your report come with the judgment to interpret them.
Frequently asked questions
What SaaS unit economics benchmarks matter most at each ARR stage?
At $1M–$10M ARR, NRR above 100% and CAC payback under 18 months matter most because they signal whether the business model works before you scale spend against it. At $10M–$25M ARR, channel-level CAC and a Burn Multiple trending under 1.5x take priority, since blended averages start hiding real inefficiency. At $25M–$50M ARR, Rule of 40 and NRR above 110% become active investor screens rather than background metrics. At $50M+ ARR, expansion revenue as a share of new ARR and a visible profitability path matter most, since BCG found only about 26% of companies above $80M in revenue clear the Rule of 40 threshold.
How do healthy unit economics targets shift as a SaaS company grows from $1M to $50M ARR?
The direction of change is consistent across most metrics: LTV:CAC targets tighten from roughly 2.5-4:1 in the earliest stage toward 4-6:1 by $25M-$50M ARR. CAC payback compresses as sales motion matures, though it can widen again if the company shifts toward enterprise deals with longer cycles. Gross margin expectations rise from the 65-80% range early on toward 75-85% at scale as support and implementation costs get optimized relative to revenue. Burn Multiple targets tighten from under 1.5x being acceptable early on to under 1.0x being the bar by $25M-$50M ARR. NRR expectations climb from the 95-110% range toward 110-118% or higher, reflecting the growing importance of expansion revenue as new-logo growth naturally decelerates at larger scale.
What unit economics metrics should SaaS founders include in board reports?
A board report should include net cash runway, CAC by segment and channel, CAC payback period, gross-margin-adjusted LTV, NRR, MRR/ARR and committed revenue, pipeline coverage, and headcount versus plan. These eight metrics, taken together, answer whether growth is being purchased responsibly and whether the company can sustain its current trajectory without a cash event. Each metric should include a brief note on its driver and trend, since a single-point number without context forces the board to guess at causation rather than evaluate a trade-off.
How do you benchmark CAC payback and gross margin against SaaS peers at your revenue stage?
Start by identifying your ARR stage and go-to-market motion, since CAC payback benchmarks vary meaningfully between PLG, SMB sales-led, mid-market, and enterprise motions even within the same ARR band. Fairview's aggregated data puts elite PLG payback under six months while enterprise motions run 18-24 months even at scale, so comparing across motions without adjusting for this produces a misleading read. For gross margin, separate subscription revenue from services revenue before comparing, since Benchmarkit's data shows subscription gross margin running meaningfully higher than blended total revenue gross margin. Once you have the right comparison group, use the benchmark table in this article as your starting range, and treat any result outside that range as a prompt to investigate the driver rather than an automatic verdict on performance.
The takeaway
Unit economics benchmarks are only useful when matched to the stage they describe. A number that looks alarming at $40M ARR can be entirely normal at $5M ARR, and treating every metric as a fixed universal target is how founders end up debating benchmarks instead of using them.
Keep the ARR-stage table above open next time you build a board deck or prep for a fundraising conversation, and use it to name the gap between where you are and where your stage expects you to be. That gap, not the raw number, is where the useful strategic conversation starts.