
Most startup budgets are historical summaries dressed up as forward-looking plans. They tell you what you spent last quarter and apply a growth rate to next quarter. What they don't tell you is whether that spending ratio is sustainable, how the plan changes if you miss revenue by 15%, or which three decisions the board actually needs to make in the next 90 days.
That gap - between a budget as a record-keeping exercise and a budget as a decision tool - is where most $5M-$50M ARR companies leak control. Not because they lack data, but because the template isn't built to surface trade-offs.
By the end of this guide, you will have a clear structure for a startup budget template that connects spending to runway, benchmarks your cost ratios against real data, and gives every department head one source of truth instead of five separate spreadsheets.
What you'll learn
- The four core expense categories every SaaS budget needs, and what goes in each
- Benchmark spending ratios by ARR stage, sourced from 1,000+ private B2B SaaS companies
- How to connect your budget to a rolling runway forecast that updates automatically
- The five most common budgeting mistakes and the exact moves that fix them
- A template structure you can populate in a day
Why most startup budget templates fail at the decision layer
A startup budget is not a spreadsheet. It is a commitment about priorities. The spreadsheet is just where you record the commitment and test whether it holds up under different scenarios.
Most founders build the spreadsheet first - pull last year's actuals, add a percentage, distribute by department - and never get to the commitment layer. That produces a document accurate at the line-item level but useless for decisions.
Three specific failure modes show up repeatedly.
The annual-only problem. Budgets built in annual view hide timing. A Q1 hiring plan that costs $800K looks manageable across 12 months but devastating on a monthly burn chart in January and February. Cash moves monthly. Your budget needs to as well.
The assumption black box. Whose revenue forecast is feeding the top line? Is it the sales leader's optimistic close rate, or a bottoms-up model tied to pipeline? If no one can answer that in under 30 seconds, the budget is built on implicit assumptions no one owns.
No scenario layer. A single-scenario budget is a guess. The moment reality deviates from plan, you have no pre-built answer for what happens to burn, runway, or hiring if new bookings miss by 20%. McKinsey's analysis of corporate budgeting found that companies relying on single-scenario annual budgets are consistently slower to respond to market shifts than those running rolling, scenario-linked forecasts.
At Fiscallion, the first thing we do when working with a scaling founder is separate the reporting layer from the planning layer. The budget isn't there to report what happened. It's there to tell you what you can afford to do next - and what you have to give up to do it.
The four SaaS budget categories and what belongs in each
SaaS budget structure isn't arbitrary. The four standard categories - Cost of Revenue, Sales and Marketing, Research and Development, and General and Administrative - exist because they correspond to different margin calculations, different decision levers, and different benchmark comparisons.
Getting these wrong means your gross margin is wrong, your CAC is wrong, and your board deck is comparing apples to oranges against industry data.
Cost of revenue
Cost of Revenue covers everything required to deliver your product to a paying customer. Not everything the engineering team touches - only costs directly tied to service delivery.
COR is the foundation of gross margin. Get the categorization wrong and every unit economics conversation in your board meeting starts from a bad number. For a detailed breakdown of what belongs in SaaS COGS versus what founders routinely miscategorize, the SaaS gross margin benchmark guide covers the most common misallocations and their downstream impact on margin reporting.
Sales and marketing
S&M covers the cost of acquiring customers. Separating it cleanly is what makes CAC calculable - and CAC payback is the unit economics metric most investors focus on at Series A and B. Per the 2025 KeyBanc Capital Markets & Sapphire Ventures SaaS Survey, median CAC payback across private SaaS companies sits at roughly 20 months, though this varies significantly by ACV and go-to-market motion.
One decision point that trips up many founders: where does account expansion land? If your AEs own expansion, that cost stays in S&M. If dedicated CSMs own expansion, a portion of CS payroll can be allocated to S&M. Choose a method, document it, and stay consistent.
If your CAC payback calculation uses blended gross margin instead of subscription gross margin, the number is probably wrong in ways that affect budget allocation decisions. The CAC payback period guide covers the two formula inputs that are most commonly wrong and how to correct them before your next budget or board cycle.
Research and development
R&D is your product and engineering spend. This tells you whether you're investing enough in the product to sustain competitive position - and whether you're over-indexed on engineering relative to your revenue stage.
R&D as a percentage of ARR is one of the sharpest indicators of operating leverage as you scale.
General and administrative
G&A is overhead - the cost of running the company, not delivering the product or growing it.
If your CTO is 80% hands-on engineering, their cost goes in R&D. G&A should reflect true overhead, not be inflated by leaders who belong in functional categories.
How to build your top-down revenue budget
The revenue line in your budget is not a number to negotiate. It is the output of your pipeline model, constrained by capacity.
Most founders do this backwards: they pick a growth target, apply it to current ARR, and back into a budget. The problem is that a percentage doesn't explain itself. It doesn't tell you whether your pipeline supports it, whether your sales capacity can close it, or what happens to burn if it comes in lower.
Build your revenue model from three inputs: Starting ARR, Gross new ARR (modeled from pipeline coverage and close rates by segment), and Net revenue retention (expansion minus contraction minus churn).
The formula: Ending ARR = Starting ARR x NRR + Gross New ARR
If you're at $12M ARR, modeling 105% NRR, and forecasting $4M in gross new bookings, ending ARR = $16.6M (38% growth). But if NRR drops to 98% and gross new bookings come in 20% light, ending ARR is $15.6M - a 30% growth year with a materially different budget implication. The inputs reveal what the single number hides.
Don't spread revenue evenly across 12 months. Model recognition against your actual sales cycle length and contract start distribution. If 60% of deals close in Q4, recognized revenue in Q1 is lower than the annual average implies - and your cash position looks very different as a result. The SaaS revenue forecasting framework covers how to build a bottoms-up pipeline model with named close-rate assumptions by segment - the same structure that should feed your budget's top line.
How to model headcount as the primary cost driver
Headcount drives 60-75% of total operating expenses in a $5M-$50M ARR SaaS company. That means the budget is, in large part, a headcount decision dressed up in four categories.
The most common mistake is treating headcount as a number to fill in, not a variable to derive. You should arrive at your headcount budget by modeling what the business needs to accomplish - not by approving department wishlists.
For every approved role, capture four things: start date (realistic, not January 1 - include a 60-90 day recruiting buffer), fully burdened cost (base salary x 1.25-1.35 for benefits, taxes, equipment, and software), ramp schedule (when does this role become productive and at what rate), and P&L category (which of the four buckets does this role belong in).
The headcount plan and the budget should live in the same model. When you approve a hire, it should move operating expenses, update monthly burn, and recalculate runway in one view. The hiring plan is the budget plan. Treat them as separate documents and you will always be surprised by the burn rate. SaaS Capital's revenue per employee benchmarks for private companies provide useful calibration data when assessing whether your planned headcount-to-ARR ratios are in line with comparable companies.
For a detailed walkthrough of capacity-based headcount modeling including ramp curves, attrition assumptions, and benchmark headcount-per-$1M-ARR ratios, see Fiscallion's guide on headcount planning for startups.
Benchmark spending ratios by ARR stage
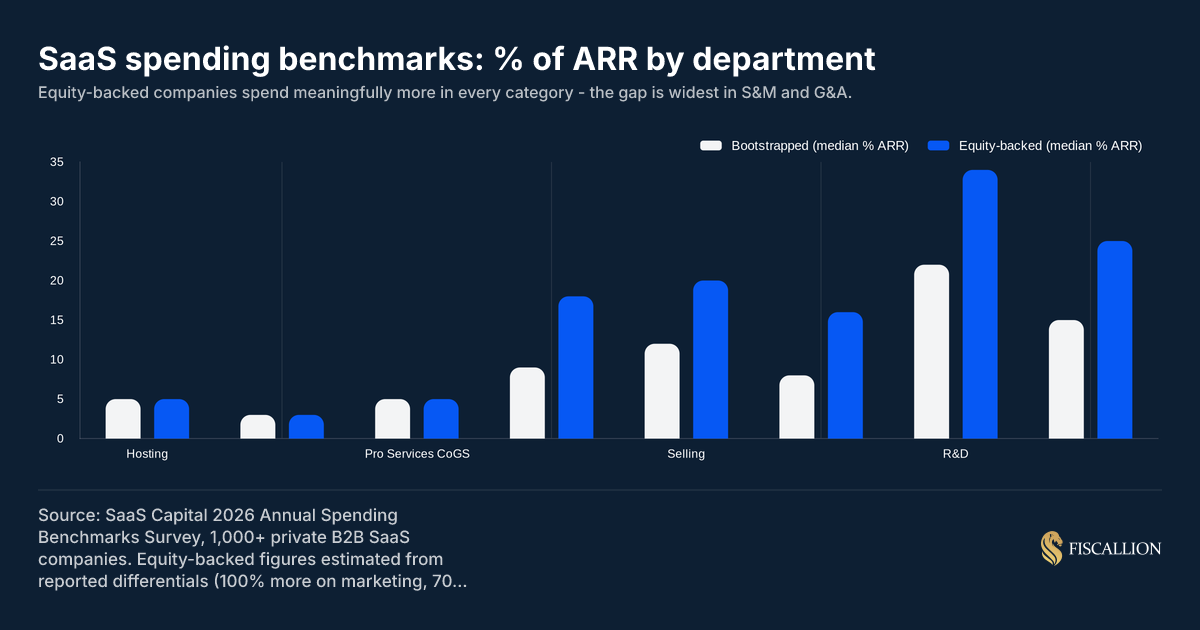
Before you lock in a budget, compare your cost ratios against what comparable companies are actually spending. The benchmark data below comes from SaaS Capital's 2026 Annual Spending Survey of 1,000+ private B2B SaaS companies.
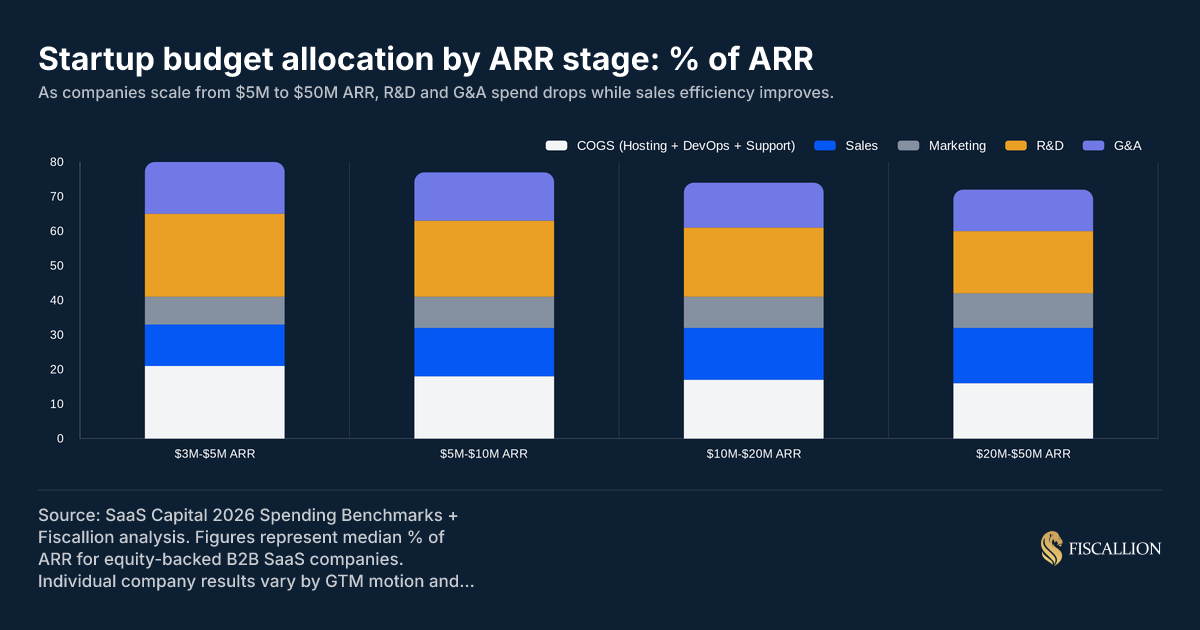
Median spend by ARR stage for equity-backed B2B SaaS
Three patterns worth noting.
R&D drops as you scale. At $3M-$5M ARR, R&D consumes about 24% of revenue. By $20M-$50M, it is closer to 18%. That shift is operating leverage in engineering - more ARR per engineering dollar.
Sales as a percentage rises with scale. You are adding sales headcount intentionally ahead of growth. This is expected for companies investing in a GTM build-out.
G&A should compress over time. A G&A ratio of 15% at $5M ARR that is still 15% at $30M ARR signals overhead that has not scaled efficiently. By $30M, 11-13% is more appropriate.
The total median spend is 96% of ARR for bootstrapped companies and 101% for equity-backed ones. 83% of bootstrapped companies are at or near breakeven; only 52% of equity-backed companies are. Neither profile is right or wrong - the point is to know which archetype your budget matches, and whether the trade-off is intentional.
Gross margin as the upstream constraint
Check your gross margin before finalizing any budget.
If your gross margin is below 65%, the budget problem is in COR, not S&M or G&A. Gross margin is the upstream constraint on every other ratio - a misclassified COR item doesn't just hurt the margin line, it distorts your entire category allocation. The full breakdown of what investors expect at each stage, including how delivery model and ACV affect the acceptable range, is covered in the SaaS gross margin benchmark guide.
How to connect the budget to runway and scenario planning
A budget that does not connect to runway is half a document.
Runway is the number your board, investors, and leadership team will interrogate in any high-stakes conversation. It is also the number most likely to be wrong, because it derives from a burn rate that does not reflect approved-but-not-started hires, committed-but-not-invoiced contracts, or deferred revenue already in the bank but not yet earned. As a16z's framework on cash management notes, founders routinely miscalculate runway by anchoring on current burn rather than forward-modeled burn - a distinction that matters most precisely when a fundraise or major hiring decision is on the table.
Monthly operating cash flow model
Roll your budget into a monthly operating cash flow statement by mapping: recognized revenue to cash collections (accounts receivable timing), approved headcount to payroll dates (not hire dates), annual software subscriptions to the actual payment month (not amortized evenly), and variable costs like ads and commissions to the month they are incurred.
Most spreadsheet budgets amortize everything smoothly. Cash does not move smoothly. The cash flow forecasting guide covers the SaaS-specific inputs that most models miss - including billing cadence, deferred revenue movement, and payroll tax timing - all of which affect when your runway number is actually reliable.
Three scenarios minimum
The downside scenario is the most important one. At Fiscallion, it consistently reveals hidden dependencies. The most common: the company is 18 months from fundraise, the downside scenario shows 14 months of runway, and the plan has no identified lever to pull in the gap. Knowing that four months early is the difference between a managed board conversation and a crisis one.
Runway threshold rules
Pre-define the runway thresholds that trigger decisions before you need them.
- 18+ months of runway after approved hiring plan: hire ahead of demand.
- 12-18 months of runway after approved hiring plan: hire against confirmed capacity gaps only.
- Under 12 months of runway: backfills and direct revenue-attribution roles only.
Writing these into the budget document forces agreement on decision thresholds in advance, not in the middle of a cash pressure event. For a complete methodology on how to calculate runway correctly - including the difference between trailing average burn and forward-modeled burn, and why the gap between them matters most during high-hiring periods - see the startup runway calculation guide.
Common budgeting mistakes and the replacement moves
Mistake 1: Building bottom-up from department wishlists
Each department submits requests, finance adds them up, total is too high, everyone trims 10%, you call it a budget. Bottom-up budgets optimize for departmental needs, not company trade-offs. They produce implicit assumptions that no one owns.
The replacement move: publish a top-down constraint first. Finance publishes the revenue forecast with explicit assumptions, the target burn multiple, and the resulting spend envelope by category. Departments plan within that envelope.
Mistake 2: Modeling headcount at full productivity from day one
Four sales hires in Q1, revenue budget assumes all four productive by Q2. A sales rep on a 9-month ramp generates roughly 20% of full quota in months one and two and 60% by month five. Budget revenue assuming immediate productivity and you are overestimating sales output by 30-40% in the first half of the year.
The replacement move: build productivity ramp curves into the headcount model. Model each hire's output month by month and have it flow directly into the revenue forecast. The headcount planning for startups guide covers how to model ramp timing and attrition assumptions in a way that connects back to your burn rate instead of living in a separate spreadsheet.
Mistake 3: No named owner on expense assumptions
Software tools, contractors, and ad spend land in catch-all categories. Month-end is a scavenger hunt. You cannot analyze variance if expenses are not consistently categorized.
The replacement move: every budget line item needs a category, a department owner, and a named assumption. When actuals come in, every variance traces back to an assumption and you decide whether to update the forecast or address the miss.
Mistake 4: One annual build, no rolling update
Budget built in November, approved in December, opened again in December the following year. Pipeline velocity, hiring pace, and market conditions all shift within 12 months.
The replacement move: lock the annual budget as a baseline, but update the forward 12-month view quarterly. The rolling forecast is not about changing targets - it is about refreshing inputs so the plan reflects reality. McKinsey's analysis of how budgets can keep up with accelerating uncertainty makes the same point: an annual-only process systematically lags the pace at which operating conditions change.
Mistake 5: Separating the budget from the board deck
Budget in a spreadsheet, board deck built separately, numbers pulled manually. A standalone number without assumptions, scenarios, and trade-offs does not tell the board what to decide - it tells them what happened.
The replacement move: build the board financial section directly from the budget model. Budget vs. actual, three scenarios, runway by scenario, and one clear set of trade-off options. The budget is the source of truth. The board deck is the translation layer. The SaaS board reporting framework covers how to structure the financial section of a board deck so it frames decisions rather than just summarizing history.
The startup budget template structure
Here is the section-by-section architecture of a working startup budget template.
Section 1: Revenue model
Every revenue assumption is named to a person, not just a department.
Section 2: Headcount plan
Section 3: Operating expenses by category
Section 4: P&L and margin model
Section 5: Cash flow and runway
Section 6: Scenario and sensitivity model
The SaaS financial model template guide covers how all six sections connect into a single three-statement model where changing one assumption flows through to cash and runway in real time.
How to use the budget as a decision tool, not a record
The budget is only as useful as the cadence you build around it.
Monthly budget vs. actual review. Review the three or four variances that are material - not every line item. Why did S&M overspend by 12%? Did the pipeline improve to justify it? Why did gross margin compress by 200 basis points?
Quarterly reforecast. Update the forward 12-month view with new information. Do not change annual targets - update the inputs. If pipeline is running 15% below forecast in Q1, the Q2-Q4 projection should reflect that. A forecast that is only updated for board meetings is not an FP&A function - it is a reporting function. The FP&A for startups guide covers the monthly and quarterly cadence that keeps a model decision-ready rather than just historically accurate.
One assumptions register. Every material budget assumption has a name next to it - a person, not a department. The person owns the assumption, updates it when it changes, and flags when actuals diverge. This is what assumptions ownership means in practice: a named field in the spreadsheet, not a governance principle on a slide.
When the budget operates this way, the answer to "can we afford this hire?" takes 10 minutes. The answer to "what happens to our runway if we miss Q3?" is a scenario toggle. And the answer to "what should we present to the board?" is the budget plus scenarios plus the three decisions that need a board-level call.
Conclusion
A startup budget template is not a reporting artifact. It is a decision framework - and it should be built as one from the first tab.
That means starting from a top-down revenue model with named assumptions, building headcount as the primary cost driver with fully burdened costs and ramp curves, categorizing every expense into the four standard SaaS buckets, and connecting the whole thing to a monthly cash flow model with at least two scenarios.
The benchmark data is clear: at $5M-$20M ARR, equity-backed SaaS companies are typically spending 83-101% of ARR across operations. The companies that grow faster and retain more capital are not necessarily the ones spending less. They are the ones spending with a clearer model behind the allocation and a faster loop between budget reality and board decisions.
The template structure above gives you the architecture. What makes it work is building it so every number traces back to an assumption, every assumption has an owner, and every scenario has a pre-built decision attached to it.
If your current budget lives in a spreadsheet disconnected from your headcount model, your cash flow, and your board deck - that is the first thing to fix.
Get the startup budget template and run your numbers through the structure above. Or, if the model exists but the forecasting and scenario layer is fragile, that is exactly the kind of working session Fiscallion runs with founders building toward a raise or a board review. Book a working session to build the connected model from scratch.
