

Most SaaS revenue forecasts are structurally correct and operationally useless. The math checks out and the ARR projection looks sharp in the board deck, but when it comes time to decide whether to hire two more AEs or extend runway by six months, the forecast offers no real answer. The problem isn’t the model; it’s the inputs. Relying on unowned assumptions, unreconciled data, and a single-scenario output treats the future as a fixed target rather than a range of risk.
This guide delivers a CFO-level framework to build a SaaS revenue forecast that actually drives capital allocation—from decomposing the MRR waterfall to executing three-scenario stress tests.
Key takeaways
- A revenue forecast is only as reliable as the assumptions behind it. Unowned assumptions are the primary reason forecasts drift.
- New MRR, expansion MRR, churned MRR, and contraction MRR must be modeled independently. Aggregating them hides the actual growth drivers.
- Three-scenario forecasting (base, upside, downside) converts a forecast from a reporting artifact into a capital allocation tool.
- Net revenue retention (NRR) above 100% means your existing customer base is compounding - it fundamentally changes how you model growth.
- For companies at $5M-$50M ARR, the forecasting problem is almost always assumptions quality and decision cadence, not model complexity.
What we'll cover
- What SaaS revenue forecasting actually is (and what it is not)
- The four MRR components you must separate
- Key metrics: what to put in, what to leave out
- Forecasting models: which one fits your stage
- How to build a three-scenario ARR forecast
- Assumptions ownership: the structure that keeps forecasts honest
- How to interpret your forecast output
- What to do next: actions ordered by impact
- Common mistakes and replacement moves
- A forecasting model checklist to get started
What SaaS revenue forecasting actually is
SaaS revenue forecasting is the process of projecting future recurring revenue from first principles - not trend-fitting a line through your last 12 months of ARR.
The distinction matters. Trend-fitting produces a number. First-principles forecasting produces a model: a set of operational assumptions (new bookings rate, churn rate, expansion rate, average contract value) that translate activity into revenue. When the assumptions are wrong, you know which lever is responsible and who owns it.
Done correctly, a revenue forecast answers three questions:
- How much ARR will we have in 12 months under each scenario?
- Which assumption has the largest impact on that number?
- What decision - hire, spend, raise, reduce burn - does each scenario support?
If your current forecast cannot answer all three, it is a reporting artifact, not a planning tool.
The difference between a forecast and a budget
A budget is a commitment. A forecast is a probability-weighted view of what will happen given current assumptions.
Your forecast should update monthly. Your budget can hold for a quarter. Conflating the two is one of the clearest signs that a finance function is prioritizing reporting polish over decision quality. SaaStr's framework for building three financial plans — a base plan (C-60), a stretch plan (C-10), and a downside plan (C-90) — captures this logic well: each plan carries a different confidence level and a different implication for burn and hiring.
The four MRR components you must separate
Aggregating MRR into a single number is the fastest way to make your forecast uninformative. Revenue movement has four distinct components, each with different drivers, different owners, and different implications for growth.
Net MRR change = New MRR + Expansion MRR - Churned MRR - Contraction MRR
When you look only at net MRR, a company growing at 8% per month could be hiding 18% churn masked by 26% new bookings growth. The gross numbers tell completely different stories about durability. ChartMogul's SaaS Retention Report — drawn from over 2,100 SaaS businesses — found that contraction MRR alone can represent up to 40% of all MRR lost. That drag is invisible if you only track the net line.
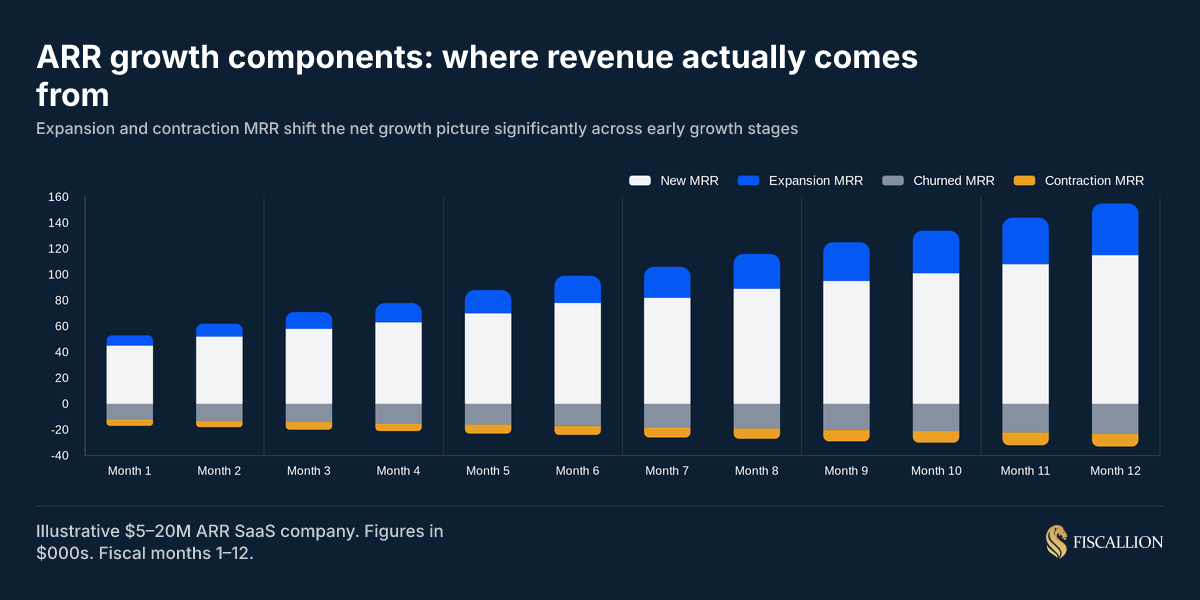
The chart above shows why separating the components matters. Churned and contraction MRR consistently drag net growth. Companies that only track net MRR cannot see the drag building until it becomes a retention crisis.
Key metrics: what to put in, what to leave out
The metrics that belong in your forecast are the ones that directly influence revenue movement. Everything else is analysis that supports the model, not an input to it.
Metrics that go directly into the model
Monthly recurring revenue (MRR) - by component
Your base. Calculate it from your billing system, not your CRM. They will disagree, and the billing system is correct.
Annual recurring revenue (ARR)
ARR = MRR × 12. Use it for board reporting and investor communication. Use MRR inside the model - it moves faster and gives you tighter feedback loops.
Gross revenue retention (GRR)
GRR = (Starting MRR - Churned MRR - Contraction MRR) / Starting MRR
GRR tells you what percentage of existing revenue you hold before expansion. It strips out upsells and shows raw retention. According to ChartMogul's retention benchmarks, best-in-class gross retention for mid-market and enterprise B2B SaaS sits above 90%, with top-quartile businesses in the $15-30M ARR range hitting 83.8%. SMB-focused businesses typically run lower, in the 75-82% range.
Net revenue retention (NRR)
NRR = (Starting MRR - Churned MRR - Contraction MRR + Expansion MRR) / Starting MRR
NRR above 100% means your existing cohort is growing without new customer acquisition. The same ChartMogul data shows that SaaS businesses with NRR over 100% grow 43.6% per year on average — roughly 1.5-3x faster than peers with weaker retention. If your NRR is 115%, you can model meaningful ARR growth even in a quarter with flat new bookings. Top-quartile businesses in the $15-30M ARR range reach NRR above 105%.
Average contract value (ACV)
Segment this by customer tier if you have more than one. A $500/month SMB contract and a $5,000/month enterprise contract behave completely differently at renewal and expansion. For B2B SaaS with ACV over $6,000 annually, top-quartile NRR runs above 109%, per ChartMogul's dataset.
Sales pipeline - weighted by stage
For sales-led companies, include pipeline weighted by close probability and average sales cycle length. Do not mix new business and renewal pipeline into the same funnel - they have different conversion dynamics.
Metrics that inform the model but are not direct inputs
- CAC and CAC payback period - shape growth investment assumptions, not the revenue line itself
- LTV - informs how aggressively you can forecast expansion, but enters through NRR, not as a direct input
- Lead volume and conversion rates - inputs to the pipeline model, one layer up from the forecast
Forecasting models: which one fits your stage
There is no universally correct model. There is a model that fits your motion, your data quality, and your decision horizon.
MRR waterfall model
Best for: companies at any stage with clean subscription billing data.
Start with beginning-of-period MRR. Add new MRR and expansion MRR. Subtract churned MRR and contraction MRR. The result is ending MRR. Project this forward month by month using explicit rate assumptions for each component.
This model is the foundation. Every other model either extends it or feeds into it.
Cohort-based retention model
Best for: companies with 12+ months of billing history and meaningful variation across customer cohorts.
Group customers by their acquisition month (cohort). Track each cohort's retention and expansion over time. Project future periods by applying historically observed cohort curves to new cohorts you expect to acquire.
This model reveals something the waterfall cannot: whether retention is improving or deteriorating across successive cohorts. A company where Q1 2024 cohorts have 15% better 12-month retention than Q1 2023 cohorts is a fundamentally different business than its aggregate churn rate suggests. Cohort analysis is also the only reliable way to detect whether contraction is structural or event-driven — a distinction that shapes how you model the next 12 months.
Pipeline-based forecast
Best for: sales-led companies where new MRR from enterprise or mid-market deals is lumpy and significant.
Use open pipeline weighted by stage probability and expected close date. Map that to new MRR contribution in each forecast period. This is particularly important when a handful of deals could swing your quarterly ARR by 10-20%.
The common mistake is applying static stage probabilities. Your historical close rates by stage, broken out by deal size and segment, are far more accurate than generic industry benchmarks. OpenView's research on revenue forecasting accuracy points to customer categorization — tagging pipeline by adoption profile — as one of the highest-leverage moves for tightening forecast confidence.
Usage-based / consumption forecast
Best for: companies with product-led or usage-based pricing where revenue scales with product engagement.
Model revenue by projecting usage growth per active account, multiplied by expected active account count. This requires product analytics as a forecasting input - not just a product metric. For usage-based businesses, the path to predictability runs through onboarding data and customer adoption curves, not contract value alone.
How to build a three-scenario ARR forecast
Single-scenario forecasts create false precision. Three-scenario forecasting creates honest decision-making.
Here is the structure that works for a company at $8M-$30M ARR:
Define your three scenarios
Base case
Your most likely outcome given current trajectory, factoring in observable pipeline and recent retention trends. Not optimistic. Not pessimistic. The honest middle.
Upside case
A realistic but favorable outcome that requires specific things to go right: churn drops from 3.0% to 1.8% monthly because the new CS playbook lands, expansion accelerates because the upsell motion scales, or pipeline conversion improves because enterprise segment closes faster.
Downside case
A realistic but unfavorable outcome that models specific things going wrong: a key segment churns faster, new bookings fall 20% below pipeline, or average contract value compresses because the market softens.
SaaStr's C-60/C-10/C-90 framework names this well: your base case is the plan you have a 60% confidence in hitting, your stretch is the 10% case, and your downside is the "costs stay flat, revenue comes up short" scenario you need to understand your cash floor. The output of the downside case is not pessimism — it is your zero-cash-date under adverse conditions.
The real challenge for a CEO isn't defining a downside case on paper; it's possessing the operational discipline to execute cuts before the runway disappears. Waiting for an emotional breaking point instead of a pre-set data trigger is how scaling startups run out of time.
The assumption table - the most important part of the model
Each scenario must be backed by an explicit assumption table. An example:
Each assumption has an owner. Churn assumptions are owned by customer success. New MRR assumptions are owned by sales leadership. Expansion is a shared input between CS and product.
When assumptions are unowned, the model is unaccountable. The forecast becomes a collective guess rather than a set of testable hypotheses. The scenario planning framework for startups covers this in detail: the gap between a model that exists and a model that drives decisions is almost always an assumptions ownership problem, not a structural one.
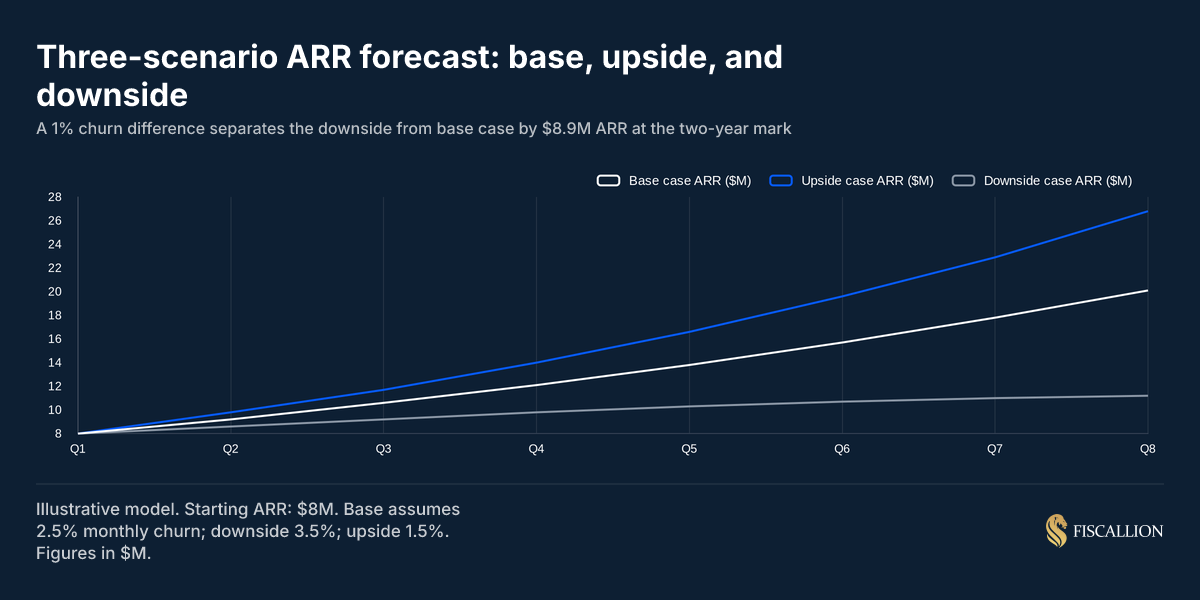
Notice what the chart makes visible: a 1% churn rate difference compounds to an $8.9M ARR gap at the two-year mark. That is the conversation to have in your board meeting - not whether the base case line looks right, but what it would cost to hold churn at 1.5% versus letting it run at 3.5%. That trade-off justifies a CS investment conversation before the hire, not after.
Assumptions ownership: the structure that keeps forecasts honest
The most common forecasting failure is not a broken formula. It is an assumption that lives in a cell with no owner and never gets challenged.
Here is the ownership structure that works:
The review cadence is critical. Monthly reviews catch drift early. Quarterly-only reviews mean you are three months behind by the time you see a problem.
This is one of the core principles behind how Fiscallion structures FP&A engagements: the model is only as good as the decision cadence that surrounds it. A well-built financial model reviewed annually is less useful than a simpler model updated and acted on every month by the right owners. The FP&A for startups framework covers what that cadence looks like in practice: weekly cash monitoring, monthly model updates, and quarterly deep reviews of each major assumption category.
To get unvarnished inputs, Aleksandar Stojanovic, CEO & Founder at Fiscallion, emphasizes that you must structurally separate the forecast from incentive structures. "The reason department leaders sandbag or over-promise is because they're afraid the forecast will be used to judge them," Stojanovic explains. He advises making it clear that the base case is an operational planning tool, not a performance metric, while forcing leaders to defend inputs with historical cohort and pipeline data rather than gut feelings.
By using the three-scenario model, you give everyone a safe place for their optimistic or protective instincts to live without polluting the core planning numbers.
How to interpret your forecast output
Getting numbers out of a model is easy. Knowing what to do with them is the skill.
NRR above 100%: what it changes
If your NRR is above 100%, your existing customer base is compounding. This fundamentally changes capital allocation logic.
A company with $15M ARR and 110% NRR can project $16.5M ARR at 12 months with zero new customer acquisition. That changes the risk math on sales hiring: the floor is already set by existing expansion.
A company with $15M ARR and 88% NRR loses $1.8M ARR per year from existing customers before new bookings even enter the picture. New bookings growth is running against a net negative base. ChartMogul's dataset shows that at $15-30M ARR, 37.1% of all revenue added comes from expansion — making your NRR trajectory a material driver of ARR growth, not a footnote to it.
Churn rate sensitivity
Run this calculation before every board meeting:
At your current MRR, a 1% increase in monthly gross churn equals X dollars of ARR at risk per quarter. Put that number in writing. It forces the churn conversation to be about cash, not percentages.
The same logic applies to the SaaS board reporting package. A board that sees a churn percentage without a dollar equivalent will have an abstract conversation. A board that sees "$340K of ARR at risk per quarter if churn holds at current levels" makes a resource decision.
The forecast-to-actuals gap is the most important metric in the model
Track forecast accuracy by component, not just in aggregate. If your total ARR forecast is within 5% but new MRR beat by 40% while churn missed by 35%, the model is not accurate - two errors are canceling each other out.
Forecast error by component tells you which assumption is weakest. That is where to focus the next 30 days of model work.
What to do next: actions ordered by impact
These are the actions that move forecast quality from reporting to decision-grade. Ordered by impact.
1. Reconcile MRR to your billing system (Owner: Head of Finance / Controller)
Pull your MRR figure from billing (Stripe, Chargebee, or equivalent), not from your CRM or a spreadsheet. Reconcile the gap. This is the foundation - everything downstream is unreliable if MRR is wrong.
2. Separate the four MRR components in your model (Owner: Head of Finance)
If your current model has a single "MRR" line, split it now: new, expansion, churned, contraction. Even rough estimates for each component are more useful than a single aggregated number.
3. Assign owners to every assumption in the model (Owner: CEO / CFO function)
Print the assumption table. Every row gets a name next to it. If a row cannot be assigned, flag it as an unverified assumption and track it explicitly.
4. Build three scenarios with explicit assumption tables (Owner: Head of Finance / Fiscallion FP&A partner)
Base, upside, downside. Each with different churn, expansion, and new bookings rates. Use the scenario table structure from the section above. This is the step most companies skip - and the step that makes forecasts usable in board meetings.
5. Set a monthly forecast review cadence with the right attendees (Owner: CEO)
30-minute monthly review: forecast vs actuals by component, updated assumptions, flagged drift. Sales, CS, and finance in the room. No exceptions for quarters with board pressure.
6. Calculate NRR and GRR monthly, by cohort if possible (Owner: Head of Finance)
NRR at the aggregate level is a starting point. NRR by cohort tells you whether retention is improving or deteriorating structurally. This is the difference between knowing you have a problem and knowing where it started.
7. Build a sensitivity table for the board deck (Owner: Head of Finance)
One table: five key assumptions, the impact of a 10% change in each on ARR at 12 months. This replaces vague "risks" sections with quantified trade-offs.
Common mistakes and replacement moves
Mistake 1: Using last year's ARR growth rate as a forecast
This is extrapolation, not forecasting. Last year's 35% growth was the product of specific pipeline, specific churn, and specific expansion conditions. None of those are guaranteed to repeat.
Replacement: Build forward from first principles. Project new MRR from current pipeline and conversion rates. Project churn from recent cohort data. Layer in expansion from current product usage and upsell motion.
Mistake 2: One scenario that everyone knows is optimistic
Single-scenario forecasting collapses the conversation. Everyone in the room knows the base case is actually the best case. Decisions get made against a number nobody believes.
Replacement: Present three scenarios with explicit assumption tables. Ask the board to agree on which scenario is most likely, not whether the single number is right.
Mistake 3: Modeling expansion as a percentage of ARR without cohort grounding
"We assume 15% net expansion annually" is not an assumption - it is a hope dressed as a number. Expansion rates vary massively by cohort maturity, customer segment, and product usage depth. For B2B SaaS companies with ARPA over $500/month, ChartMogul's analysis shows that 39.2% of all new revenue comes from expansion — but that number is earned through deliberate upsell motion, not assumed in a spreadsheet.
Replacement: Model expansion from cohort behavior. Look at your 12-month and 24-month cohorts. What is the actual expansion rate by cohort age? Use that to project forward, not an aggregate assumption.
Mistake 4: Treating the forecast as final once built
A forecast that does not update is a budget. The moment market conditions shift - a competitor cuts pricing, a large customer signals churn risk, your pipeline conversion falls - the model needs to reflect it.
Replacement: Set a monthly update cycle. Track forecast-vs-actuals by component. Update assumptions when reality diverges more than 15% from projection on any component.
Mistake 5: Conflating bookings with revenue
A signed contract is not recognized revenue. If you have any annual prepaid or multi-year contracts, the timing difference between cash received, bookings recognized, and revenue recognized matters significantly for runway and ARR calculations. The deferred revenue balance should be visible in your model.
Replacement: Map the booking-to-revenue conversion timeline explicitly. Annual upfront deals should appear as deferred revenue on the balance sheet, not as instant ARR in the operating model. This timing gap is also one of the primary reasons why a cash flow forecast must run in parallel with your revenue forecast — the ARR line and the cash-in-bank line can diverge materially, especially in a quarter with heavy annual prepay.
Mistake 6: Running the forecast in isolation from headcount planning
The most consequential capital allocation decisions - adding two AEs, hiring a VP of Marketing, building a CS team - are headcount decisions. A revenue forecast that is not connected to a headcount model forces those decisions on intuition rather than trade-off analysis. At most $5-50M ARR companies, headcount is 60-75% of total operating expenses — which means your hiring plan effectively is your burn plan.
Replacement: Connect revenue scenarios to headcount scenarios. What does the sales team need to look like to hit the upside case? What does the downside case require cutting? The headcount planning guide covers how to model ramp timing, loaded costs, and the cash lag before new hires become productive — all of which belong in the same model as your ARR projection.
The SaaS revenue forecast model checklist
Use this before your next board review or forecasting cycle:
Foundation
- MRR reconciled to billing system
- Four MRR components tracked separately (new, expansion, churned, contraction)
- Monthly data available for at least 12 periods
Model structure
- MRR waterfall model built with monthly granularity
- Three scenarios with explicit assumption tables (not just three revenue lines)
- Assumption owner assigned for each row
Metrics
- NRR calculated monthly
- GRR calculated monthly
- Cohort retention tracked for at least two vintage cohorts
- Forecast-to-actuals gap tracked by component, not just aggregate
Decision integration
- Sensitivity table showing impact of ±10% on each key assumption
- Scenarios linked to headcount and burn implications
- Monthly review cadence scheduled with sales, CS, and finance
Assumptions quality
- Churn assumptions grounded in cohort data, not industry benchmarks
- Expansion assumptions grounded in product usage and historical upsell rates
- New MRR assumptions grounded in current pipeline with stage-weighted conversion
A note on where forecasting fits in the broader FP&A picture
A revenue forecast is one component of a decision-ready finance function. It needs to connect to a cash flow model, a headcount plan, and a scenario-linked budget. Without those connections, the forecast tells you what ARR might be, but not whether you can afford the team required to get there.
The SaaS financial model template used in Fiscallion engagements starts with the MRR waterfall, links it to headcount planning assumptions, and flows into a three-statement model that shows cash, runway, and the operating leverage implied by each scenario. The forecast becomes useful because it answers the capital allocation question, not just the revenue question.
For a step-by-step walkthrough of how to build the full financial model that connects revenue, headcount, and cash flow, the SaaS financial model template guide is the right place to continue. It covers the four foundational components - starting from the revenue build - and explains how to structure assumptions so the model stays useful as you scale from $5M to $50M ARR.
Operationalizing the waterfall: from predictions to testable hypotheses
A SaaS revenue forecast is not a prediction. It is a structured set of testable assumptions about how your business converts pipeline, retains customers, and grows existing accounts - expressed as ARR projections across three scenarios.
The companies that get the most value from forecasting are not the ones with the most sophisticated models. They are the ones where every assumption has an owner, every scenario has a named trade-off, and the forecast is reviewed monthly by the people who control the inputs.
If your forecast cannot answer "what decision does each scenario support?" by next quarter's board meeting, the model needs rebuilding - not more detail, but more accountability. Separate the four MRR components. Assign assumption owners. Build three scenarios. Set a monthly cadence.
That is the version of SaaS revenue forecasting that justifies capital allocation decisions. Everything else is a spreadsheet that makes the deck look complete.
Ready to audit your forecasting model and assumptions structure? Book a working session with Fiscallion and get a decision-grade FP&A review in one call.
