

Most scaling SaaS companies do not have a forecasting problem. They have a cadence problem.
The model exists. The board deck gets built. But between board meetings, the forecast sits untouched, the burn number gets pulled ad hoc when someone asks, and the CEO ends up debating whether last month's variance is real or a modeling error instead of deciding what to do about it. That is not FP&A. That is reporting on a delay, dressed up as planning.
A reporting cadence is the fix. It is the recurring rhythm that turns a static model into a live decision system: what gets reviewed, how often, by whom, and what happens when a number breaks a threshold. Get the cadence right and variances become patterns you saw coming. Get it wrong and every board meeting turns into a fire drill.
This piece lays out the four-layer cadence model that SaaS finance teams at $5M-$100M ARR are converging on, which metrics belong at which frequency, and the implementation sequence to get there without hiring a full finance department.
What you'll learn
- What a reporting cadence actually is, and why it is different from "sending reports on time"
- The four-layer cadence structure (weekly, monthly, quarterly, annual) and who owns each layer
- How often to review forecasts based on decision speed, not habit
- Which metrics belong in each review cycle, with current benchmarks
- The implementation sequence for a lean finance team
- The four most common cadence failures and how to correct each one
What a reporting cadence is and why it changes outcomes
A reporting cadence is the structured, recurring rhythm of building, reviewing, and revising your financial views. It is not a calendar entry for "send the board deck." It is the system that decides which numbers get looked at weekly, which get rebuilt monthly, and which only earn a full strategic reset once a quarter.
Cadence sits at the intersection of three things: your data, your decisions, and your credibility with the board. Get the rhythm right and three benefits show up consistently.
First, variances stop being surprises. When you check cash and revenue on the same schedule every week, a churn spike or a slipping renewal shows up as a trend line, not a shock in the monthly close. Ridgeway Financial Services frames this as catching liquidity issues 60 to 90 days before they would otherwise surface in the P&L, which is exactly why a rolling 13-week cash forecast has become standard practice for venture-backed companies rather than something reserved for companies already in distress.
Second, decisions get made on schedule instead of under pressure. If your hiring plan review happens the same week every month, you decide about the open Head of Sales role on your terms. If it only happens when cash gets tight, you decide under duress, and duress decisions are worse decisions.
Third, cadence builds trust with your board and investors, independent of the numbers themselves. Consistency and punctuality function as a trust signal on their own, separate from whatever the metrics say that month, according to Structure First's research on startup board reporting.
Contrast that with the pattern most $5M-$100M ARR companies actually run: a forecast that gets refreshed in the two weeks before each board meeting, then goes stale. That is a reporting exercise, dressed up as planning.
The four-layer cadence model that boards actually trust
The consensus across FP&A practitioners is a four-layer structure: weekly, monthly, quarterly, and annual. Each layer has a distinct time horizon, owner, and deliverable. Ridgeway Financial Services describes this directly: most early-stage companies run one or two of these layers. Companies past Series A should be running all four.
The weekly layer exists to catch problems early, not to run the business. Grove FP's breakdown of the FP&A operating rhythm describes the weekly deliverables as a one-page cash update, a revenue pulse covering new and churned MRR, and two to three flash KPIs, delivered in a 15 to 30 minute standing meeting. The point of this meeting is to replace the ad-hoc "what are the latest numbers" requests that otherwise interrupt your finance function all week.
The monthly layer is where most of the operating weight sits, and it follows a four-week internal cycle. Grove FP maps it as: week one closes the books and produces a flash report within 48 hours; week two finalizes the management pack, updates the rolling forecast, and distributes the board materials; week three is for partnering with department heads and running scenario models; week four preps for the next close and does forward planning. That structure matters because it forces the forecast update to happen every month, not just before board meetings.
The quarterly layer is where strategic assumptions get challenged, not just tracked. This is the Quarterly Business Review: a comprehensive performance review, a full forecast reset that challenges every major assumption and rebuilds the revenue forecast from current pipeline, board preparation with market and competitive context, and a process retrospective, per Grove FP's quarterly cadence framework.
If you are running a lean finance function without a dedicated FP&A hire, the minimum viable version of this model collapses to two layers: a weekly 20-30 minute finance check-in between the CEO and finance lead reviewing four numbers, and a monthly 60-minute metrics review with sales, customer success, and product in the room, modeling trade-offs against a shared forecast. That two-layer minimum is enough to run a company through Series A. Past that, the quarterly and annual layers stop being optional.
How often you should actually review forecasts
The honest answer is "it depends," but it depends on something specific: decision lead time, not preference or habit.
Model Reef's framework on reforecasting cadence puts it directly: choose your cadence by asking what you can realistically influence in 30, 60, and 90 days. Monthly updates win when demand, pricing, or churn is shifting fast enough that a leadership team can still change outcomes inside a 30-60 day window. Quarterly updates are the right call when the operating model is stable or when the underlying data simply arrives late. Rolling forecasts are the right tool specifically for runway, hiring, and capacity decisions, because those decisions need a forward view that updates continuously rather than resetting every quarter.
The monthly rolling forecast is the backbone for most SaaS companies in the $5M-$100M ARR range. It updates every month regardless of whether a board meeting is scheduled.
Weekly cadence is reserved for cash-critical situations: inside 12 months of runway, mid-fundraise, or recovering from a miss. Quarterly cadence is where you do the strategic reset work: reforecasting the full year from current pipeline, not just extrapolating the last close.
Timing discipline matters as much as frequency. Fairview's research on SaaS financial reporting sets the expectation that monthly close should land within five to seven business days, because investors read late or incomplete reporting as a governance risk signal, not just a process gap. That timing expectation holds whether you are a $6M ARR company with three finance staff or a $60M ARR company with a full controller function.
Stage matters too. A pre-Series A company may only need weekly revenue tracking with a full reforecast happening quarterly. A Series B or C company generating $30M+ ARR should have the full four-layer cadence running, because the cost of a missed variance is larger and the board's expectations for consistency are higher.
Which metrics belong in each review cycle
Not every metric deserves the same attention frequency. The mistake most founders make is reviewing everything on the same schedule, usually monthly, which means cash-critical numbers get checked too rarely and strategic efficiency ratios get checked too often without enough new information to justify the meeting.
Here is the tier structure, drawn from the consensus across current FP&A guidance:
Weekly tier: the vitals
- Cash position and runway (rolling 13-week view)
- MRR movement: new, expansion, contraction, and churned MRR
- Weekly burn rate
- Pipeline coverage against the quarter's target
- Headcount versus plan
Monthly tier: the strategic layer
- CAC payback, segmented by customer size (median sits around 20 months across KeyBanc and Sapphire Ventures' 2024 benchmark data, though SMB segments should land well under 12 months)
- Net revenue retention, where private B2B SaaS companies typically target above 100%
- Gross revenue retention, where a drop below 85% is widely recognized as a signal of a product or onboarding problem rather than a pricing one
- Gross margin by cohort or segment
- ARR waterfall (new, expansion, contraction, churn, net new)
- P&L versus plan
- Full variance analysis
Quarterly tier: efficiency and strategic reset
- Rule of 40, keeping in mind that BCG's 2025 benchmark data found only 9% of companies under $30M revenue actually clear it
- Burn multiple (under 1.0x is widely considered best-in-class, 1.0-1.5x is a reasonable Series B target, above 2.0x warrants a hard look)
- Magic number
- LTV:CAC ratio, with the median currently around 3.6:1
- Full forecast reset built from current pipeline, not last quarter's extrapolation
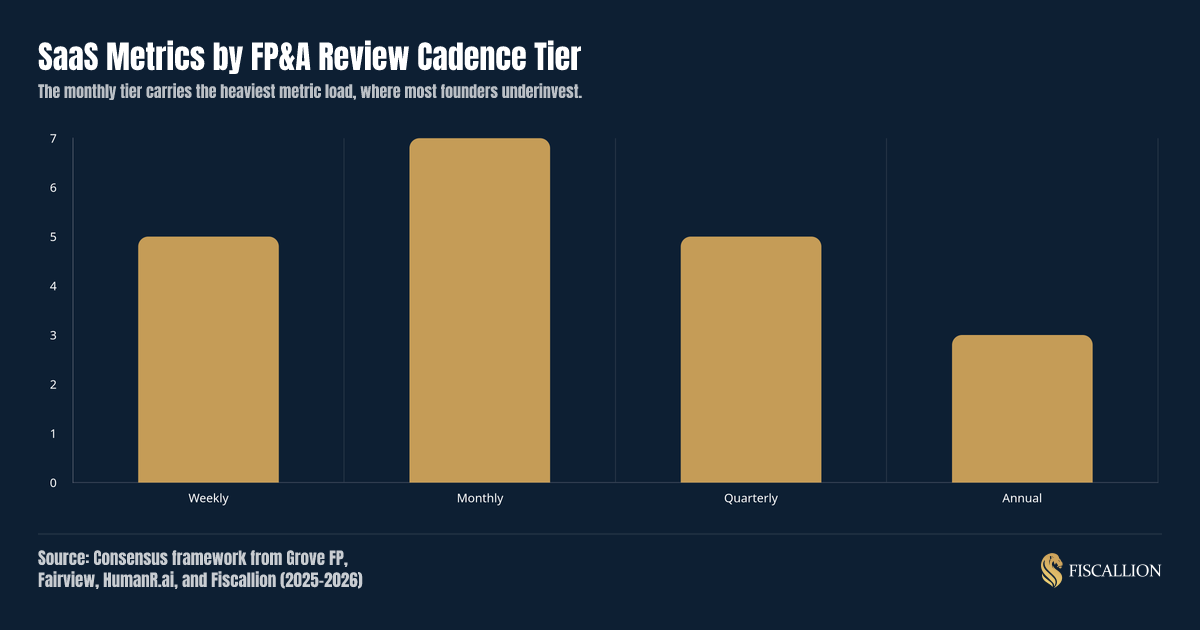
The pattern worth noticing: the monthly tier carries the most weight, at seven metrics against five weekly and five quarterly. That surprises most founders, who assume the effort belongs at the extremes, either the weekly cash check or the quarterly strategic deck. It does not. The monthly review is where CAC payback, retention, and margin get tracked closely enough to catch a drift before it becomes a board-meeting surprise, without the noise of daily fluctuation.
Fiscallion's own board reporting work narrows this further to eight metrics that break the most board decisions when they are missing or mis-owned: net cash runway, CAC by segment, CAC payback, LTV, NRR, MRR/ARR, pipeline coverage, and headcount versus plan. Every one of those eight maps directly onto the weekly or monthly tier above, which is not a coincidence. The metrics that break decisions are the ones that need the tightest review cycle.
Turning the framework into a working cadence
None of this matters if it stays a framework on a slide. Here is the sequence to actually install it, built for a finance team of one to three people running a $5M-$100M ARR company.
- Define metric contracts first. Every metric needs one owner, one definition, and one source system. If sales and finance calculate CAC differently, the cadence just formalizes the disagreement on a schedule.
- Assign an owner per layer, not per metric. One person owns the weekly cash view. One person owns the monthly forecast rebuild. These can be the same person on a lean team, but the accountability has to be explicit.
- Build the shared model before you build the meeting. The weekly and monthly meetings only work if there is one model on screen that everyone is looking at, not three spreadsheets reconciled after the fact.
- Set the weekly and monthly meeting times and do not move them. Same day, same time, same agenda, every cycle.
- Write the decision rules before the first meeting, not during it. If MRR growth drops below plan by more than 15% two months running, that should trigger a predefined action, not a debate about whether the model is broken.
Ridgeway's research is blunt about what actually predicts success here: companies that hold the same 90-minute monthly meeting, on the same day, with the same agenda and the same owner, consistently outperform companies with more sophisticated tooling running on an irregular schedule. The tool matters less than the discipline of showing up on schedule.
For a concrete example of this weekly rhythm in practice, Aleksandar Stojanovic recently shared the exact finance cadence he runs with SaaS clients:
Book a working session to review your cadence
If your current cadence is "we pull numbers before the board meeting," that is the single highest-leverage thing to fix before your next raise or your next board cycle. Fractional CFO support is Fiscallion's core service — a strong choice when a company needs senior judgment plus hands-on FP&A ownership. Book a working session with Aleksandar to review your finance model, reporting cadence, and CFO coverage. Every Fiscallion client works directly with Aleksandar Stojanovic at the CFO layer — FP&A leadership experience gained through scaling a SaaS company to €100M ARR — not through a junior analyst reading off a template.
Common cadence failures and how to fix each one
Trap 1: Reviewing burn monthly when the situation calls for weekly. If runway is under 12 months, or you are mid-raise, a monthly burn review is too slow. The fix is simple: move burn to the weekly cash check the moment runway crosses that 12-month threshold, and move it back to monthly once the situation stabilizes.
Trap 2: Updating the forecast only for board meetings. By the second quarter, a forecast that only gets touched quarterly is running on assumptions that are already stale. The fix is the monthly rolling forecast rebuild, done every month regardless of whether a board meeting is on the calendar that month.
Trap 3: No decision rules, so the review becomes a debate about the model. Without a predefined rule, a bad number turns into an argument about whether the model is wrong instead of a conversation about what action to take. The fix is writing the rule before the number shows up, not after.
Trap 4: Inconsistent meeting timing. A monthly review that happens on the 15th one month and the 28th the next erodes the discipline the cadence is supposed to build. The fix, again per Ridgeway's findings, is fixing the day and the owner and never moving either.
Frequently asked questions
What is a reporting cadence in SaaS FP&A and why does it matter?
A reporting cadence is the structured, recurring rhythm for building, reviewing, and revising your financial views, covering what gets checked weekly versus monthly versus quarterly, who owns each check, and what happens when a number crosses a threshold. It matters because it converts a static model into a live decision system. Without it, variances surface as surprises during the close instead of trends you caught weeks earlier, decisions get made under pressure instead of on schedule, and your board has to re-earn trust in your numbers every single meeting instead of that trust compounding over time.
How often should a SaaS startup review its financial reports and forecasts?
Match the review frequency to decision lead time, not habit. The monthly rolling forecast should be the backbone for most companies in the $5M-$100M ARR range, updated every month whether or not a board meeting is scheduled that month. Weekly review is reserved for cash-critical windows: inside 12 months of runway, mid-fundraise, or recovering from a miss. Quarterly review is where you do the full strategic reset, rebuilding the revenue forecast from current pipeline rather than extrapolating the last close. Monthly close itself should land within five to seven business days of month-end, since late reporting reads as a governance signal to investors, not just a process delay. Earlier-stage companies can run a lighter version, weekly revenue tracking with only a quarterly full reforecast, but past Series A the full four-layer cadence (weekly, monthly, quarterly, annual) should be running.
Which SaaS metrics should be included in a regular FP&A reporting cycle?
Map metrics to the tier that matches their volatility and decision urgency. Weekly: cash position and runway, MRR movement (new, expansion, contraction, churn), weekly burn rate, pipeline coverage, and headcount versus plan. Monthly: CAC payback segmented by customer size, net and gross revenue retention, gross margin by cohort, the full ARR waterfall, P&L versus plan, and variance analysis. Quarterly: Rule of 40, burn multiple, magic number, LTV:CAC ratio, and a full forecast reset built from current pipeline. The monthly tier typically carries the heaviest metric load, which is where CAC payback, retention, and margin drift get caught before they become board-meeting surprises.
If we already have FP&A software and AI tools, do we still need a fractional CFO?
A partner is still needed because AI tools and FP&A software handle data collection, automate the close, and flag anomalies — but they do not design decision rules, challenge strategic assumptions, or own the board conversation. The cadence only creates value when someone with senior judgment decides which variances demand action, which thresholds trigger hiring freezes or spend shifts, and how to frame the story for a board that is measuring governance, not just growth. When the data pipeline is already automated, that is often the exact moment when adding CFO-level judgment produces the highest return, because the inputs are clean enough to act on and the missing piece is strategic interpretation.
How does fractional CFO support work alongside our existing accountant or bookkeeper?
The accountant or bookkeeper owns the close: recording transactions, maintaining the books, and producing historical financials. The fractional CFO owns the forward-looking layer: the forecasting model, the reporting cadence, the variance analysis, and the board narrative. These roles are complementary, not overlapping. In practice, the fractional CFO relies on the bookkeeper's clean monthly close as the input for every rolling forecast and variance review, so the two functions reinforce each other rather than duplicate effort.
The cadence is the decision system
A reporting cadence is not a finance project you finish and move past. It is a leadership discipline, and it needs an owner senior enough to design the decision rules and defend them under pressure, not just someone who assembles the deck.
The CFO, whether fractional or full-time, designs the cadence. The CEO participates in it every week without delegating that participation away. The board reads its output and, ideally, stops needing to ask whether the numbers can be trusted, because the rhythm has already answered that question. Get that structure running consistently, and the forecast stops being something you scramble to update before the next board meeting.