
Most founders at $5–20M ARR have three separate spreadsheets they call a "financial model." One for revenue, one for headcount, one for cash. None of them talk to each other. That is not a model — it is a collection of guesses that happen to share a folder.
The three-statement model fixes that. It integrates your income statement, balance sheet, and cash flow statement so that a change in one assumption propagates correctly through every output. When you add a sales hire, the model should show you what happens to CAC payback, gross margin, and cash balance simultaneously — not in three separate files you reconcile manually.
This guide covers what the three-statement model is, why the integration is the part that matters, how to build one for a SaaS company, and what to do differently depending on your stage.
Key takeaways
- The three-statement model is valuable not because of its outputs, but because of what it forces you to make explicit: revenue drivers, cost structure, and working capital behavior, all linked.
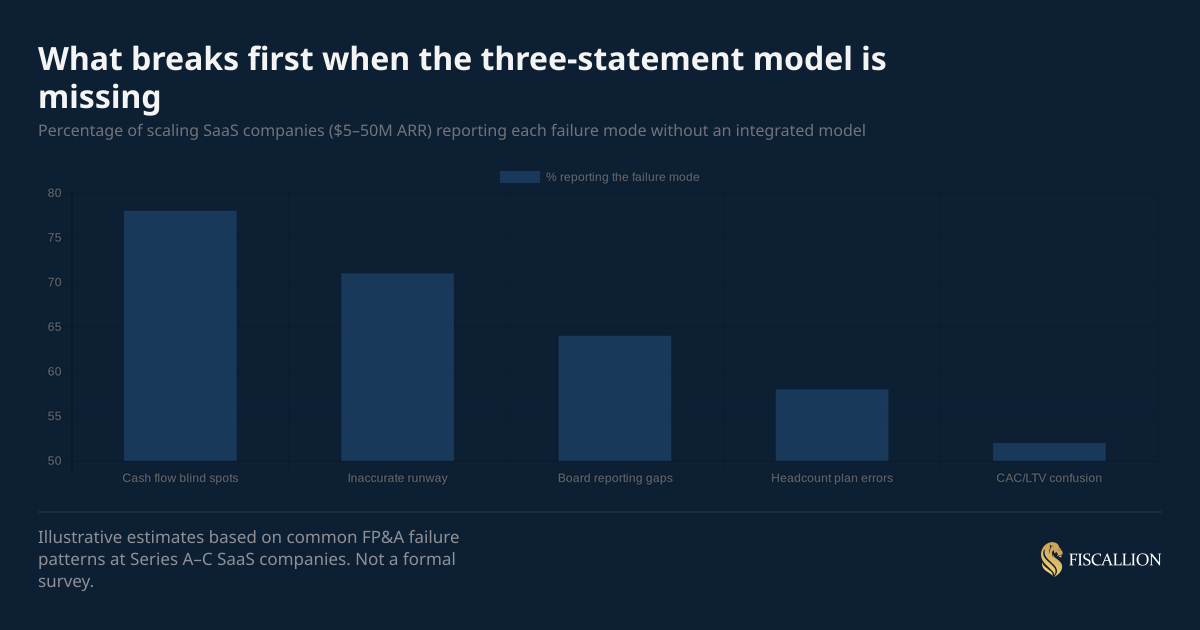
- Most SaaS companies at Series A–C have a P&L. Fewer have a linked balance sheet. Almost none have a cash flow statement that reconciles automatically. That gap is where runway surprises come from.
- The income statement is the engine. The balance sheet is the ledger. The cash flow statement is the truth — it tells you what actually moved.
What you'll learn
This article covers:
- What the three-statement model is and why integration matters
- The income statement: structure, drivers, and SaaS-specific line items
- The balance sheet: what it tracks and why it gets ignored
- The cash flow statement: the indirect method and why it's not redundant
- How the three statements link to each other
- How to build the assumptions engine correctly
- Scenario analysis and how to use it in board prep
- Common mistakes by stage — and what to do instead
- A practical build checklist
What the three-statement model is (and why integration is the point)
A three-statement financial model connects your income statement (P&L), balance sheet, and statement of cash flows into a single integrated structure. Change one assumption — say, your average contract value or your engineering headcount — and every output updates: gross margin, deferred revenue, accounts receivable, net burn, and ending cash balance.
That is the core value. Not the outputs themselves, but the fact that the model propagates trade-offs correctly. Corporate Finance Institute's breakdown of how the 3 financial statements are linked is a useful technical reference for the specific accounting mechanics behind each connection.
Without integration, you can produce a P&L that shows breakeven in 14 months while your cash flow model shows you run out of money in 9. Both models look right in isolation. The problem only surfaces when someone asks a connected question: "If we close that enterprise deal in Q3, does it affect runway before the next raise?" You cannot answer that with three disconnected files.
The interaction effects are usually what reset the founder's plan, not any single number on its own.
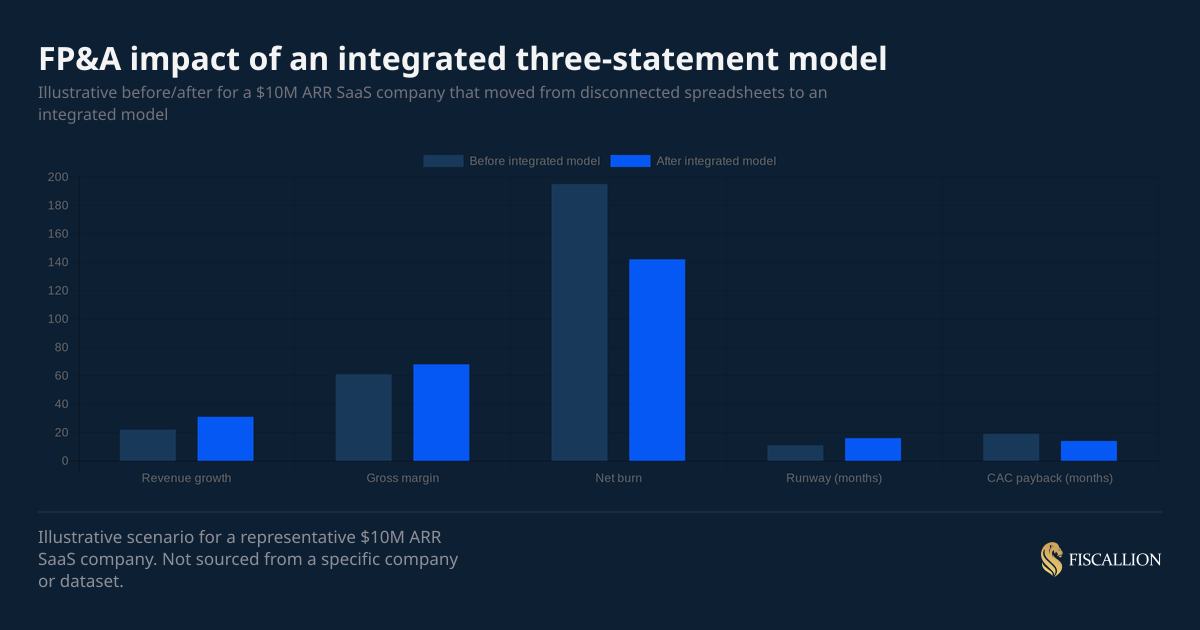
A company at $9M ARR was running their planning off three separate spreadsheets — a revenue model, a headcount and operating expense plan, and a cash forecast. Different owners, different cadences. The founder believed they had 14 months of runway based on the cash forecast, and was preparing to make a senior hire that would push burn up by about $35K monthly.
When we built the integrated three-statement model, two things surfaced. The revenue model was projecting $6.2M in new ARR for the year, but the headcount model only had AE capacity for roughly $4.1M at quota — the revenue line was assuming productivity the headcount plan couldn't deliver. The cash forecast was using a 30-day collection assumption, but actual DSO over the prior six months had averaged 47 days.
Both corrections in the integrated model dropped runway from 14 months to 10. The senior hire got delayed by six months. The founder accelerated their fundraise by a quarter, started conversations earlier, and closed a Series A they would otherwise have been raising under more pressure.
For a scaling SaaS company, the three-statement model is the foundation for:
- Runway forecasting that accounts for deferred revenue drawdown and AR timing
- Board reporting that frames choices, not just history
- Fundraising prep that handles investor diligence questions in real time
- Headcount planning that shows the cash impact of each hire in each quarter
Statement one: the income statement drives everything else
The income statement — also called the P&L or profit and loss statement — shows revenue, cost of goods sold (COGS), gross profit, operating expenses, and net income over a period of time.
For SaaS companies, the income statement is typically monthly in the model, rolling up to quarterly and annual views. The income statement is where your key growth assumptions live.
Revenue build: always driver-based, never a single growth rate
The most common income statement mistake at early-stage companies is forecasting revenue as a flat percentage growth rate. "We assume 8% MoM growth" is not a model — it is a wish. A driver-based revenue model exposes the assumptions:
Build revenue from these five inputs. Every input needs an owner. Someone is accountable for the churn assumption. Someone is accountable for the ACV assumption. If nobody owns an input, it is a placeholder, not a projection.
Gross margin: separate COGS from operating expenses
SaaS gross margin typically runs 65–85% for mature software businesses. According to OpenView's SaaS benchmarks research, gross margin is one of the clearest signals of product maturity and cost structure discipline. If your model is below 60%, the model is telling you something about your cost structure — usually that you are classifying hosting, support, or implementation costs as operating expenses instead of COGS.
A clean SaaS income statement separates:
- COGS: Hosting and infrastructure, customer success (CS) that is directly tied to serving customers, professional services costs, payment processing
- Operating expenses: Sales and marketing (S&M), research and development (R&D), general and administrative (G&A)
The gross profit line — revenue minus COGS — is the number that drives unit economics. If your gross margin is unclear, your CAC/LTV math is wrong downstream.
The income statement does not tell you about cash
This is the critical point most founders miss: the income statement follows accrual accounting. Revenue is recognized when earned, not when cash is received. A $120K annual contract signed in January generates $10K/month of recognized revenue, but $120K of cash hits your bank account in January (or over quarterly installments, depending on payment terms).
The difference between accrual revenue and cash received is what creates deferred revenue in SaaS — and deferred revenue is a balance sheet account, not an income statement item. Without the balance sheet and cash flow statement, you cannot tell the difference between a great month and a cash-destructive month that happened to look great on the P&L.
Statement two: the balance sheet is the ledger most founders stop reading
The balance sheet is a snapshot of what your company owns (assets), what it owes (liabilities), and what equity remains (shareholders' equity) at a point in time. The fundamental equation: Assets = Liabilities + Equity.
For SaaS companies at $5–50M ARR, the relevant balance sheet accounts are more limited than for capital-intensive businesses, but they matter more than most founders treat them.
The balance sheet accounts that move in SaaS
Why deferred revenue is the most misunderstood account
Deferred revenue goes up every time you invoice an annual contract. It goes down as you recognize revenue each month. If you close a lot of business in Q4 and invoice annually upfront, your deferred revenue balance goes up — and that is a liability, not a win on the income statement.
Here is the important cash implication: when deferred revenue increases, that is a source of cash. When it decreases (as you work through backlog), that is a use of cash — even if you are reporting positive recognized revenue. If your company is shrinking annual contract volume but maintaining revenue recognition through backlog drawdown, your cash position will deteriorate before your P&L shows any warning. The FP&A and cash flow implications of deferred revenue are covered in detail in a separate guide.
That distinction is invisible if you are only looking at the income statement.
The balance sheet must balance
By construction, the balance sheet must balance at every period end. Assets must equal liabilities plus equity. In a well-built three-statement model, you do not manually balance it — the model balances automatically because cash is the "plug" that absorbs the difference between operating, investing, and financing activities. If it does not balance, there is an error in the model's linkages.
Statement three: the cash flow statement is the truth
The cash flow statement reconciles net income to actual cash movement. It shows three distinct cash activities:
- Operating cash flows: Cash generated or consumed by the core business — net income adjusted for non-cash items (depreciation, stock compensation) and changes in working capital (AR, AP, deferred revenue)
- Investing cash flows: Cash used for capital expenditures, acquisitions, or other long-term assets
- Financing cash flows: Cash from equity raises, debt draws, or debt repayments
For most SaaS companies at Series A–C, the investing section is minimal (software companies don't buy a lot of fixed assets) and the financing section is episodic (equity rounds, venture debt). The operating section is where you find the real story.
The indirect method: how to build it correctly
The indirect method starts with net income and adjusts for everything that is not cash. FASB's Statement No. 95 established the indirect method as the standard approach for presenting cash flows from operations, and it remains the most widely used format:
Net income (from income statement)
+ Depreciation and amortization (non-cash)
+ Stock-based compensation (non-cash)
± Change in accounts receivable (increase = use of cash)
± Change in deferred revenue (increase = source of cash)
± Change in accounts payable (increase = source of cash)
± Change in prepaid expenses (increase = use of cash)
± Change in accrued liabilities (increase = source of cash)
= Cash from operations
Every change in working capital ties directly to balance sheet movements from one period to the next. That is the linkage. If AR goes from $500K to $650K, that $150K increase means you billed more than you collected — which is a $150K use of cash, even though it looks fine on the P&L.
Net burn vs. gross burn: why the cash flow statement is the source of truth
Most founders track burn as a single number from bank statements. That is cash burn — useful, but it does not tell you which activities consumed the cash. The cash flow statement separates:
- Gross burn: Total operating cash outflows before revenue receipts
- Net burn: Net operating cash flows (negative = burning, positive = generating)
- Free cash flow: Operating cash flows minus capex
When you are modeling scenarios — what happens if we add two AEs in Q2 — you need the operating cash flow structure to trace the impact. Adding two AEs increases S&M expense (income statement), increases payroll accruals (balance sheet), and decreases operating cash flow (cash flow statement). All three statements move. A model that only updates the P&L will show you the wrong runway estimate.
How the three statements link to each other
The integration is what separates a three-statement model from three separate spreadsheets. Here is the explicit link map:
The five critical linkages
If these five connections are hard-coded correctly, the balance sheet will balance automatically, and your cash balance will reconcile period over period without manual patching. CFI's step-by-step guide to linking the 3 financial statements walks through each of these connections with worked examples if you want to validate your model's architecture.
The deferred revenue loop in SaaS
SaaS companies have a linkage that does not exist in most other business models: deferred revenue creates a cash-before-revenue dynamic that looks different on each statement.
When you invoice an annual contract:
- Cash increases (balance sheet, cash flow)
- Deferred revenue increases (balance sheet liability)
- No revenue recognized yet (income statement is unchanged)
Each month as you recognize revenue:
- Deferred revenue decreases (balance sheet)
- Recognized revenue increases (income statement)
- No new cash movement
This loop means your cash flow statement and income statement can tell completely different stories in any given quarter — especially if you are signing large annual or multi-year contracts. Without a model that handles this loop explicitly, your runway estimate and your revenue forecast will routinely disagree.
The assumptions engine: where most startup models fail
The three statements are outputs. The assumptions engine is the input layer that drives them. Every number in the model should trace back to a cell in the assumptions section — no hard-coded numbers buried inside formulas.
The assumptions engine for a SaaS company at $5–50M ARR includes:
Revenue assumptions
- New logo count per month (by segment: SMB / mid-market / enterprise if applicable)
- Average contract value (ACV) per segment
- Gross monthly churn rate by cohort
- Net revenue retention rate (NRR) or expansion rate — the 2024 OpenView/High Alpha SaaS benchmarks report puts median NRR at approximately 110% across B2B SaaS, making it a useful calibration point for your expansion assumptions
- Contract duration and billing cadence (annual upfront, monthly, quarterly)
Cost assumptions
- Headcount plan by department and month (names and roles, not just FTE counts)
- Fully loaded compensation per role (salary + benefits + payroll tax + equity)
- Vendor and infrastructure costs as a percentage of revenue or flat monthly amount
- Sales commission structure (rate, attainment threshold, payment timing)
- One-time items: product launches, office changes, system implementations
Working capital assumptions
- Days Sales Outstanding (DSO): average days between invoice and cash receipt
- Billing to deferred revenue ratio: what percentage of new ARR is billed annually upfront vs. monthly
- Payment terms with vendors (days payable outstanding)
Most models at this stage get the revenue and cost assumptions roughly right but skip the working capital layer entirely. That is why runway estimates are consistently wrong — they model P&L timing instead of cash timing.
Building the model: a stage-specific approach
The right level of model complexity depends on your stage, not your ambition. A 12-tab model with cohort waterfalls and a sensitivity matrix is not better than a clean 5-tab model if the 12-tab version has broken linkages and unowned assumptions.
Series A: foundational model ($3–10M ARR)
At this stage, the goal is a clean, auditable model that connects the three statements without errors. Complexity is the enemy.
What to build:
- Monthly P&L with driver-based revenue (3–5 segments maximum)
- Simple balance sheet covering cash, AR, deferred revenue, AP, and equity
- Indirect-method cash flow statement that ties to the balance sheet automatically
- 12-month rolling forecast plus 3-year annual view
- One base case, one downside scenario
What to skip:
- Multi-year cohort waterfalls (insufficient data to calibrate)
- Segment-level P&Ls (premature without clean cost allocation)
- Valuation or DCF outputs (not what investors are checking at this stage)
Series B: operational model ($10–30M ARR)
At Series B, the model needs to support headcount planning conversations and board reporting at the same time. You have enough historical data to calibrate churn, expansion, and gross margin by segment.
What to add:
- Cohort-level churn and expansion tracking
- Department-level cost structure with headcount planning detail
- NRR by segment (SMB, mid-market, enterprise if applicable)
- Quarterly board reporting view that maps to the model's outputs
- Three scenarios: base, stretch, conservative
What to fix from Series A:
- Replace revenue growth rate assumptions with driver-based inputs
- Add DSO assumptions to the working capital model
- Reconcile model cash to actual bank statements monthly
Series C: decision-grade model ($30–50M ARR)
At Series C, the model is now a capital allocation tool. You are making explicit trade-offs between hiring plans, GTM investments, and runway. The board expects scenario analysis, not just base-case reporting.
What to add:
- Rolling 13-week cash flow alongside the three-statement model for near-term liquidity visibility
- Headcount ROI analysis by team: AE quota attainment, CS expansion contribution, R&D capacity to revenue
- Segment-level P&L with allocated COGS
- Sensitivity tables on key assumptions (churn rate, ACV, expansion rate)
- Integration with actuals from your accounting system (QuickBooks, Xero, NetSuite)
The Fiscallion approach across every stage: separate the assumptions layer from the calculation layer. Every input lives in one tab. Every formula references that tab. Auditors, board members, and future CFOs can trace any number to its source in under two minutes.
Scenario analysis: the real reason to build the model
A three-statement model without scenario analysis is a reporting artifact. With scenario analysis, it becomes a decision tool.
Scenario analysis asks: "If X changes, what happens to cash, runway, and profitability?" It does not predict the future — it shows you the range of outcomes given different assumptions, so you can make decisions that hold up across scenarios rather than optimizing for one. HBR's guide on effective forecasting makes a similar point: the goal of a forecast is not accuracy, it is decision quality under uncertainty.
Three scenarios every SaaS company should model
The conservative case is the most important one to build. Boards want to know the floor — not because they expect it, but because knowing the floor lets you make investment decisions with confidence. If the conservative case still gives you 15+ months of runway, you can invest aggressively in the base case.
What scenario analysis is not
Scenario analysis is not sensitivity analysis. Sensitivity analysis isolates one variable at a time (what if ACV is $5K instead of $7K?). Scenario analysis changes a coordinated set of assumptions together to model a coherent operating environment.
Both are useful. But if you only have time to build one, build the scenario table first. It answers the board question. Sensitivity tables answer the investor diligence question.
Common mistakes and what to do instead
Mistake 1: The income statement exists, the balance sheet is missing
You have a P&L model. You have no balance sheet. You are tracking cash from bank statements.
What breaks: Deferred revenue drawdown is invisible. AR timing is invisible. Runway estimates are consistently 10–20% off because they ignore working capital movements.
What to do instead: Build a skeleton balance sheet first — just five accounts: cash, AR, deferred revenue, AP, and equity. Link it to the income statement and a simple cash flow statement. A five-account balance sheet beats no balance sheet every time.
Mistake 2: Revenue is modeled as a percentage growth rate
Someone locked in "7.5% MoM growth" 18 months ago. Nobody knows where it came from. Nobody owns it. It is now a permanent fixture.
What breaks: When growth slows or accelerates, the model does not tell you why. There is no assumption to update. There is no owner to challenge. The model becomes decorative.
What to do instead: Replace the growth rate with a driver-based build. New logo count x ACV + expansion rate x prior ARR - churn rate x prior ARR = net new MRR. Three inputs. Three owners. One number that you can interrogate.
Mistake 3: The cash flow statement is built separately and manually
The cash flow statement is a standalone spreadsheet that someone updates monthly by copying numbers from the P&L and balance sheet by hand.
What breaks: Any time the P&L or balance sheet is updated, the cash flow statement goes stale. Runway estimates come from one file, net burn comes from another, and they disagree at the board meeting.
What to do instead: Build the cash flow statement as a derived output in the same model. Use the indirect method. Reference balance sheet changes directly. The cash flow statement should never need manual updates if the income statement and balance sheet are correct.
Mistake 4: Scenario analysis is a copy-paste exercise
Someone duplicates the base case tab, changes three numbers, and calls it a conservative scenario.
What breaks: The two tabs drift over time. Assumptions are updated in one but not the other. By Q3, they share almost no structural similarity, and comparing them requires manually tracing each number.
What to do instead: Build scenario toggle using a dropdown at the top of the assumptions tab. Scenarios change assumption values in a lookup table. The model uses one formula set for all scenarios. No duplicate tabs, no drift.
Mistake 5: The model is never reconciled to actuals
The model is built in January. Nobody compares model to actuals in February, March, or April. By Q2, the model is a fundraising artifact, not an operating tool.
What breaks: Assumptions that were wrong in January stay wrong forever. The model loses credibility. By the time you need it for a board meeting or fundraise, it takes three weeks to rebuild.
What to do instead: Reconcile model to actuals monthly. One column, three questions: (1) What did we project? (2) What actually happened? (3) Why is there a gap? If you cannot answer question three, your model's assumptions need revision — not just the actuals row.
When a company hasn't been reconciling, revenue projections are typically 20–35% off and operating expenses 15–25% off by the time someone notices. The errors compound — small misses in month one become large gaps by month six because the model never gets corrected at the source.
A case from a Fiscallion engagement: a company at $7M ARR had an annual plan projecting $11.5M ARR by year-end. By month nine, actual ARR was tracking at $8.9M. The variance was visible from month four. No one was running the comparison.
The wrong assumption at the source was new logo close rate. The model used 22% from late-stage pipeline. Actual close rate was 14%. Pipeline volume was on plan, conversion wasn't. By month nine, the company had over-hired against the planned revenue, so burn was running ahead of plan at the same time revenue was running behind. Year-end forecast got rebuilt at $9.4M, which materially changed the Series A timing the founder had been planning around.
Build checklist: what a complete three-statement model includes
Use this as a completion standard before you present the model to a board or investor.
Assumptions tab
- Revenue drivers: new logo volume, ACV, gross churn rate, NRR/expansion rate
- Billing cadence: annual upfront percentage vs. monthly
- Headcount plan: role, department, start date, fully loaded comp
- Working capital assumptions: DSO, DPO
- One-time items flagged separately
Income statement
- Driver-based revenue build (not a growth rate assumption)
- Gross profit separated from operating expenses
- COGS includes hosting, CS, and payment processing
- Operating expenses split by function: S&M, R&D, G&A
- Monthly view rolling up to quarterly and annual
Balance sheet
- Cash, AR, prepaid, deferred revenue, AP, accrued liabilities, equity
- Deferred revenue reconciles to billing and recognition timing
- AR reconciles to DSO assumption
- Retained earnings rolls forward from prior period + net income
- Balance sheet balances every period (assets = liabilities + equity)
Cash flow statement
- Built using indirect method
- Starts with net income from income statement
- Working capital changes reference balance sheet deltas — no hard-coding
- Ending cash ties to cash line on balance sheet
- Operating, investing, and financing activities separated
Scenarios
- At least two scenarios beyond base case (conservative and stretch)
- Scenarios use a toggle, not duplicate tabs
- Each scenario shows runway, net burn, and breakeven date
Audit readiness
- Every assumption traces to a source cell
- No hard-coded numbers inside formulas
- Model reconciles to last three months of actuals
What this looks like in practice at Fiscallion
When we build three-statement models for SaaS companies at Series A through C, the work almost always starts the same way: we pull the existing files, map what each one covers, and find where the connections are broken.
The most common finding is not that the revenue model is wrong — it is that the model stops at the P&L. There is no balance sheet that captures deferred revenue properly, and there is no cash flow statement that derives from the P&L. Runway is estimated from bank balance minus average monthly burn. That estimate is usually directionally right but tactically useless: it does not tell you what changes if you accelerate hiring, delay a vendor contract, or close a large annual deal in Q4.
The three-statement model does not have to be complex to fix that. It has to be integrated, assumption-driven, and owned. Those three properties do more for decision quality than adding five more tabs ever will.
The SaaS financial model framework we use at Fiscallion is built on this foundation: a clean assumptions engine, three connected statements, and a monthly reconciliation cadence. That structure is what lets founders have board conversations about trade-offs instead of defending numbers.
Build the linkages, own the assumptions, reconcile monthly
The three-statement model is not a deliverable you hand to investors. It is the operating infrastructure that makes every financial decision faster and more defensible.
When the income statement, balance sheet, and cash flow statement are integrated and assumption-driven, you can answer the questions that actually matter in 10 minutes instead of 10 days: How much runway do we have in the conservative case? What is the cash impact of hiring two AEs in Q2? If we discount the enterprise deal to close this quarter, does it change our breakeven timing?
Build the linkages. Own the assumptions. Reconcile monthly. That is the standard.
If you want a working template or want Fiscallion to audit your current model's structure and assumptions, book a working session and we will tell you exactly what is broken and how to fix it.
