

Most Series B processes that stall don't stall because the business is bad. They stall because the founder walked in with a narrative and investors walked in with a scorecard - and the two didn't match.
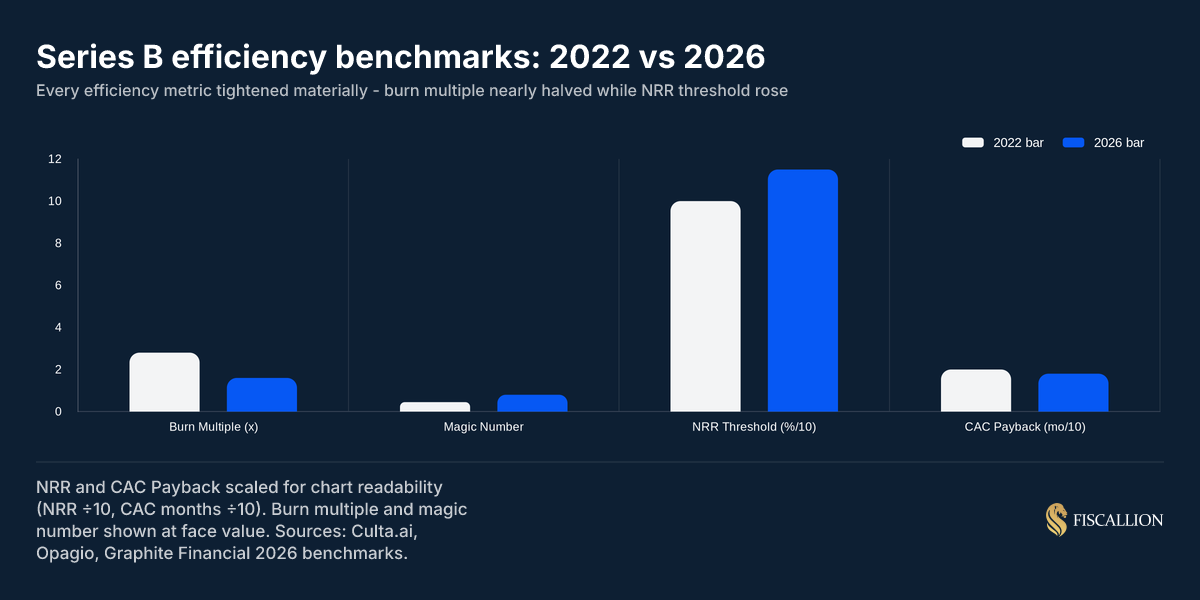
The bar has risen materially since 2022. Median ARR required to close a clean Series B has more than doubled. Burn multiple expectations have nearly halved. Net revenue retention thresholds that were once competitive are now table stakes. Founders using pre-2024 benchmarks to plan their raise are systematically under-preparing.
This guide gives you the complete picture: what the 2026 Series B bar actually looks like, which metrics block deals versus which earn premium pricing, what your financial model and board materials need to show, and how to run a disciplined pre-raise process that shortens diligence friction rather than creating it.
Key takeaways
- The median ARR at Series B close reached $14M in 2026, up from $6.2M in 2022. Companies at $8–10M ARR are increasingly getting bridge rounds or Series A extensions, not B term sheets.
- Three metrics have become hard blockers: burn multiple above 2.0x, NRR below 110%, and a magic number below 0.5. Any one of these kills competitive processes regardless of topline growth.
- Series B investors are not buying your ARR. They are buying evidence that a dollar of capital reliably produces a predictable dollar of recurring revenue without the founder involved in every deal.
What we'll cover
- Why Series B is structurally different from Series A
- The 2026 ARR and valuation benchmarks
- The six metrics investors interrogate in every Series B process
- How blocking vs. contributing metrics work
- What your financial model must show
- Board deck and diligence requirements
- How to run the pre-raise process with discipline
- Common mistakes and their replacement moves
- A Series B readiness checklist
Why Series B is a different kind of question
Series A investors are paying for proof that your business model works. Series B investors are paying for confidence that it scales - specifically, that deploying $20–40M of additional capital into your go-to-market, product, and team will produce a predictable return on that capital.
That shift changes everything about what investors examine.
At Series A, a strong narrative supported by early traction moves conversations. At Series B, narrative is only the context for the numbers. Partners spend the first 30 seconds of every deck review looking at the operating scorecard. If the numbers raise questions, the narrative rarely resolves them.
Fewer than one in four companies that raise a Series A go on to close a Series B, according to PitchBook 2025 data. Of the companies that formally launch a Series B process, roughly 35% close on a term sheet within 90 days. The rest extend the process, reprice, or pull it entirely.
The reason isn't usually a bad business. It's usually a misread of what investors are actually testing.
The 2026 ARR and valuation benchmarks
The numbers have reset materially from the 2021-2022 cycle. Founders planning raises against those benchmarks will find themselves in conversations where investors' internal models simply don't support their target valuation.
Here is what the data shows across primary B2B SaaS Series B rounds through Q1 2026:
Sources: PitchBook, Carta, Culta.ai, Bessemer State of the Cloud 2026. Excludes AI-native infrastructure companies, which trade at significantly higher multiples.
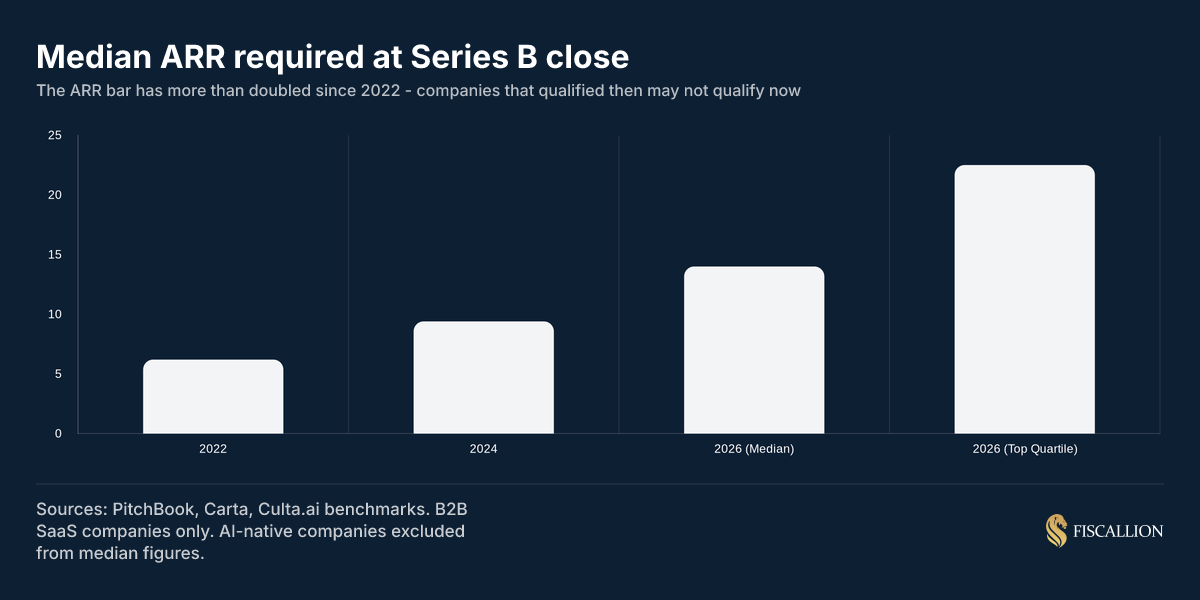
The compression in round size and valuation multiples has not been matched by a compression in the metrics bar. The opposite is true. You're raising a smaller round at a lower multiple, but you need better underlying economics to get there than you would have in 2022. The companies that close at top-quartile terms in 2026 have 130%+ NRR, a burn multiple below 1.0x, and meaningful multi-product or multi-segment revenue.
For SaaS specifically, the median Series B pre-money valuation hit $175M in Q3 2025 per Carta's State of Private Markets data, up 38% year-on-year. The market is rewarding quality aggressively and discounting mediocrity just as aggressively. The spread between a "good" Series B and a "great" one is wider than it has ever been.
Where AI-native companies fit
AI infrastructure and AI SaaS companies operate under different multiples - $45–75M median rounds at 25–40x ARR multiples for foundation model tooling and GPU orchestration plays. This is a narrow band with specific dynamics. Unless your business is genuinely AI-native with documented infrastructure advantages, these comparables will not apply to your process, and anchoring to them in a pitch creates immediate credibility problems.
The six metrics investors interrogate
Every serious Series B investor runs the same internal scorecard, whether or not it's written down. These six metrics are the ones that determine whether the conversation progresses, gets repriced, or stops.
1. ARR - the entry ticket, not the story
ARR is what gets you the first meeting. Typical Series B territory in 2026 sits at $8–18M, with $12–15M as the clean zone where competitive processes happen. Below $8M, you're getting bridge conversations or extension rounds from existing investors. Above $18M, you're in top-quartile territory where multiple funds will engage.
What matters as much as the number is revenue composition. Investors audit:
- Customer concentration (any single customer above 15% of ARR triggers extended review; above 25% is a soft pass at most institutional funds)
- Revenue quality by contract type (annual vs. monthly; multi-year preferred)
- MRR trajectory, not just the headline figure
- Percentage of ARR from the top 10 customers
A $14M ARR business with 40% of revenue from one customer is a structurally different risk profile from a $10M ARR business with well-distributed revenue and 120% NRR. Investors price that difference. For a deeper breakdown of how ARR composition affects investor conversations, see our guide to annual recurring revenue: what it actually tells you.
2. ARR growth rate - where most deals die
Growth rate is the most sensitive input in how investors model your forward value. They are not buying today's ARR. They're paying for a discounted projection of where you'll be in four to six years, and that model is highly sensitive to growth assumptions.
The 2026 benchmarks from ICONIQ's State of Software report, Initialized Capital, and Bessemer data:
The trend matters as much as the point. A company growing 120% that was growing 200% twelve months prior is a deceleration story. A company growing 90% that was growing 60% six months prior is an acceleration story. Partners read the trajectory, not just the current rate.
3. Net revenue retention - the quality signal
NRR is arguably the single most important metric for assessing business quality at Series B. It tells investors whether your product is pulling customers deeper or pushing them out. It also directly determines the multiple. Two companies with identical ARR and growth rates can have an $80M gap in Series B valuation if one has 140% NRR and the other has 95%.
The 110% threshold has shifted from "good" to table stakes since 2024. Companies below 110% face concentrated questioning about expansion mechanics, ICP definition, and whether churn is a product problem or a GTM problem. According to SaaS Capital's annual survey of 1,000+ private B2B companies, companies with NRR above 110% report median growth rates 83% higher than the broader population — a compounding advantage that directly flows into how investors model forward value.
One thing Fiscallion sees repeatedly with clients at this stage: NRR is reported as a single number but it's actually a cohort story. Investors who get serious about a deal will ask for NRR broken down by cohort, by customer segment, and by acquisition year. If your aggregate NRR looks good but your 2023-vintage cohort is deteriorating, that will surface in diligence. Own that data before you walk into the process. Our net revenue retention benchmark guide walks through exactly how to segment and interpret NRR at each ARR stage.
4. Burn multiple - the efficiency signal that blocks deals
Burn multiple - net cash burned divided by net new ARR over the same period - has become the single most-cited metric in Series B partner meetings. David Sacks of Craft Ventures introduced the metric specifically to measure whether capital is converting into recurring revenue at an efficient rate. It measures how efficiently you're converting capital into recurring revenue.
The 2021-era acceptable range of 2.0–3.0x has compressed dramatically:
The denominator matters: this is net new ARR (gross new ARR minus churned ARR), not gross new ARR. If you're calculating burn multiple against gross new ARR, you're flattering the number. Investors recalculate it correctly. Model it the right way before the conversation starts. For a full breakdown of how burn multiple differs from burn rate — and why conflating them causes board-level confusion — see our burn rate vs. burn multiple explainer.
5. Magic number - the GTM efficiency proxy
The magic number (net new ARR in a quarter divided by sales and marketing spend in the prior quarter) tells investors whether your growth came from $1.50 of sales and marketing or $4.00 of it.
The median Series B magic number in 2026 is 0.8, up from 0.45 in 2022. Companies whose growth has come from increasing sales spend faster than ARR are getting passed. The trend over six to nine quarters matters more than any single quarter. For a deeper look at how to calculate and act on this metric, see our SaaS magic number guide.
6. CAC payback and gross margins
CAC payback - the months until cumulative gross profit from a new customer covers the acquisition cost - is the capital efficiency proxy that ties unit economics to cash. Series B partners look for:
- Under 18 months: table stakes for a clean process
- Under 12 months: strong positioning; investors price it into the model
- Above 24 months: raises structural questions about sustainability
Gross margins set the floor for everything else. SaaS gross margins below 70% are now flagged as a cost-of-goods problem at Series B. The 2026 benchmark median sits at 76%, with top-quartile companies above 80%. Below 65%, you face direct questions about infrastructure costs, service components baked into the margin, or pricing structure. Our SaaS gross margin benchmark guide breaks down what investors expect at each stage and how to model a path to improvement.
Blocking vs. contributing metrics: how the scorecard works
Not all metrics carry equal weight. In 2026, the clearest pattern across institutional Series B processes is the distinction between metrics that block a deal and metrics that earn premium pricing.
Blocking metrics - any one of these stops competitive processes
Burn multiple above 2.0x. There is no narrative that recovers this. Investors move to the next deal. Track yours quarterly and build a credible path to 1.5x before starting a process.
NRR below 110%. Below this threshold, you face concentrated questioning about product-market fit at scale, ICP alignment, and expansion mechanics. Strong topline ARR doesn't offset weak retention - investors build forward models that account for both.
Magic number below 0.5. This signals the GTM motion costs too much relative to what it produces. Expect conversations about team structure, channel mix, and whether to cut before you scale.
Single product, single segment. Median Series B companies in 2026 have 2.3 paying SKUs and 28% enterprise revenue mix. Single-product companies raise at 30–40% valuation discounts. "What's product two?" is now a Series B-blocking question, not a Series C question.
Customer concentration above 25%. Any single customer representing more than 25% of ARR is a soft pass at most institutional funds. Above 40% is a hard pass.
Contributing metrics - these earn premium pricing
100%+ YoY growth at 0.8x or better burn multiple. Investors pay for the rare combination of growth and efficiency. This combination commands 25x+ multiples.
Multi-product expansion with documented attach rates. Demonstrating that customers buy product two within 12 months of product one, with the attach rate and time-to-expansion quantified, is the strongest signal that revenue compounds with capital efficiency. This is directly tied to expansion MRR - the mechanics behind sustainable NRR above 120%.
Enterprise revenue mix above 30%. Longer contracts, higher retention, harder to displace. Companies blending PLG and enterprise at 30–50% enterprise mix get valuation premiums from both growth signals.
Rule of 40 above 47%. The 2026 median Series B Rule of 40 sits in the mid-to-high 40s. Above 50% with an improving trajectory commands premium attention. Make sure investors know how you calculated it - partners audit the construction before they price the metric. See our Rule of 40 guide for the exact formula and how the definition of "profit margin" in the denominator can shift your score by 10+ points.
What your financial model must show
A pitch deck gets you meetings. A credible financial model gets you a term sheet.
Series B investors in 2026 require a model that is driver-based, cohort-based, and three-statement linked. A founder spreadsheet with top-down growth assumptions - "we'll grow 80% next year" with no operational inputs underneath - creates more diligence questions in two hours than a board-grade model resolves in two months. Our SaaS financial model guide covers how to build this from the ground up.
The four layers of a Series B-grade model
Layer 1: Operational drivers. Sales rep count, ramp time (typically 4–6 months), quota attainment (60–70% mid-market median), pipeline coverage (3–4x), win rate, ACV, and sales cycle length. Marketing inputs: paid spend, organic pipeline, MQL-to-SQL conversion. Every revenue dollar traces back to a specific operational input.
Layer 2: Cohort revenue build. Each monthly customer cohort retains, expands, and churns independently rather than blending into a single retention curve. This is how investors identify whether your NRR is improving or deteriorating at the cohort level. The mechanics of building a proper cohort model are covered in our SaaS cohort analysis guide.
Layer 3: Three-statement link. P&L revenue ties to deferred revenue on the balance sheet; deferred revenue ties to cash flow from operations. No number lives in isolation. If an investor asks what happens to your runway if NRR drops 8 points and CAC payback extends 6 months, your model should answer in seconds with three statements re-rolling.
Layer 4: Scenario outputs. Base, bull, and bear cases that sensitize the assumptions investors care about most - primarily ARR growth rate, NRR, sales hiring pace, and gross margin. This shows that you understand the trade-offs, not just the upside.
The 2026 investor bar: your model should hold ±5% accuracy for the next quarter and ±15% for the next 12 months. ICONIQ's 2025 State of Software and Benchmarkit's 2025 SaaS Performance Metrics both flag forecast variance as a top-three reason for failed Series B processes.
What investors test in the model review
Investors will probe three things:
- Assumption ownership. Who built the model? Can you defend the inputs? If the answer is "our CFO built it and I haven't looked at the inputs," that's a leadership signal, not just a modeling gap. Someone on your team needs to own every input - not just the outputs.
- Coherence between model and actuals. Does your model's historical section reconcile with your bank statements? Does your MRR table match your subscription management system? Incoherence here creates more friction than any individual metric.
- Headcount plan integration. Series B models without a bottoms-up headcount plan are incomplete. Investors want to see who you're hiring, what they cost, when they start, and what revenue they're expected to generate or support. Hiring decisions that aren't modeled create runway uncertainty. Our cash flow forecasting guide explains why payroll-driven burn spikes are the most common source of runway surprise in Series B diligence.
Board deck and diligence requirements
A Series B board deck is not a marketing document. It's a thinking document that says what changed, what you concluded, and what you'll do next - with metrics as evidence, not the main act.
The canonical 2026 structure that serious investors expect:
The "asks" slide is where most Series B-stage board decks fail. Investors are not there to ratify what you've already decided. They're there to help you make better decisions under uncertainty. Framing the conversation as "here are the trade-offs we're evaluating and where we want your input" is materially different from "here's what we did and what we're planning." The former builds trust. The latter builds distance. Our SaaS board reporting framework covers the full four-part structure for decision-ready metrics, including the reporting cadence that converts a metrics system into an operating rhythm.
Data room structure for Series B diligence
The due diligence process at Series B is significantly more detailed than Series A. Financial model scrutiny is consistently cited as the most time-intensive stage, with average diligence timelines stretching to 14–18 weeks in 2025-2026 conditions.
Organize your data room before you start the process. Every week you spend building it after receiving investor interest is a week of momentum lost. The categories to have ready:
Financials:
- Three-statement model with historical actuals and 24-month forward projection
- Monthly P&L going back at least 24 months
- Audited financials (or audit-ready books if you're pre-audit)
- ARR bridge with new, expansion, contraction, and churn broken out monthly
- Cohort analysis by customer acquisition quarter
Metrics package:
- ARR growth waterfall
- NRR and GRR by segment and cohort
- CAC payback by acquisition channel
- Burn multiple trend (trailing 8 quarters minimum)
- Magic number trend
- Rule of 40 with construction methodology disclosed
Operational:
- Headcount plan with compensation model
- Sales team structure, quota, and attainment history
- Pipeline by stage with conversion rates
- Customer list with ARR, contract start/end dates, and NPS or health scores
Legal:
- Cap table, fully diluted
- All existing investor agreements and side letters
- Outstanding 409A valuations
The assumption ownership test: every forward-looking input in your model has a named owner who can explain why the number is what it is and what would cause it to move. Investors who find a model full of unexplained assumptions don't just flag a metrics problem - they flag a leadership problem.
How to run the pre-raise process with discipline
The most expensive mistake in a Series B process is starting it before you're ready. Companies that launch fundraising before reaching metrics thresholds receive materially worse valuations and terms than those who raise from a position of prepared strength, according to NVCA research on Series B dynamics.
The practical pre-raise timeline:
12 months before target raise date:
- Identify your blocking metrics and build a remediation plan with quarterly checkpoints
- Start tracking burn multiple, magic number, and NRR on a monthly basis
- Initiate financial audit if you haven't had one; clean up any accounting gaps
- Align the board on the target raise timeline and the metrics targets that justify it
6 months before target raise date:
- Build your investor target list (30–50 names, tiered by fit and warm intro access)
- Run scenario models: what is your valuation range at the current metrics trajectory vs. the improved trajectory? Our SaaS valuation multiples guide covers how NRR, gross margin, and Rule of 40 interact to determine your multiple range
- Begin organizing the data room - financials, metrics package, and legal documents
- Identify which executives need to be in place before diligence starts
3 months before target raise date:
- Start warming conversations with 3–5 investors who are not your primary targets. Use these to test your narrative and identify where the hard questions come from.
- Finalize the financial model with the board's review
- Confirm your 409A is current - an expired valuation creates complications for any option grants during a live fundraising process. Our equity compensation guide covers the 409A mechanics and why timing it to the raise window matters.
At launch:
- Start with your highest-conviction targets, not your backup list
- Run a process with a clear timeline (6-8 weeks for first-round conversations to term sheets), not an open-ended series of meetings
- Protect operational momentum during the process - investor meetings should not pull your sales leadership off active deals or your head of product off a roadmap cycle
One number most founders get wrong
Many founders calculate how much to raise by looking at what "sounds right" for a Series B in their sector. The correct approach is the opposite: calculate the capital required to reach the milestone that sets up your Series C or path to profitability, add 24 months of runway at your expected post-raise burn rate, and add a 15–20% buffer for execution variance.
The formula: (Monthly burn post-raise × 24 months) + growth investment capital - current runway = raise target.
This is the same logic used in equity dilution planning. Raising more than you need increases dilution without improving your outcome. Raising less than you need creates a forced, time-pressured fundraise 18 months from now. The number you raise should be defined by what it funds, not by what the market is paying. For a full walkthrough of how to calculate runway under different scenarios, see our startup runway calculation guide.
Common mistakes and their replacement moves
Mistake: Starting the process because an investor reached out.
A VC taking a meeting is weak signal - it's their job. Investor interest is not investor readiness. Starting a process because of inbound interest rather than metric readiness is how you end up in 40 investor meetings discovering mid-process that your NRR data doesn't segment the way buyers expect.
Replacement move: Complete an internal readiness assessment against the blocking metrics before responding to any investor interest with a formal process launch. If the metrics clear the bar, engage. If not, set a date when they will and build toward it.
Mistake: Presenting ARR as the story.
ARR is the entry ticket to get meetings. It is not the investment thesis. Investors who get past the first deck meeting want to know whether capital-efficient growth is repeatable without the founder in the room.
Replacement move: Frame your story around the operational proof points: non-founder-led sales motion working for at least two to three quarters, documented expansion mechanics, and a management team that can execute the 24-month plan without day-to-day founder involvement in execution.
Mistake: Reporting NRR as a single number.
A 115% aggregate NRR sounds strong. If your 2022-vintage cohort is at 135% and your 2024-vintage cohort is at 95%, you have a deteriorating retention problem that will surface in investor diligence even if the aggregate looks clean. SaaStr's analysis of high-NRR businesses shows exactly how aggregate retention can mask logo churn, cohort deterioration, and new customer acquisition stalls - all of which surface in Series B diligence.
Replacement move: Build NRR as a cohort view before you enter the process. Understand why it varies by acquisition cohort, customer segment, and contract type. Own the explanation before investors find the gap.
Mistake: Building the financial model from the top down.
"We'll grow 85% next year" with a single growth rate assumption in cell B2 of a spreadsheet is not a financial model. It's a guess with formatting.
Replacement move: Build a driver-based model that starts with operational inputs - rep count, ramp, quota attainment, ACV, churn rate by cohort - and produces revenue as an output. Series B investors will interrogate the inputs. If you can't defend them, the model becomes a liability. Our FP&A for startups guide shows how the FP&A function should connect operational inputs to cash so the model survives investor scrutiny.
Mistake: Treating board decks as history reports.
A board deck that spends 14 slides on what happened last quarter and zero slides on the decisions you need help making is not preparing you for a Series B. It's giving investors a polished retrospective.
Replacement move: Reframe every board meeting around two to three explicit choices you're facing in the next 90 days - with the trade-offs modeled, not asserted. Investors who see you operating with decision-grade discipline have confidence you'll deploy their capital the same way.
Series B readiness checklist
Use this before launching a formal process. Every "no" represents either a metric to fix or a documentation gap that will surface in diligence.
Metrics readiness
- ARR is at or above $12M, or you have exceptional metrics compensating for scale (NRR above 130%, growth above 150% YoY)
- YoY ARR growth is above 80% with a stable or accelerating trajectory
- NRR is above 110%, segmented by customer cohort, with documented expansion mechanics
- Burn multiple is at or below 1.5x on a trailing four-quarter basis
- Magic number is at or above 0.7 on a trailing two-quarter average
- CAC payback is under 18 months by acquisition channel
- Gross margins are above 70%, with a documented path above 75%
- No single customer represents more than 20% of ARR
- Rule of 40 is at or above 40%, with construction methodology documented
Financial model readiness
- You have a driver-based, three-statement model with cohort-based revenue build
- The model's historical section reconciles with audited or audit-ready financials
- You have base, bull, and bear scenario outputs that sensitize ARR growth, NRR, and burn
- The headcount plan is integrated into the model with full compensation detail
- Every input has a named owner who can defend the assumption in a room
Board and investor readiness
- Board decks frame decisions and trade-offs, not just historical reporting
- You have 24 months of clean monthly P&L with ARR bridge
- The cohort retention analysis is ready and segmented by acquisition quarter
- Your 409A is current (updated within the last 12 months)
- Your cap table is clean, fully diluted, with all SAFEs converted
- Your data room is organized and can be activated within two weeks of the process launch
Process readiness
- You have a tiered investor target list of 30–50 names with warm intro paths identified
- You have completed three to five "test" conversations to stress-test the narrative
- You have defined the milestone your raise will fund and the timeline to reach it
- You can run the process without pulling key operators off their primary work for more than 20% of their time
Conclusion
Series B is not harder because investors became more demanding. It's harder because the benchmark for what a scalable SaaS business looks like has been reset by the companies that successfully raised and scaled through 2023–2025 with genuine capital discipline.
The founders who close strong Series B rounds are not necessarily running faster-growing companies. They're running companies where the finance function produces decision-grade clarity - where NRR is understood at the cohort level, where the model connects operational inputs to cash, where board meetings frame trade-offs rather than report history, and where the team can defend every assumption in the data room.
That's not a fundraising problem. That's an FP&A problem.
Fiscallion works with SaaS founders at exactly this stage - typically $8–30M ARR, preparing for a Series B or Series C process - to build the financial model, metrics infrastructure, and board reporting framework that survives investor scrutiny. Not because the business needs a CFO, but because the decision-quality needs to get sharper before the raise starts.
If you're 6–12 months from a Series B and want an honest read on where your metrics and model stand against the 2026 benchmarks, book a working session with the Fiscallion team. We'll run the readiness assessment and tell you exactly what needs to move.
