

Usage-based pricing is not a growth hack, it is a forecasting problem wearing a pricing costume. The decision you are actually making is whether you can predict revenue, cash, and CAC payback when your customers' consumption, not your sales team, sets the invoice. Get the model right first: revenue variance range, cohort-level retention, and CAC payback bands. Get the model wrong, and you will find out in a board meeting, not a planning session.
This article gives you the FP&A framework to evaluate usage-based pricing the way a CFO would: as a revenue architecture decision with direct consequences for runway forecasting, board reporting, and unit economics, not as a product or growth experiment.
Key takeaways
- Usage-based pricing shifts revenue risk from your sales team to your customers' behavior. That changes how you forecast, not just how you bill.
- Model revenue as a range, not a point estimate. Usage-based revenue commonly swings 3 to 5x more month to month than seat-based revenue.
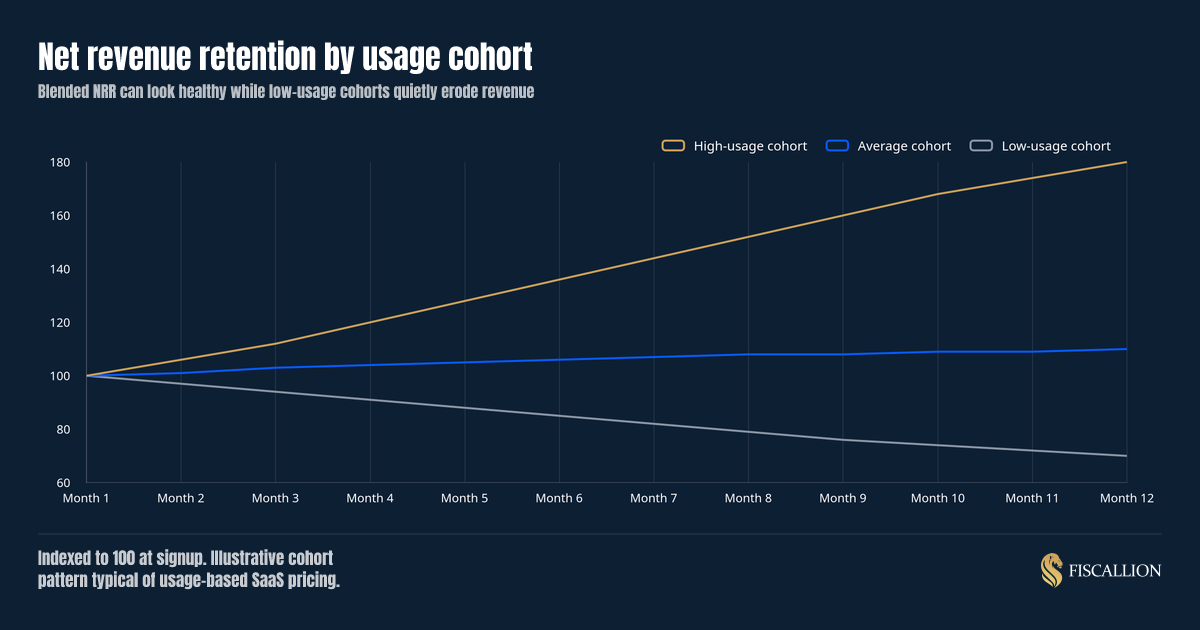
- Blended NRR hides the real story. You must track cohort-level NRR by usage tier to isolate hyper-expanding power users from accounts that are quietly contracting.
- Averages lie about CAC payback. Model your payback periods as a band across your top, middle, and bottom consumption cohorts rather than averaging them into a single, misleading metric.
- Hybrid pricing (a platform fee plus usage) is usually the more defensible move for companies between $5M and $50M ARR because it keeps a forecastable floor while preserving expansion upside.
- Data infrastructure is your true bottleneck. Before rewriting your pricing page, verify that your data pipelines can automatically map usage events to billing events. For most $5M–$50M ARR companies, this infrastructure gap is the real project.
What we'll cover
Usage-based pricing shifts revenue risk from your sales team to your customers' day-to-day behavior. This article provides the strategic FP&A framework required to evaluate consumption models the way a CFO would: as a core revenue architecture decision with direct consequences for your runway forecasting, board reporting, and unit economics.
What usage-based pricing actually changes in your model
Usage-based pricing means customers pay based on consumption, such as API calls, active seats that fluctuate, data processed, transactions run, or credits consumed, instead of a fixed subscription fee locked in at signup.
The pitch is obvious: pricing tracks value delivered, expansion happens automatically as customers grow, and you remove the friction of negotiating seat counts. Snowflake, Twilio, and Datadog built durable businesses on some version of this model, and OpenView Partners' research found that companies with usage-based pricing grow faster than those without it.
Under a seat-based model, next month’s revenue is a known constant. Under a usage model, your revenue is a distribution of consumption outcomes tied directly to your customers' macro environment. To manage this volatility, your finance dashboard requires three specific shifts:
- Forecast ranges, not points: Stop presenting a single, static forecast line to your board. Calculate expected revenue using your historical standard deviation to show a clear baseline range (e.g., Expected Revenue $\pm$ Usage Volatility). Usage-driven revenue routinely swings 3x to 5x more month-over-month than seat licenses.
- Segmented NRR tiers: High-consumption accounts expanding at 130% NRR can easily mask a bottom-tier cohort that is quietly churning out at 80% NRR, leaving you with a comfortable but dangerously fragile 105% blended average.
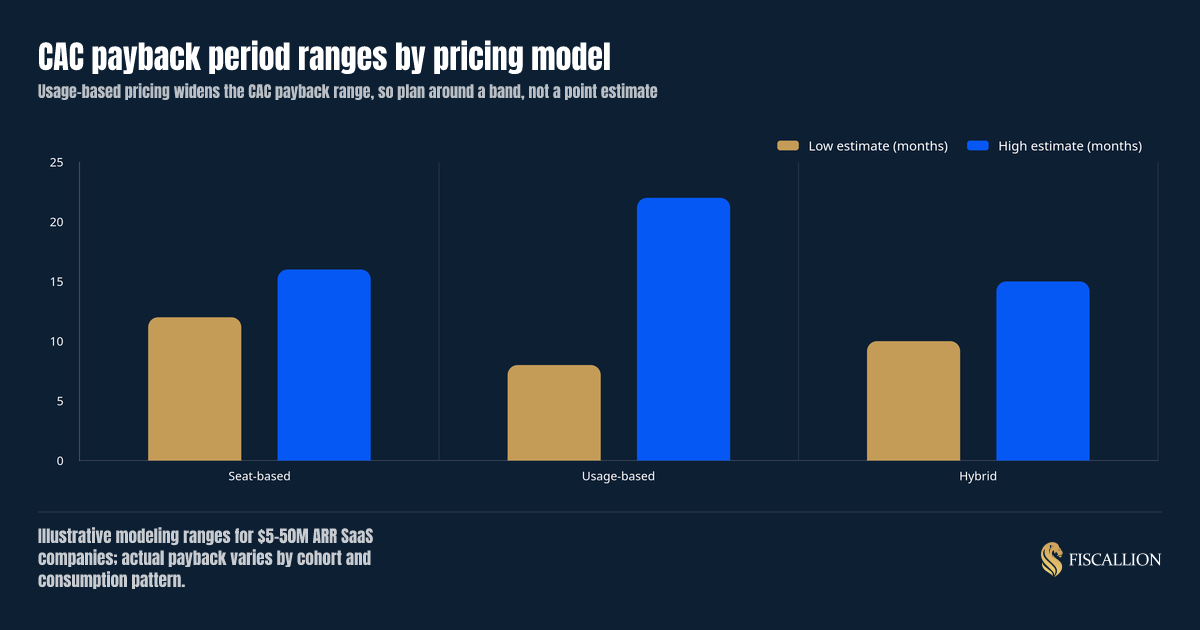
- Banded CAC payback: If your top-usage cohort pays back its acquisition cost in 8 months while your bottom cohort takes 22 months, your blended average looks healthy while your marketing spend is actively destroying capital efficiency in lower tiers.
None of this means usage-based pricing is a bad decision. It means it is a bigger decision than most teams treat it as, and it needs a bigger model behind it than "let's bill by usage and see."
How to calculate the metrics that actually matter
You cannot evaluate usage-based pricing with your existing seat-based dashboard. You need four calculations layered on top of what you already track.
1. Revenue variance range, not a single forecast number
Instead of forecasting one revenue number for next month, calculate a range using your historical usage volatility by cohort:
Expected revenue = Base fee (if hybrid) + (Median usage per cohort x price per unit)
Revenue range = Expected revenue +/- (Standard deviation of usage x price per unit)
Run this per cohort, then roll up. A single blended range across your whole customer base will understate the swing in any individual segment.
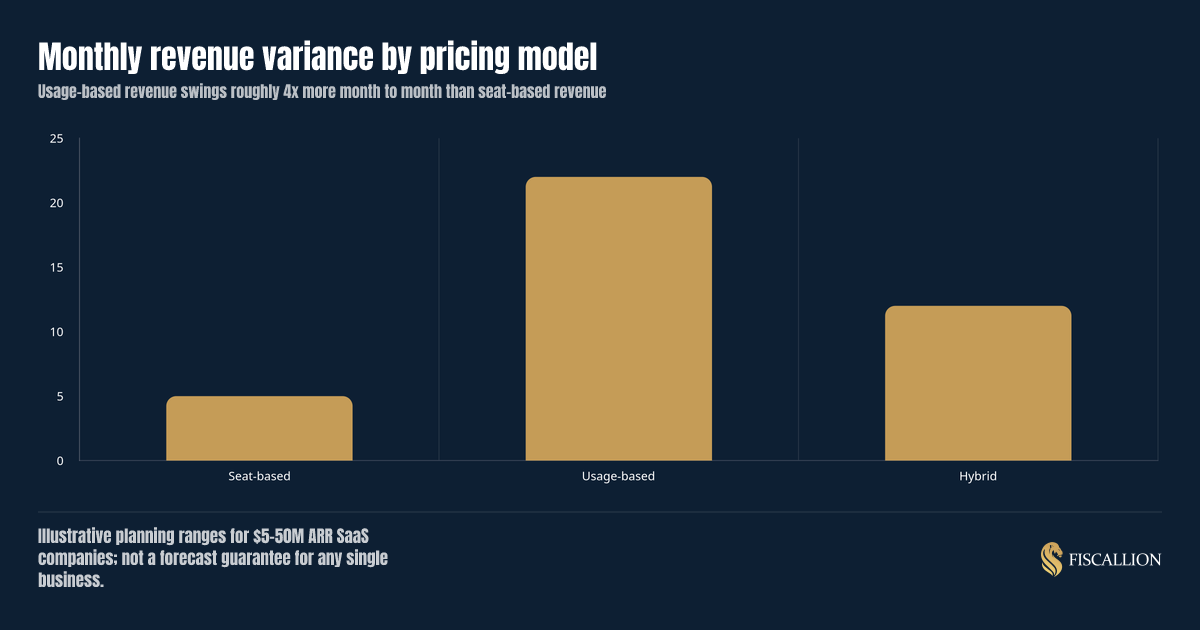
The gap between seat-based and usage-based variance above is the reason boards get nervous about usage pricing. It is not that usage revenue is worse, it is that it is wider, and most reporting still presents it as a single confident line.
Structuring this hybrid model effectively allows finance teams to balance predictable baseline revenue against consumption-driven expansion.
2. Cohort-level net revenue retention (NRR), segmented by usage tier
Blended NRR is a vanity number under usage pricing. Calculate NRR separately for at least three usage tiers: high-consumption accounts, average accounts, and low-consumption accounts.
Cohort NRR = (Starting ARR + expansion - contraction - churn) / Starting ARR
Do this monthly, and track it as a trend line per cohort, not a snapshot. ChartMogul's SaaS retention report, covering 2,500+ SaaS businesses, found that companies with 100%+ NRR grow at double the speed of those below that line — but achieving it is getting harder across every ARR segment. Our NRR benchmark guide breaks down what the number should look like at your specific ARR and ACV.
3. CAC payback period as a band, by cohort
CAC payback (months) = CAC / (Average monthly revenue per account in that cohort x gross margin %)
Run this for your highest-usage cohort and your lowest-usage cohort separately. The spread between them is the number your board actually needs, not the blended average. We cover the full methodology and benchmarks, including how to isolate the right gross margin inputs, in our CAC payback period guide.
4. Usage-adjusted LTV
LTV = (Average monthly revenue per cohort x gross margin %) / (Monthly churn rate for that cohort)
Then present LTV:CAC as a range across cohorts, not a single ratio. A blended 4:1 LTV:CAC can be hiding an 8:1 top cohort and a 1.5:1 bottom cohort that is destroying margin.
How to interpret what the numbers are telling you
Numbers without interpretation are just noise in a spreadsheet. Here is how to read each calculation above.
Wide revenue variance is not automatically bad. It becomes bad when it is unmanaged, meaning nobody has modeled a downside scenario and cash runway assumes the midpoint holds every month. Wide variance managed with a range-based forecast is a normal cost of expansion-driven pricing.
Diverging cohort NRR is the real signal, not the blended average. If your high-usage cohort is expanding at 130% NRR while your low-usage cohort sits at 80%, your blended number might land at a comfortable 105%. That comfortable number is masking a churn problem in your bottom third of accounts that will eventually drag the blend down as the high-usage cohort matures and its growth rate slows. SaaS Capital's private-company retention benchmarks show that median NRR for private B2B SaaS companies sits near 102% — but that median masks wide cohort-level dispersion within individual companies.
A wide CAC payback band tells you where to spend, not just how much to spend. If your top-usage cohort pays back CAC in 8 months and your bottom cohort takes 22, that is not a reason to panic, it is a reason to change how sales and marketing qualify and target accounts. You are likely acquiring some customers who will never generate enough usage to justify their acquisition cost. As we show in our breakdown of why your blended CAC payback is lying to you, a single blended number can look healthy while individual channels are quietly destroying capital efficiency.
LTV:CAC as a single ratio invites a debate, not a decision. This is the pattern we see most often at the FP&A level: the leadership team spends a meeting arguing whether LTV:CAC is "really" 3:1 or 4:1, when the more useful question is which cohort is dragging the ratio down and what you do about that cohort specifically. The range and the cohort breakdown are the actual decision-grade output, as we lay out in more depth in our FP&A framework for startups.
Common mistakes and the replacement move
The practical asset: a usage-based pricing readiness checklist
Before you announce a pricing change or launch a consumption model, run your financial infrastructure through this checklist. If you cannot check a box, that infrastructure gap is your next operational project, not the pricing launch date.
- Automated usage pipelines: Usage events are captured in a system that ties directly to your billing platform without manual data normalization or human intervention.
- Clean financial ledgering: Billing data flows seamlessly into your revenue reporting without an offline spreadsheet acting as the connective tissue.
- Baseline historical data: You have at least two full quarters of historical consumption data to establish accurate cohort baselines before going live.
- Pre-defined cohort thresholds: You have defined high, average, and low usage thresholds in writing before launch, preventing the team from moving boundaries later to match a flattering quarterly narrative.
- Banded unit economics: You can calculate and track CAC payback periods separately for each consumption cohort, rather than relying on a single corporate average.
- Range-based board templates: Your upcoming board deck templates have been redesigned to report against a forecast band (Low, Expected, High) instead of a static point target.
- Documented model ownership: A specific team member explicitly owns the data assumptions behind the consumption forecast, rather than leaving ownership implied.
- Concentration stress-testing: You have modeled a severe downside scenario demonstrating exactly how your cash runway responds if your top three usage-driven accounts contract by 20% or more.
- Tight review cadence: Your finance function (whether internal, fractional, or advisory) reviews cohort-level NRR and CAC payback bands on a strict monthly cadence, not just during annual planning.
Failing to align these systems before a launch introduces significant risk to core revenue data.
The Bottom Line: Pricing changes don't solve visibility problems in your finance stack; they amplify them. If more than two or three of these boxes remain unchecked, fix the measurement infrastructure before you touch the pricing page.
Beyond the pricing page: building a forecastable architecture
Usage-based pricing can be the right structure for a SaaS company between $5M and $50M ARR, particularly one where value scales cleanly with consumption. But it is a finance infrastructure decision before it is a pricing decision. The companies that get burned are not the ones that chose usage-based pricing, they are the ones that chose it without building the cohort-level forecasting, CAC payback banding, and range-based board reporting to support it.
This is the kind of decision where hiring a full-time CFO too early adds reporting polish without fixing the underlying assumption ownership, and where a generic dashboard tool will show you the usage data without telling you which cohort is actually driving or dragging your numbers. What you need is the FP&A judgment to translate consumption data into a forecast range, a cohort view, and a clear next move for your board.
If your metrics definitions and forecasting model have not been stress-tested against a pricing change like this, audit your metrics definitions and forecasting model before you touch pricing. That is the conversation Fiscallion has with founders at exactly this stage, and it is a shorter, cheaper conversation to have before the pricing launch than after the board asks why the forecast missed.