

Your freemium conversion rate is not a scorecard. It is an input into your cash forecast, your headcount plan, and the story you tell your board about why growth costs what it costs.
Most operators track the number, benchmark it against a blog post, and move on. That is the wrong sequence. Before you compare your 3.4% to anyone's benchmark table, you need to know what denominator you are using, what window you are measuring, and what decision the number is actually supposed to inform. Get that sequence right and freemium conversion rate becomes one of the clearest signals you have for whether your free tier is buying you customers or just buying you infrastructure cost.
Key takeaways
- Freemium conversion rate = (free users who upgraded to paid ÷ total free users in the cohort) x 100, measured over a defined window, usually 3 to 6 months.
- Typical self-serve freemium converts at 2-5%, sales-assisted freemium at 5-7%, and free trials (a structurally different model) at 15-25%+. Comparing across models is the single most common benchmarking error.
- The denominator and the time window change the number more than product quality does. A rate on activated users looks very different from a rate on all signups.
- Treat freemium conversion as a cohort range, not a single monthly percentage. A range tells you the trend and the confidence interval; a single number invites false precision in a board deck.
- The freemium conversion rate feeds directly into your runway model: it sets your blended CAC, your paid-user growth curve, and your infrastructure cost per free user. Get it wrong in your forecast and your cash runway estimate is wrong too.
- The fix for a weak rate is rarely "add more upgrade prompts." It is almost always upstream: activation gaps, a mispriced value ceiling on the free tier, or a paywall placed before or after the moment of proven value.
What we'll cover
- What freemium conversion rate actually measures, and what it does not
- The calculation, including the two variables that quietly change your number
- How to interpret your rate against real benchmarks, by model and by category
- What to do next: the decision sequence once you have a defensible number
- Common mistakes founders make when reporting this metric, and the better move
- A practical cohort tracker you can put in front of your board this quarter
What freemium conversion rate actually measures
Freemium conversion rate is the percentage of users on your free plan who upgrade to a paid plan within a defined period. That is the whole definition. What trips people up is everything attached to it.
The metric is a proxy for three things at once: whether your free tier proves real value, whether your paywall sits at the right threshold, and whether your acquisition channels are bringing in people who could ever plausibly pay. A low number can mean any of the three. Most teams assume it means the first and start rewriting onboarding copy, when the actual constraint is the third: they are acquiring free users who were never going to convert, through channels optimized for signups instead of intent.
This is why Fiscallion treats freemium conversion the same way we treat CAC and LTV: as a range tied to a cohort, not a single figure you drop into a slide. A monthly blended rate hides more than it reveals. The number that actually informs a decision is the six-month conversion curve for a specific signup cohort, segmented by acquisition channel and plan tier.
How to calculate freemium conversion rate
The base formula is simple:
Freemium conversion rate = (free users who upgraded to paid ÷ total free users in the cohort) x 100
Example: 10,000 free signups in January, 340 of them upgrade to a paid plan by the end of June. That cohort's six-month conversion rate is 3.4%.
Two decisions change this number more than anything else you will do to your product:
- The denominator. Are you counting every signup, or only users who reached activation, meaning they completed the core action that proves your product's value? A rate measured against all signups will always look lower than a rate measured against activated users, because a meaningful share of signups never open the product a second time. Neither denominator is wrong, but you need to pick one and hold it constant, because switching denominators mid-year is how founders accidentally report a "doubled" conversion rate that is really just a definition change.
- The window. Freemium upgrades trickle in over months, not days, unlike free trials where the clock forces a decision. A rate measured at 30 days will understate a product where most upgrades happen closer to day 90. The standard practice, and the one we recommend, is a six-month cohort window, matching how most published benchmarks (OpenView, ChartMogul, ProductLed) define it.
Track it this way:
| Element | Recommended definition |
|---|---|
| Cohort | Group by signup month |
| Denominator | Activated users, tracked separately from raw signups |
| Window | 6 months from signup, with a 30/60/90/180-day breakout |
| Segmentation | By acquisition channel, plan tier, and company size band |
| Reporting cadence | Monthly refresh, quarterly board view |
If your finance stack cannot produce this cohort view without a manual spreadsheet reconciliation, that is worth noting: it is usually the first sign that your metrics live in three tools and nobody's definition matches, which is the same fragmentation problem we described in FP&A for startups: the decision-grade framework for $5-50M ARR.
How to interpret your rate against real benchmarks
Here is where most benchmark posts fail you: they publish one number and let you assume it applies to your business model. It does not. Freemium and free trial are structurally different motions, and comparing your freemium rate to a free-trial benchmark will make you think you have a conversion problem when you actually have a model-mismatch problem.
| Model | Good (50th percentile) | Great (75th-90th percentile) | What drives the gap |
|---|---|---|---|
| Freemium, self-serve | 3-5% | 6-8% | Free tier proves value; no sales touch |
| Freemium, sales-assisted | 5-7% | 10-15% | Sales works high-intent free accounts |
| Freemium to reverse trial | ~8% median | up to 12% | Timed premium trial layered on free tier |
| Free trial, no card required | 4-6% | 10-15% | Lower signup friction, lower intent filter |
| Free trial, card required | 25-35% | 50-60% | Higher intent filter at signup, structurally different funnel |
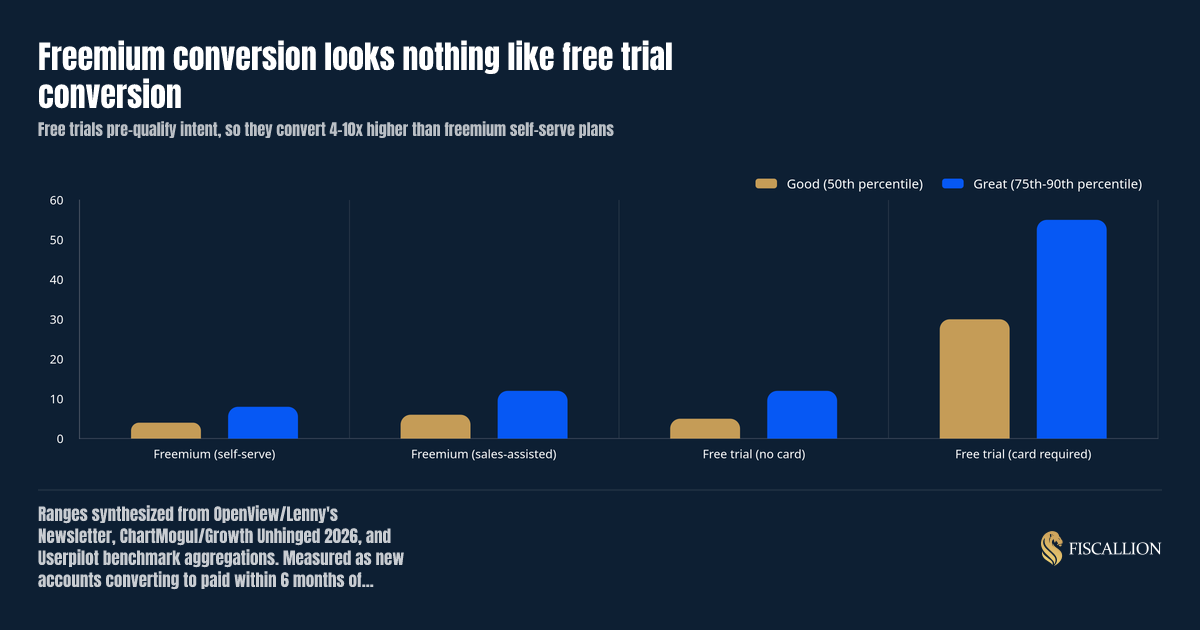
These ranges are anchored in the two largest published datasets. Lenny's Newsletter and OpenView's benchmark study of 1,000+ products established the 3-5% good / 6-8% great bands for self-serve freemium. The 2026 ChartMogul and Growth Unhinged conversion report, analyzing 200 B2B products, confirmed a median of 8% across all models—with a 10x spread between top and bottom performers, and credit-card-required trials converting at 30%, more than 5x card-free trials.
The gap between freemium and card-required free trial is not a quality gap. It is a filter gap. Nobody enters a credit card unless they are seriously evaluating a purchase, so the population entering that funnel is pre-qualified in a way freemium deliberately is not. Freemium is built to cast the widest possible net; a low conversion rate on that wide net is the model working as intended, not the model failing.
Category matters too, though less than the model choice does. Legal tech and RegTech products convert freemium users at close to double the rate of consumer-adjacent categories like real estate tools or EdTech, largely because the paid trigger (compliance risk, seat-based team use) is sharper and easier to justify internally. First Page Sage's 2025 SaaS conversion dataset corroborates the category spread: RegTech trial-to-paid converts at 23.6% while freemium-to-paid sits at just 2.6% across all categories—a reminder that model choice dominates category effects.
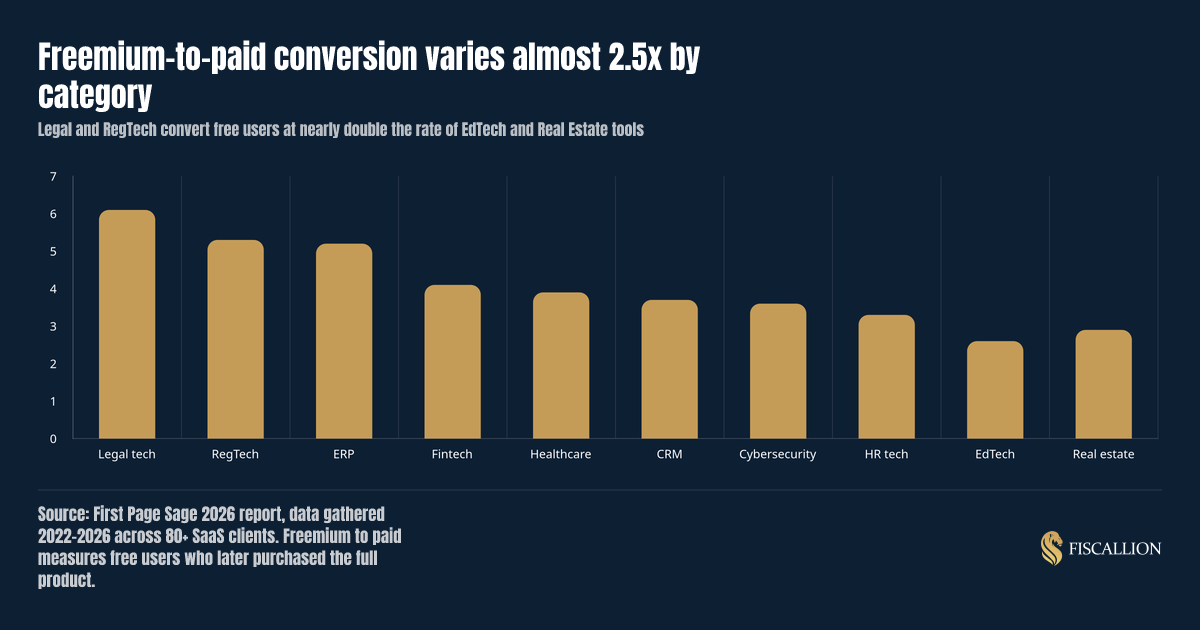
If you run a $5-50M ARR SaaS company with a self-serve freemium tier, the honest read is this: 3-5% is respectable, not embarrassing. If your board is anchored on an 8% number they read somewhere, that anchor is probably borrowed from a free-trial benchmark or a sales-assisted motion that does not match your product. Correct the anchor before you correct the number.
What to do next once you have a defensible rate
A number without a decision attached to it is trivia. Here is the sequence we walk clients through once the cohort tracking is in place.
- Segment before you optimize. Break the blended rate by acquisition channel first. A 3% blended rate might be 8% from organic search and 0.5% from a paid campaign dragging the average down. You do not have a conversion problem; you have a channel-mix problem, and the fix is reallocating spend, not rewriting the upgrade flow.
- Find the real ceiling: activation, not upgrade prompts. If activated users convert at 12% but only 35% of signups ever activate, your growth constraint is activation, not the paywall. Fix the first-session experience before you touch pricing.
- Model the free-user cost, not just the paid-user revenue. Every free user carries an infrastructure and support cost. Put a dollar figure on it (even a rough one) and set it against your blended CAC for paid conversions. If the free tier's carrying cost is climbing faster than paid conversions, that is a board-level trade-off, not a product tweak.
- Feed the rate into your runway model as a range, not a point estimate. Model your cash forecast at your current rate, a downside case 1-2 points lower, and an upside case 1-2 points higher. If your runway estimate swings by more than a quarter between those cases, your capital plan is more fragile than your deck suggests.
- Report the trend, not the snapshot. A single monthly number invites a single reaction. A six-month cohort trend line, shown alongside the channel mix that produced it, gives your board something to actually discuss: what to do next, not just what happened.
This is the same discipline we apply to CAC and LTV at Fiscallion: treat the metric as a cohort range with a clear denominator, tie it explicitly to a cash and headcount decision, and stop letting a single blended percentage stand in for a trade-off conversation.
Common mistakes and the better move
| Mistake | Why it misleads | Replace it with |
|---|---|---|
| Comparing your freemium rate to a free-trial benchmark | Free trials pre-qualify intent; freemium does not. The comparison always makes freemium look broken. | Benchmark against your model only: self-serve freemium against self-serve freemium data. |
| Reporting one blended monthly percentage | Hides channel mix, activation gaps, and cohort maturity in a single figure. | Report a segmented six-month cohort trend, broken out by channel and plan tier. |
| Tightening the paywall the moment the rate dips | Assumes the constraint is willingness to pay when it is usually activation or paid-population fit. | Check activation rate and channel mix first; touch the paywall last. |
| Switching denominators (all signups vs. activated users) without flagging it | Creates a false "improvement" that is really a definition change, and it will not survive board or diligence scrutiny. | Pick one denominator, document it, and hold it constant across reporting periods. |
| Treating the rate as a single hard number in the model | Overstates forecast precision and hides sensitivity in your runway math. | Model a range (downside, base, upside) and show how runway shifts across the range. |
| Optimizing the rate without pricing in the cost of serving free users | A "successful" freemium motion can still burn cash if free-tier infrastructure cost outpaces paid conversion revenue. | Track free-user carrying cost alongside conversion rate as a paired metric. |
The pattern across all six mistakes is the same one we see across cash flow visibility, runway forecasting, and CAC/LTV debates at $5-50M ARR companies: the underlying problem is rarely the metric itself. It is fragmented ownership of the definition, implicit assumptions nobody wrote down, and no forecasting cadence that turns the number into a decision. A fractional finance hire or a dashboard tool will show you the same 3.4%. What changes the outcome is whether someone is accountable for what that 3.4% should trigger next quarter.
A practical cohort tracker for your board deck
Use this structure the next time you present freemium performance. It replaces a single conversion percentage with a decision-ready view.
- Cohort table: signup month, total signups, activated users, paid conversions at 30/60/90/180 days.
- Channel breakout: same table, split by acquisition channel, so the board can see which channels are actually producing paying customers.
- Cost line: estimated monthly infrastructure and support cost per free user, next to blended CAC for the same period.
- Range-based runway impact: current cash runway estimate at base, downside, and upside conversion assumptions.
- The ask: one clear recommendation, for example reallocating acquisition spend toward the highest-converting channel or investing engineering time in activation rather than paywall experiments.
That structure turns a metrics update into a trade-off conversation, which is the whole point of board reporting. If your current reporting stops at slide 1 and never reaches the ask, that is the gap Fiscallion's FP&A engagements are built to close.
Conclusion
Freemium conversion rate is a useful number only when it is attached to a defined denominator, a defined window, and a decision. Compare your rate to your model, not to whichever benchmark post ranks highest. Treat the number as a cohort range that feeds directly into your cash and headcount forecasts, not a static badge for your board deck. And when the rate moves, check activation and channel mix before you touch the paywall.
If your team is debating a freemium number instead of using it, the issue usually is not the metric. It is the absence of a decision-grade FP&A model translating that number into cash, runway, and trade-offs your board can act on.
Audit your metrics definitions and forecasting model.