

Your revenue is growing, but cash feels tight. That tension is rarely a sign that the business is broken. More often, it means your cash conversion cycle is working against you - and nobody has put a number on how bad the lag actually is.
The cash conversion cycle (CCC) measures the number of days between when you spend money to operate the business and when customer payments arrive in your account. In SaaS, with monthly or net-30 invoicing and vendors on their own payment schedules, that gap can quietly drain working capital even when the P&L looks healthy.
Key takeaways
- The Two-Variable Formula: In SaaS, the Cash Conversion Cycle shrinks to just two variables—how fast you collect cash versus how slow you pay vendors.
- Negative CCC is the Goal: Annual upfront billing lets you fund day-to-day operations using your customers' cash rather than dipping into your own bank account.
- The Hidden Cash Trap: A cycle over 45 days isn’t a reporting glitch; it's a working capital problem that quietly ties up millions in capital as you scale.
- The Quickest Lever: You don't need to change your product or your sales process to unlock cash—adjusting your billing terms can claw back 10 to 20 days of runway in a single quarter.
What the cash conversion cycle actually measures
CCC is a working capital efficiency metric. It tells you how long cash is "out of the building" - spent on operations, vendor payments, and delivery costs - before it returns as collected customer revenue.
The standard formula for businesses with physical inventory is:
CCC = DIO + DSO - DPO
- DIO (Days Inventory Outstanding): Average days to sell inventory
- DSO (Days Sales Outstanding): Average days to collect payment after a sale
- DPO (Days Payable Outstanding): Average days before you pay your vendors and suppliers
For SaaS companies, DIO drops to zero. There is no physical inventory to manage. That simplifies the formula to:
SaaS CCC = DSO - DPO
This matters because it focuses attention on two variables you have real control over: how fast customers pay you, and how long you hold cash before paying vendors.
CCC is not the same as burn rate
Burn rate measures how fast you're spending cash. CCC measures how efficiently cash cycles through your operations. A company can have a controlled burn rate and still suffer from a 60-day CCC if it's collecting slowly and paying vendors quickly. For a clear breakdown of how burn rate and runway interact, see our startup runway calculation guide.
CCC is not the same as cash runway
Runway is how many months of operating expenses you have left. A longer CCC does not shorten your runway directly - but it does trap working capital that could be deployed elsewhere, and it makes runway estimates fragile when DSO unexpectedly lengthens. A cash flow forecast that doesn't account for collection timing is systematically optimistic - a point we cover in depth in our cash flow forecasting guide.
The formula broken down: DSO and DPO
Days sales outstanding (DSO)
DSO measures the average number of days from when you invoice a customer to when cash is in your account.
DSO = (Average accounts receivable / Total credit sales) × 365
For a monthly snapshot: DSO = (Ending AR balance / MRR) × 30
What DSO reveals:
- A DSO of 5–15 days suggests strong upfront or automated billing (annual contracts, credit card auto-pay)
- A DSO of 30–45 days is typical for net-30 invoicing with manual follow-up
- A DSO above 60 days usually points to a collections process problem, not just a slow-pay customer
According to a 2024 study by The Kaplan Group analyzing SEC filings across eight leading SaaS companies, the industry-wide average DSO has declined from 58.7 days in 2020 to 54 days in 2024 — but enterprise-focused vendors like Salesforce and Workday still run DSOs above 80 days, while standardized subscription businesses like Dropbox operate near 10 days. The spread is a billing model decision, not an industry norm.
Days payable outstanding (DPO)
DPO measures the average number of days between when you receive a vendor invoice and when you pay it.
DPO = (Average accounts payable / Cost of goods sold) × 365
For a monthly approximation: DPO = (Ending AP balance / Monthly COGS) × 30
What DPO reveals:
- A DPO of 30–45 days is standard for most SaaS vendors and infrastructure providers
- A DPO below 15 days means you're paying vendors faster than necessary, reducing your working capital buffer
- A DPO above 60 days may reflect cash flow strain - or intentional negotiation with strategic vendors
The CCC calculation in practice
If this company had $1M monthly revenue, that 10-day CCC implies roughly $330K of working capital tied up in the cycle at any point.
Now flip it: if DSO is 45 and DPO is 20, CCC = 25 days and the trapped capital rises to ~$830K on the same revenue base.
The math is not complicated. The problem is that most teams at the $5M–$50M ARR stage are not tracking DSO and DPO together with enough precision to see the trade-off.
CCC benchmarks by business model and billing structure
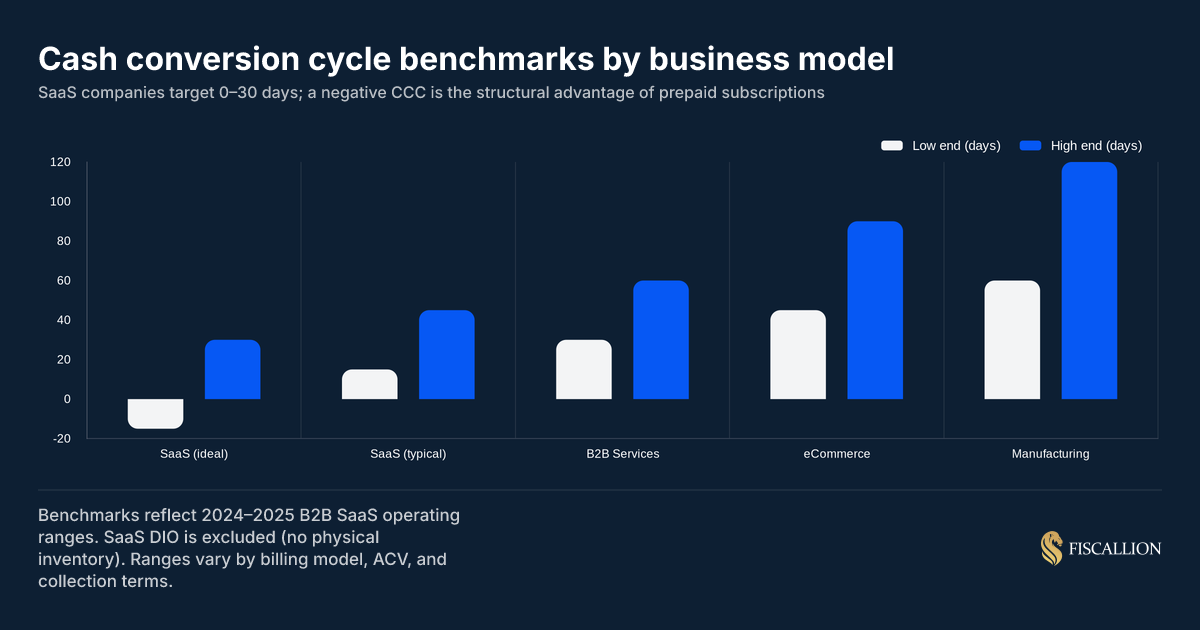
The chart above shows why SaaS has a structural CCC advantage over nearly every other business model. Without inventory, the only drag on the cycle is how long it takes to collect - and that is almost entirely a billing and collections decision.
J.P. Morgan's Working Capital Index found that 67% of S&P 1500 companies reported longer DSO in their most recent reporting period, with approximately $707 billion in trapped liquidity across the index — up 40% from pre-pandemic levels. SaaS companies that actively manage billing model and collections processes are outliers in a market where most businesses are moving in the wrong direction.
Here are working benchmarks for B2B SaaS by stage and billing model:
A CCC below 30 days is achievable and realistic for most SaaS companies. The benchmark you should push toward depends on your billing model and ACV, not on general industry averages.
A Series A SaaS company targeting under 30 days is in good shape. If you're approaching Series B or C and still sitting above 45 days, that is a working capital issue that will surface in due diligence.
How to calculate your CCC today
You do not need a complex model. You need three numbers from your balance sheet and income statement:
- Average AR balance - the midpoint of your beginning and ending AR for the period
- Revenue for the period - total invoiced/credit sales (not cash received)
- Average AP balance - midpoint of beginning and ending AP
- COGS for the period - infrastructure, hosting, customer success, and any direct delivery costs
Step 1: Calculate DSODSO = (Average AR / Period Revenue) × Days in period
Step 2: Calculate DPODPO = (Average AP / Period COGS) × Days in period
Step 3: Calculate CCCCCC = DSO - DPO
A 30-day snapshot (using a single month) is more useful for operational decisions than an annual calculation. Run it monthly and track the trend, not just the point-in-time number.
What inputs to watch
DSO vs. DPO: where SaaS cash actually gets trapped

The chart above shows how billing model choice drives DSO - and why moving customers toward annual upfront billing is the single highest-leverage CCC decision available to most SaaS companies.
Notice what happens at annual upfront billing: DSO drops to 3 days. Paired with a standard 30-day DPO, the CCC goes negative. You have collected cash before you need to pay vendors. That gap is what self-funded companies and capital-efficient operators use to fund growth without additional dilution or debt.
Volition Capital's analysis of payment terms across growth-stage SaaS companies found that a monthly billing model requires more than 2x the capital to reach profitability compared to an annual upfront model — under the same expense base and growth rate. At an 8x ARR exit multiple, the dilution difference between the two billing structures represents tens of millions of dollars in founder proceeds. CCC is not a treasury metric. It is an equity outcome.
Compare that to net-60 invoicing: a DSO of 55 days against a 30-day DPO gives you a CCC of 25 days. At $2M monthly revenue, that is ~$1.7M in cash permanently out of the building - capital that could otherwise sit on your balance sheet or fund the next hire.
Interpreting CCC movements: what changes in the number signal
A rising CCC is not always a sign of operational failure. Context matters.
A stable CCC during rapid growth is a signal that your billing infrastructure is working. A lengthening CCC during growth is the "growth penalty" - revenue accelerating faster than cash is collecting, which drains the bank account even as ARR climbs.
This is one of the most common cash flow surprises at the $10M–$30M ARR stage. The fix is not to slow growth. It is to restructure billing terms and collections before the gap becomes a fundraising constraint.
This hidden structural trap triggers exactly when everything else on your dashboard looks exceptional. When you start signing massive accounts, your top-line success can actually mask an aggressive drain on your liquid capital.
Our FP&A for startups guide covers how to build the rolling forecast infrastructure that catches this drift early — before it shows up as a cash shortfall in a board meeting.
What to do next: actions ranked by working capital impact
These are ordered by the speed and size of the CCC improvement, not by ease of implementation.
1. Audit your billing model mix (owner: CEO or Head of Finance)
Pull your MRR by billing frequency: monthly, quarterly, annual. Calculate the weighted average payment timing across the customer base. If more than 60% of your customers are on monthly billing, annual upsells will have a meaningful impact on DSO within two quarters.
Target: shift at least 25–30% of ARR to annual upfront billing over the next two contract cycles.
2. Set payment terms to net-30 by default, with net-15 as the ask (owner: Finance or RevOps)
If your default contracts go out at net-45 or net-60, you are ceding 15–30 days of DSO without a business reason. Most customers will accept net-30. Some will accept net-15, especially if you frame it as the standard and reserve exceptions for enterprise deals above a defined ACV threshold.
3. Automate invoice delivery and first payment reminder (owner: Finance or Billing Ops)
Manual invoice-to-collection processes add 5–10 days of DSO through administrative lag alone. Automated invoice delivery on the billing date, plus a day-3 reminder and a day-14 follow-up, captures the majority of DSO improvement available from process changes. This is the same logic behind building accounts receivable management processes that run without manual oversight.
4. Implement annual upfront discounting for new contracts (owner: AE or CEO)
A 10–15% discount for annual upfront payment is standard in B2B SaaS and immediately flips the CCC math. The revenue impact is visible on the P&L. The cash impact - collecting 12 months upfront - is invisible in ARR reporting but material on the balance sheet.
5. Review DPO by vendor category (owner: Finance or COO)
Identify vendors where you are paying on net-15 or net-30 when net-45 or net-60 is available by request. Cloud infrastructure providers, SaaS tools, and agency contracts frequently have flexible payment terms that are not enforced unless requested. Extending DPO from 20 to 40 days on $200K monthly COGS extends your cash buffer by ~$130K without changing a single customer interaction.
However, pushing your DPO boundary too far comes with steep operational risks. There is a sharp distinction between professional negotiation and simply letting bills sit past their due dates.
6. Separate deferred revenue tracking from AR (owner: Finance)
If your billing system does not cleanly separate deferred revenue (cash collected, not yet earned) from AR (earned but not yet collected), your CCC calculation will be wrong. This is especially common after a cash-to-accrual accounting transition. Fix the accounting first - then calculate the metric.
7. Track CCC monthly alongside DSO in your finance review (owner: Head of Finance or CEO)
CCC is not a one-time calculation. It is a leading indicator for working capital stress. Add it to your monthly close alongside DSO, DPO, and cash runway. A consistent 5-day drift upward in CCC signals a change in customer payment behavior or vendor terms that will show up as a cash shortfall before your next forecast cycle catches it. It belongs in the same operating cadence as your SaaS board reporting metrics.
Common mistakes and better replacements
The most common CCC errors at the $5M–$50M ARR stage are not about the math. They are about the inputs and the cadence.
AR management and CCC: the missing connection
DSO does not improve through awareness alone. It improves through collections process design - specifically, through what happens between invoice delivery and cash receipt.
The connection between AR management and CCC is direct: every day you reduce the 31–60 day aging bucket is a day of DSO eliminated. Most teams focus on the 90+ day bucket — but by the time an invoice is 90 days overdue, you're dealing with a credit risk or relationship problem that takes weeks to resolve. The 31–60 day bucket is still correctable with a single prompt follow-up and a payment link. The mechanics of building that process — aging bucket analysis, escalation workflows, failed payment recovery — are covered in depth in our accounts receivable management guide.
The typical AR aging bucket analysis at a $10M ARR SaaS company looks like this:
Reducing your 31–60 day bucket from 28% of AR to 18% of AR will typically cut DSO by 3–5 days. That is not immaterial. At $2M monthly revenue, 4 days of DSO reduction = ~$267K of working capital freed up, permanently, every month.
FAQ
What is a good CCC ratio?
There is no universal CCC ratio - the metric is measured in days, not as a ratio, and the appropriate target depends on your business model, ACV, and billing structure.
For SaaS companies, here is how to think about it:
- Negative CCC (below 0 days): Ideal. You collect before you pay. Achievable with annual upfront billing and standard 30-day vendor terms.
- 0–15 days: Strong. Typical for SaaS with quarterly billing or strong auto-pay adoption.
- 15–30 days: Acceptable. Most B2B SaaS companies on net-30 invoicing land here.
- 30–45 days: Watch closely. Collections or payment terms may need tightening.
- 45+ days: Investigate. Either DSO is elevated beyond your billing terms, or DPO is too low. Both are correctable.
"Good" for a Series A company with a mid-market focus looks different from "good" for a company selling into enterprise with net-60 standard terms. The right question is not "is my CCC below 30 days?" but "is my CCC consistent with my billing model, and is it trending in the right direction?"
Can a small business improve its CCC?
Yes - and often more quickly than larger businesses, because the changes required are operational, not structural. Most of the decisions that shorten CCC are already within the control of the founder or Head of Finance.
The highest-impact changes for a small or early-stage SaaS company:
- Switch from monthly to annual billing for new contracts. Most customers will accept this if the pricing reflects a fair annual discount (10–15%). The cash impact is immediate.
- Automate invoice delivery so billing goes out on the same day every period and reminders fire without manual follow-up.
- Set payment terms explicitly in every contract. Default to net-30. Do not inherit net-60 simply because a customer asked for it informally.
- Stop paying vendors early. If your cloud and SaaS vendors bill net-30, pay on day 28, not day 3.
A company at $2M ARR can realistically improve CCC by 15–20 days within one to two quarters by addressing billing terms and invoice automation alone. The changes do not require hiring, a new tool, or board approval - they require a policy and a process.
Is a negative CCC good?
For SaaS, a negative CCC is generally a strong signal. It means you are collecting customer cash before you need to pay vendors, which effectively lets customers fund your operating costs rather than your own cash reserves.
This is not hypothetical. Companies with annual upfront billing structures and 30-day vendor payment terms routinely run negative CCCs. Stripe, as a payment infrastructure example, operates with a negative CCC because it holds float. Many high-growth SaaS companies achieve negative CCC through billing model design, not through operational complexity.
The caution: a negative CCC achieved by stretching vendor payments aggressively - pushing DPO from 30 to 90+ days - can strain supplier relationships and is unsustainable if it exceeds standard vendor terms. The right path to a negative CCC is shorter DSO, not inflated DPO.
A negative CCC also does not mean unlimited cash. If annual contracts are being collected upfront but churn is high, that deferred revenue liability grows. Cash looks healthy; the liability side of the balance sheet tells a different story. Model the two together.
What is a good cash conversion cycle for a SaaS startup?
The target range changes by stage:
For companies raising their next round, a CCC above 45 days will surface in financial due diligence and may raise questions about collections quality, billing model maturity, or accounts receivable health. You do not need to be perfect, but you do need to show the trend is improving and that you know why it is at its current level.
A practical CCC tracking template
Add these to your monthly finance close process alongside your standard P&L and balance sheet review:
Monthly CCC dashboard inputs
─────────────────────────────────────
Period: [Month / Year] AR (end of period): $______
Revenue (invoiced, accrual): $______
DSO = (AR / Revenue) × 30: __ days AP (end of period): $______
COGS (period): $______
DPO = (AP / COGS) × 30: __ days CCC = DSO - DPO: __ days
Prior month CCC: __ days
Change: __ days (↑ / ↓) ─────────────────────────────────────
Decision thresholds: CCC > 30 days → Review DSO trend CCC > 45 days → Investigate AR aging DSO up 7+ days MoM → Check billing cycle + collections lag DPO down 5+ days → Review vendor payment policy
Run this each close cycle. Assign a single owner to the DSO line and a separate owner to the DPO line. When the number drifts, the owner surfaces the explanation - not just the number.
This is the same discipline Fiscallion applies when building a working capital review into a client's monthly FP&A cadence. The goal is not a dashboard. It is a decision: cash is healthy or cash is being trapped - and here is which lever to pull.
Managing cash cycles to protect founder equity
The cash conversion cycle is one of the clearest indicators of working capital health available to a SaaS company. It is also one of the most underused - not because it is complicated, but because most teams track DSO in isolation, ignore DPO, and never connect the two to a cash flow decision.
For a $5M–$50M ARR company, improving CCC from 40 days to 20 days is not a theoretical exercise. It is the difference between $1.3M and $660K of working capital tied up in the cycle each month (at $2M monthly revenue). That gap is either on your balance sheet or it is being funded by your equity.
The decisions that close that gap - billing model mix, payment terms, invoice automation, vendor DPO - are all operational. They do not require a new finance hire, a tool purchase, or board approval. They require someone to own the inputs, track the number monthly, and pull the lever when it drifts.
If your CCC is above 30 days and you do not know exactly why, that is the analysis to run first.
Want a clean working capital model that tracks CCC, DSO, and DPO alongside your runway and headcount plan? Reach out to Fiscallion for a working session.
