
Your revenue recognition and your cash position are not the same number. The gap between them is your accounts receivable balance - and at $5M to $50M ARR, that gap is large enough to distort runway estimates, miscalibrate hiring decisions, and quietly undermine the confidence your board has in your financial model.
Most scaling SaaS companies treat accounts receivable (AR) as an accounting backroom function. They watch MRR, track churn, and report ARR growth - but the collection cycle sits in a spreadsheet somewhere, reviewed monthly if someone remembers. The result is cash that looks plentiful on paper while actual working capital is trapped in invoices that have not been paid.
By the end of this article, you will know how to calculate and interpret Days Sales Outstanding (DSO), build a collection process that reduces the cash-to-bank cycle, and set the ownership structure that prevents AR from becoming a silent drain on runway.
Key takeaways
- DSO is the most direct indicator of how efficiently your company converts recognized revenue into collected cash. A 15-day improvement at $10M ARR frees roughly $417K in working capital.
- AR management is not a back-office task. The collection cycle directly impacts runway forecasting. If your cash model doesn't account for aged receivables, it's unreliable.
- The gap between a 30-day and 60-day collection cycle is measurable in months of runway. At a $150K monthly burn, it can be the difference between closing a fundraise and not.
- Invoice accuracy, payment terms structure, and dunning automation - not headcount - drive the biggest improvements in collection speed.
AR management is a cash flow problem, not an accounting one
Revenue recognition tells you when you've earned the money. Accounts receivable tells you when you'll actually have it.
For SaaS companies with annual contracts, net-30 invoiced accounts, or a mix of enterprise customers on custom payment terms, the distance between "earned" and "collected" compounds quickly. A company closing $200K in new ARR this month may not see that cash for 45 days - meanwhile burn continues at its current rate.
The reason most founders underestimate this problem is that SaaS financial reporting prioritizes ARR and MRR. Those are leading indicators of business quality. But they don't tell you about the $300K sitting in 60+ day invoices, the failed credit card retries that haven't been chased, or the enterprise customer on net-60 terms who regularly pays at day 75.
That gap is a working capital problem. And it's solvable without adding headcount, changing your product, or signing new customers.
The direct connection to runway
Runway is calculated from cash in the bank divided by monthly burn. What that calculation doesn't automatically account for is how much of your "cash" is actually locked in unpaid invoices.
A $10M ARR company with a $500K monthly burn and a 45-day DSO has roughly $1.25M trapped in receivables at any given time. That's 2.5 months of burn sitting outside the bank. Your runway model says 14 months. The true cash position - accounting for aged receivables - might be closer to 11.5 months if collections degrade and write-offs occur.
This is not a hypothetical concern. It's the kind of number that changes a board conversation.
Days sales outstanding: the right metric to track
DSO measures the average number of days between invoicing a customer and collecting cash. It is the most direct indicator of accounts receivable health.
Formula: DSO = (Accounts Receivable Balance / Total Credit Sales in Period) × Number of Days in Period
For a monthly calculation, use 30 days. For quarterly, use 90.
Example: AR balance of $500K, monthly invoiced revenue of $833K (at $10M ARR), 30-day period.
DSO = ($500K / $833K) × 30 = 18 days
That's a strong result. A DSO of 45 would look like this: AR balance of $1.25M against the same revenue base. The $750K difference is real working capital trapped in the collection cycle.
A useful benchmark: divide your actual DSO by your average payment terms. According to CreditPulse's 2025 DSO analysis, a ratio of 1.0–1.15 is excellent; above 1.50 is a cash flow problem that compounds over time. A company with 60-day DSO and Net 30 terms is running a $1M+ working capital gap for every $6M in annual revenue.
DSO benchmarks by SaaS company type
Track DSO monthly alongside burn rate. If it's rising quarter over quarter, you have a collections problem - and the later you catch it, the more expensive it becomes to correct.

For broader context on where enterprise software sits: a 2024 study by The Kaplan Group tracking eight major SaaS companies found that the industry-wide average DSO fell from 58.70 days in 2020 to 54.03 days in 2024 — driven largely by operational efficiency improvements, not better customer payment behavior. Enterprise-focused companies like Salesforce (132.9 days) and Workday (82.4 days) skew those averages heavily. If you sell primarily to SMB or mid-market, your peer group looks very different.
The right benchmark depends on your customer mix. A company selling exclusively to enterprise on net-30 terms will never achieve a 15-day DSO - and shouldn't be measured against one. What matters is whether your DSO is trending toward or away from the top quartile for your segment, and whether the trend has a known cause.
Segment your DSO by customer tier
A single blended DSO number hides where the problem lives.
Segment into at least three cohorts: SMB (typically card-billed), mid-market (invoiced, net-15 or net-30), and enterprise (invoiced, net-30 to net-60). If your blended DSO is 48 days and your enterprise DSO is 42 days while your mid-market DSO is 64 days, the problem is in the mid-market tier - not in your enterprise collection process. That's a different fix.
Aging buckets translate directly into runway risk
The aging report breaks your AR balance into time bands: current (0-30 days), 31-60 days, 61-90 days, and 90+ days. Each band has a different expected collection probability and a different cost to your runway model.
The 90+ days bucket is where write-offs live. Bad debt as a percentage of ARR should stay under 1%. If it's running above that, the problem is either in your customer qualification process or in your collection response time - and both have downstream effects on unit economics calculations.
Watch the 31-60 bucket more closely than the 90+ bucket. By the time an invoice hits 90 days, most of the damage is done. The 31-60 bucket is where aggressive action still produces full recovery at minimal cost.
Contact timing also matters more than most teams realize. CreditPulse's analysis of B2B collections data found that first contact within 48 hours of a missed payment achieves a 65% collection success rate. Wait 14 days and that rate drops to 15%.
How much cash is actually trapped in your AR balance?
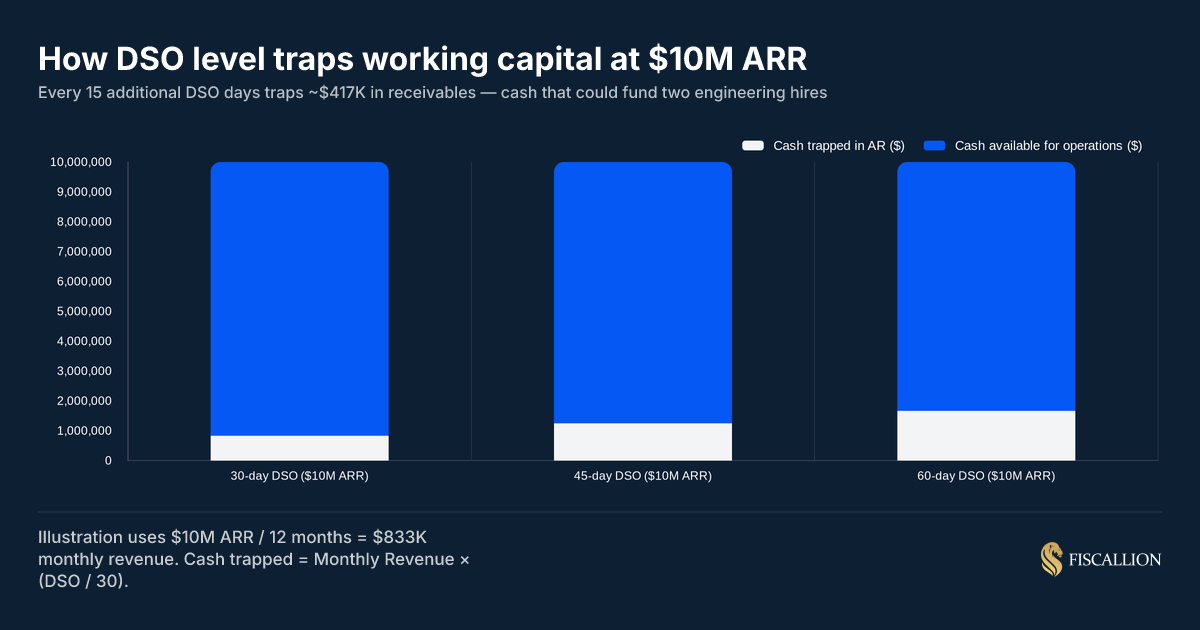
At $10M ARR, the difference between a 30-day and 60-day DSO is roughly $833K in trapped working capital. At a $200K monthly burn, that's four additional months of runway that exists in theory but not in practice.
This is why AR management integrates directly into your runway forecast. If you're building a cash model for a board meeting or fundraise and you're not adjusting for aged receivables and expected collection timing, your model overstates true available runway. The kind of misalignment between your cash position and your recognized revenue that creates silent runway risk is exactly what the cash-to-accrual transition is designed to make visible - and why getting the accounting right is a prerequisite for cash flow forecasting you can act on.
The collection process cadence that produces results
The companies with the strongest collection rates don't have more people chasing invoices. They have a documented, consistently enforced process that runs whether or not anyone is actively monitoring it.
Zuora's research on DSO reduction notes that automated reminder cadences aren't just more efficient — they fundamentally change outcomes. Standardized workflows that cover pre-due, due-date, and post-due stages consistently outperform ad-hoc follow-up.
Here's the cadence that works for invoiced B2B accounts:
Before the due date:
- Day -7 (7 days before due): Proactive reminder with invoice attached. Confirm receipt and flag any outstanding PO requirements for enterprise accounts.
- Day -1: Final reminder that payment is due tomorrow. Include all payment method options.
On and after the due date:
- Day 0: Payment due. Confirm receipt or send firm notice that payment has not been received.
- Day +5: Direct follow-up to the customer's AP contact - not a general email - confirming the invoice is in their queue and requesting an ETA.
- Day +15: Escalated notice. Payment is 15 days overdue. Explicitly state that service suspension will occur at day 30 if not resolved.
- Day +25: Final warning before service suspension. Call the customer's primary contact directly.
- Day +30: Suspend service and send notice. Do not continue providing service on invoices 30+ days past due without explicit escalation approval.
- Day +45: Formal demand or third-party collections escalation.
The credibility of this process depends entirely on whether you follow through. Customers who learn that service suspension threats aren't enforced will test them repeatedly.
Dunning for card-billed accounts follows different mechanics
For SaaS with automated card billing, the collection challenge is passive churn from failed payments - not overdue invoices. Cards fail at 5-15% of monthly charge attempts across the customer base.
A structured dunning process recovers 50-70% of failed payments that would otherwise churn.
Standard financial records that appear visually perfect from a general business perspective frequently conceal major structural misalignments under specialized metrics evaluation. Failing to view background credit failures as an active churn risk can cause steady ARR erosion without leadership realizing the root cause.
The sequence:
- Day 0: Immediate retry on card failure. Catches temporary fraud blocks and daily limit resets.
- Day 1: Email with direct payment update link. Clear, non-accusatory language.
- Day 3: Second retry attempt. Most short-term holds resolve within 72 hours.
- Day 7: Second email with more direct language about service continuity.
- Day 10: Final retry and final notice.
- Day 14: Cancel or suspend subscription.
At $10M ARR with a 5% monthly failure rate, that's $50K in potential involuntary churn each month. A 60% recovery rate keeps $30K of that in-house. Over a year, that's $360K - comparable to a meaningful revenue initiative at a fraction of the cost and complexity.
Payment terms decisions that improve working capital
The fastest way to reduce DSO is not to collect faster - it's to structure payment terms so that cash arrives sooner by default.
Annual prepay is the most impactful lever
Customers who pay annually in advance don't have an AR problem because the cash arrives before service is delivered. The trade-off is a discount that reduces recognized revenue per customer. The question is whether the working capital benefit justifies the discount.
At $10M ARR with 50% annual contracts, shifting to 70% annual at a 10% discount costs roughly $100K in annual revenue. But it frees $500K-$700K in working capital that was previously sitting in receivables. If your cost of capital is above 15% or your runway is under 18 months, that trade-off almost always favors the shift to annual prepay. According to CreditPulse's 2025 benchmarks, annual prepayments cut DSO by 40-60% for companies that can successfully push for them.
A note on how this connects to your balance sheet: when cash comes in before service is delivered, it sits as deferred revenue until recognized. The accounting is correct, but the cash is real and available. Understand this distinction before modeling the cash flow impact of an annual-prepay push.
Net-15 as the default instead of net-30
For invoiced mid-market accounts, present net-15 as your standard term rather than net-30. Many customers will accept shorter terms without negotiation if that's what's on the invoice. The compounding effect across your AR book is meaningful.
Note that Net 30 is the most common B2B payment term — used by roughly 60% of B2B companies — which means switching to Net 15 as your stated default often goes uncontested simply because customers expect their vendors to negotiate.
The table below shows how payment terms structure affects working capital at different ARR levels:
Early payment discounts: calculate the cost before offering them
A 2% discount for payment in 10 days (2/10 net-30) sounds small. On $10M ARR it costs $200K annually. If it reduces DSO from 35 to 15 days, it frees roughly $550K in working capital. If your runway is tight or your cost of capital is above 10%, that math works. If you have 20+ months of runway and healthy cash, keep the $200K and accept the slower collection.
The decision depends on your specific capital position - not on a general preference for either option. It's worth noting that approximately 30-45% of B2B customers actually use early payment discounts when offered, and DSO typically drops 8-15 days as a result — at a net cost of 1.5-2.5% of revenue. In many cases, that's cheaper than a line of credit.
The FP&A model needs to reflect AR reality
A cash flow model that doesn't account for collection timing is wrong. Not approximately right - directionally wrong in ways that affect hiring decisions, runway projections, and fundraising timing.
The fix is adding a collections timing layer to your cash model. Instead of assuming all revenue converts to cash in the month it's recognized, apply a collection timing schedule based on your actual DSO by customer segment.
The basic structure:
Run this model against your actual AR aging report quarterly. If your modeled collection timing is 30 days and your actual DSO is 48 days, you need to update the assumption - not ignore the discrepancy.
This is the same principle that applies to deferred revenue modeling: cash, recognized revenue, and billings need to connect explicitly in your model, or runway forecasting stays fragile. Boards and investors can tell when the cash flow bridge doesn't reconcile with the income statement - and they'll ask the question at the least convenient moment. The three-statement model is the architecture that makes these connections explicit — income statement, balance sheet, and cash flow reconciling together in a single model, where AR aging flows through as a working capital assumption rather than a footnote.
Ownership structure: who owns AR decisions
AR management fails most often not because of missing tools but because of unclear ownership. The invoice goes out, no one is accountable for whether it gets paid, and the balance ages without escalation.
Define these ownership boundaries explicitly:
The most common failure point is requiring CEO or founder approval for service suspension. That creates a bottleneck that signals to customers that suspension isn't real - and it trains late payers to delay until they reach a person who will negotiate.
Set a policy and let finance execute it. Reserve escalation to leadership for strategic accounts above a defined revenue threshold only.
Leaving the accounts receivable function isolated from customer-facing teams allows payment delays to quietly compound without anyone stepping in to address them. Establishing a clear internal process for visibility ensures that aging invoices are flagged and resolved before they severely damage cash runway.
Common AR mistakes and the replacement moves
These are the six AR patterns that quietly erode working capital and runway before they show up on the income statement.
Mistake 1: tracking AR in aggregate without an aging report
If you only see a total AR balance, you can't act on it. The $400K AR balance that's all current is not the same risk as the $400K balance that's 40% over 60 days. Pull an aging report monthly without exception. A healthy AR aging distribution should have 80%+ of your balance current (0-30 days), under 12% at 31-60 days, under 5% at 61-90 days, and under 3% at 90+ days.
Replace with: Aging report reviewed in every monthly close - segmented by customer tier.
Mistake 2: treating payment terms as fixed after contract signature
Payment terms are negotiated at contract signing, but they don't have to stay fixed at renewal. A customer who accepted net-30 at their first contract often has no strong objection to net-15 at renewal if it's presented as the new standard.
Replace with: Payment terms audit at every renewal. Default renewal terms should be net-15 unless the customer has a documented business reason for net-30+.
Mistake 3: crediting the deal when the contract is signed, not when cash is collected
Sales commission and deal credit structures that reward signature, not payment, create misaligned incentives. Account managers have less urgency around customer payment issues when their comp is already secured.
Replace with: Commission paid (or at least partially held) until initial payment is confirmed. This single change produces faster first-payment collection without any process overhead.
Mistake 4: using revenue recognition timing as the proxy for cash receipts
MRR recognized in March is not the same as cash collected in March. This is a specific instance of the broader error of using recognized revenue instead of received cash when calculating runway — one of the most common and most expensive mistakes in SaaS financial modeling.
Replace with: A collections timing schedule layered over your revenue model. Update DSO assumptions quarterly from actual AR aging data.
Mistake 5: letting write-off decisions wait for the annual audit
Bad debt that sits at 90+ days for 6 months is not a collection problem anymore - it's a write-off that's inflating your stated AR balance and understating your actual operating expense. Review the 90+ bucket monthly. Write off what you've decided won't be collected.
Replace with: Monthly 90+ day review with a clear decision gate: is this collectible within 30 days? If no, initiate write-off process.
Mistake 6: no PO process for enterprise accounts
Enterprise customers' accounts payable teams won't process invoices without a purchase order number. If you don't capture the PO at contract signing, you add 2-4 weeks of delay while AP and your finance team chase the documentation. Invoice errors compound this further — disputes triggered by incorrect or incomplete invoices restart the payment clock entirely, and every day an invoice is disputed is a day DSO climbs.
Replace with: PO number captured as a required field in contract execution. Sales team owns this step - not finance.
AR health dashboard: what to track and review
Most AR problems are invisible until they're expensive — the aging report isn't being pulled, the collection cadence isn't being followed, or the cash model is ignoring DSO entirely. Use this dashboard as the backbone of your monthly AR review. Each metric maps to a decision, not just a status.
Review these numbers in the same monthly meeting where you review ARR and burn rate. A company with strong ARR growth and deteriorating collection metrics is building a cash problem that the income statement won't show for 60-90 days - but the AR aging report will show today.
The AR reporting template to share with your board
When reporting AR to the board, include:
- Total AR balance with aging breakdown (current / 31-60 / 61-90 / 90+)
- Blended DSO and trend (3-month moving average)
- Bad debt written off in the period
- Expected collections in the next 30 days based on current aging
- Cash collections as a percentage of recognized revenue for the period
This gives your board a real-time view of revenue quality - not just the ARR number that hasn't yet become cash. It also pre-empts the question investors always ask in a fundraise diligence process: "How quickly does your revenue actually convert to collected cash?"
AR management is a cash flow function, not a collections task
Accounts receivable management is not a collections task. It is a cash flow function that directly determines whether your runway model is reliable or misleading.
At $5M to $50M ARR, the structural gap between recognized revenue and collected cash is large enough to cost you runway months you can't afford to lose. DSO segmented by customer tier, an aging report reviewed monthly, a collection cadence that actually escalates, and payment terms structured to favor your cash position - these are the mechanics that close the gap.
The companies that manage AR well don't have bigger finance teams. They have clearer ownership, documented processes, and a model that connects cash timing to the income statement. At Fiscallion, that integration is core to every FP&A engagement - because a cash model that ignores collection timing is not a model you can build decisions on.
Audit your current AR aging, your collection cadence, and whether your cash model accounts for DSO assumptions. If any of those three are missing or stale, start there before the next board meeting.
Fiscallion works with Series A to Series C SaaS companies to build decision-grade FP&A models that connect ARR, cash flow, and runway into a single coherent framework. Audit your metrics definitions and forecasting model.
