

Your NRR looks fine. A 108% number sits in your board deck, and the last investor call went smoothly. But your sales team is working harder than last year to hold flat revenue, your CAC payback is creeping up, and you have a gnawing feeling that something in the base is leaking. That feeling has a name: low gross revenue retention.
GRR is the metric that NRR flatters and founders underweight. It strips out every upsell, every seat expansion, every price increase, and asks a blunt question: how much of your recurring revenue survived the period on its own merit? The answer tells you whether your business has a durable foundation or whether the expansion motion is doing double duty - covering real churn that nobody wants to talk about directly.
This article covers the precise GRR formula, how to calculate it from your billing data, what the 2025 benchmarks look like segmented by ACV and ARR stage, how to interpret the GRR-NRR gap, and the specific operational moves that improve the number.
Key takeaways
- GRR measures only revenue lost to churn and downgrades - it cannot exceed 100% and cannot hide churn behind expansion. That is what makes it the more honest signal of the two.
- A GRR-NRR gap wider than 20 percentage points is a structural warning. It means your expansion motion is doing churn-repair work instead of growth work.
- Benchmarks vary significantly by ACV band. An 88% GRR that looks weak for a $75K ACV product is actually above median for a $5K ACV SMB product.
- The compounding effect of a 5-percentage-point GRR difference becomes a multi-million-dollar gap within three years - even before new logo growth is modeled.
- GRR is what investors calculate independently during due diligence. Knowing the number before they do - and understanding which segment is pulling it down - is the difference between a credible data room and a difficult conversation.
What GRR actually measures (and what it cannot tell you)
Gross revenue retention measures the percentage of starting-period recurring revenue that survived to the end of the period, counting only losses. Churn reduces it. Downgrades and contractions reduce it. Nothing else does.
It cannot exceed 100%. A GRR of 100% means zero revenue was lost to churn or contraction from your existing cohort. In practice, that number exists only in theoretical SaaS models.
The metric uses a fixed cohort. You take the set of customers who existed at period start, track only what happened to their revenue over the period, and exclude any expansion from those same customers. New logos do not enter the calculation at all.
GRR answers one question: of every dollar of recurring revenue you had at period start, how many cents remained at period end, before anyone upgraded or bought more?
That question matters because the answer is immune to a specific manipulation that NRR is not. A SaaS business with aggressive upsell motions, strong account management, and expanding enterprise accounts can post 115% NRR while quietly losing 20% of its smaller accounts every year. GRR exposes that pattern directly; NRR absorbs it. Bessemer Venture Partners describes this dynamic well in their churn analysis framework: at a $500M ARR company running 20% churn, the first $100M of new bookings goes entirely to filling the leaky bucket before any net growth registers.
What GRR does not tell you: which segment is driving losses, what the churn reason distribution looks like, or whether losses are concentrated in a few large accounts or distributed across many small ones. For that, you need GRR segmented by cohort and customer tier - covered in the interpretation section below.
How to calculate gross revenue retention
The formula
GRR = (Starting MRR - Churned MRR - Contraction MRR) / Starting MRR × 100
Three inputs, all pulled from your billing system - not your CRM. The billing system and CRM will disagree on these numbers. The billing system is correct.
| Input | Definition | Where to pull it |
|---|---|---|
| Starting MRR | Total MRR from the cohort at period start | Billing system - Jan 1 snapshot |
| Churned MRR | Revenue from customers who fully canceled | Billing system - cancellation events |
| Contraction MRR | Revenue lost from downgrades, seat reductions, or plan decreases | Billing system - subscription change events |
| Expansion MRR | Upsells, seat adds, upgrades | Excluded from GRR - do not include |
Worked example
A $15M ARR SaaS company starts Q1 with $1.25M in MRR from its existing customer base.
During the quarter:
- 6 customers cancel: $62,000 churned MRR
- 9 customers downgrade plans or reduce seats: $28,000 contraction MRR
- 14 customers expand: $95,000 expansion MRR (excluded from GRR)
GRR = ($1,250,000 - $62,000 - $28,000) / $1,250,000 × 100 = 92%
The same company's NRR = ($1,250,000 + $95,000 - $62,000 - $28,000) / $1,250,000 × 100 = 100.4%
The NRR looks like a flat, stable business. The GRR tells you 8% of recurring revenue was destroyed by churn and contraction - and that the expansion team is running just fast enough to make it look acceptable.
For the full mechanics of the NRR side of this equation, see how net revenue retention benchmarks translate at each ARR stage - the GRR floor is what makes NRR meaningful or misleading.
Monthly vs. annual GRR
Most investors and board reporting use annual GRR - measure the cohort in month 1, check it 12 months later. Annual GRR smooths seasonality and matches how annual contracts are structured.
Monthly GRR is useful for operating cadence - you'll catch churn signals faster. But monthly GRR shows more volatility and should not be used directly for benchmark comparisons, which are almost always stated on an annual basis.
To convert monthly revenue churn rate to annual:
Annual revenue churn rate = 1 - (1 - monthly churn rate)^12
A 1% monthly revenue churn rate compounds to roughly 11.4% annual churn - an annual GRR of approximately 88.6%. A 1.5% monthly rate compounds to 16.5% annual churn. That compounding is why early monthly churn improvements have disproportionate annual impact.
Four calculation errors that corrupt the number
Including new logos in the cohort. GRR is a cohort metric. A customer who signed in February does not belong in the January cohort's GRR calculation. Mixing them in inflates the denominator and understates the real loss rate.
Using CRM contract values instead of billing data. CRM records what was sold. Billing records what was charged and what was actually active. For monthly subscribers, mid-month downgrades, and customers on custom invoicing, the gap can be material. Stripe's documentation on GRR vs NRR highlights this distinction clearly: revenue from upsells and expansions must be fully excluded from the GRR numerator, and pulling that data from CRM - rather than actual billing events - is where most calculation errors originate.
Treating reactivations as retention. A churned customer who returns in the same period is not retained - they churned and then returned. Count the churn event in the original period's GRR. The reactivation is a new logo event for that cohort.
Annualizing a partial-year number incorrectly. If you calculate GRR over six months and multiply the loss rate by two to annualize, you are understating churn because of compounding. Use the formula above.
GRR benchmarks by ACV band and ARR stage
The most common benchmark mistake is applying a single GRR threshold across the entire business. GRR is tightly correlated to average contract value. A $5K ACV SMB product and a $75K ACV mid-market product should not be held to the same standard.
2025 benchmarks by ACV band
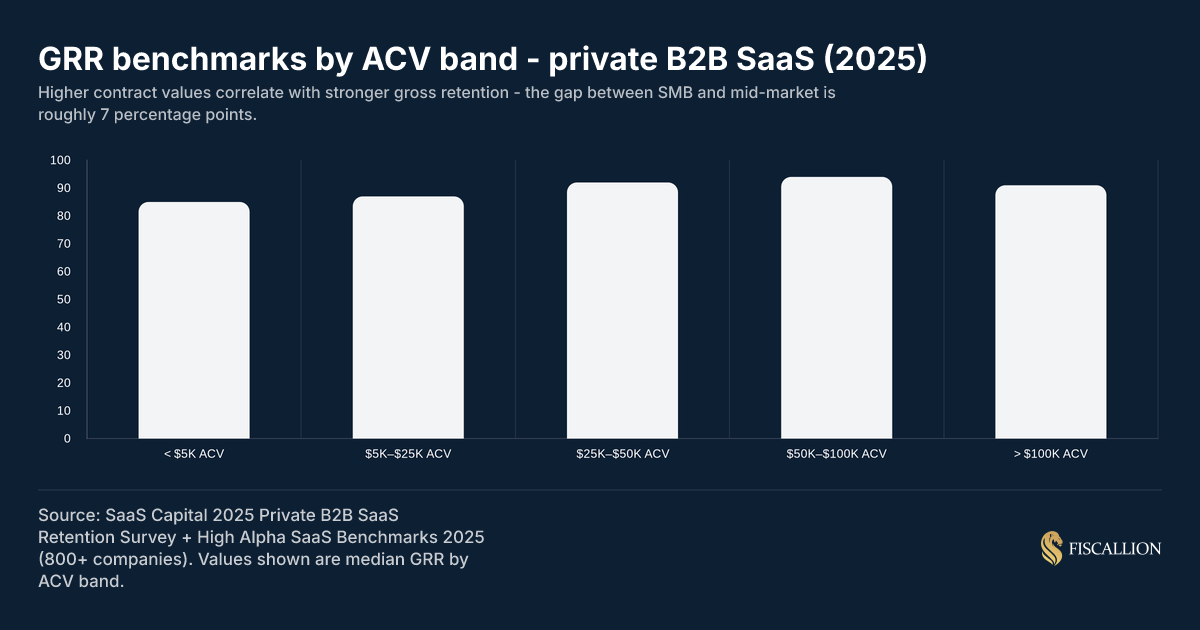
| ACV band | Median GRR | Top quartile GRR | Concerning threshold |
|---|---|---|---|
| < $5K | 83% | 88% | < 75% |
| $5K - $25K | 87% | 92% | < 80% |
| $25K - $50K | 92% | 96% | < 85% |
| $50K - $100K | 94% | 97% | < 88% |
| > $100K | 91-92% | 95%+ | < 85% |
Source: SaaS Capital 2025 Private B2B SaaS Retention Survey and High Alpha SaaS Benchmarks 2025.
The slight dip at the highest ACV band reflects concentration risk. Losing one $500K ARR enterprise account creates a visible GRR impact that the same company with 200 smaller accounts would absorb more smoothly. Enterprise GRR is volatile by nature - the floor should be higher, but the variance is also higher.
SaaS Capital's research is explicit on why ACV is the right lens: higher-priced solutions typically involve a longer sales cycle, more thorough implementation, and dedicated account management - all of which produce meaningfully stickier retention. The ACV-GRR relationship is more predictive than ARR stage, company age, or vertical.
2025 benchmarks by ARR stage
| ARR stage | Median GRR | Commentary |
|---|---|---|
| < $5M ARR | 83-86% | Early product-market fit issues common; expect high variance |
| $5M - $20M ARR | 87-90% | Scaling cohorts; churn patterns start to stabilize |
| $20M - $50M ARR | 90-93% | Customer success function maturing; enterprise mix increasing |
| > $50M ARR | 92-95% | Higher enterprise mix, longer contracts, stronger CS infrastructure |
The relationship between ARR and GRR is partly a maturity effect (more mature CS programs) and partly a mix effect (larger companies tend to have higher-ACV contracts, which retain better). The 2025 B2B SaaS Benchmarks Report from Benchmarkit - based on over 500 companies - shows median NRR at 101%, with expansion ARR now representing 40% of total new ARR. That expansion dependency makes GRR health even more consequential: if the base leaks, expansion is covering churn rather than generating growth.
What these benchmarks look like from SaaS Capital's research
SaaS Capital's annual survey consistently shows the ACV-GRR relationship holds across years and economic cycles. The 2025 data reinforces that the relationship between ACV and GRR is more predictive than ARR stage, company age, or vertical.
How to interpret your GRR number
The GRR-NRR gap is the most important signal
The difference between NRR and GRR tells you how much expansion revenue your business requires just to stay flat on the existing base. It is not a growth number - it is a churn-repair number.
GRR-NRR gap interpretation:
| Gap size | What it signals | Action |
|---|---|---|
| < 10 points | Healthy. Expansion is growth, not repair. | Maintain; optimize expansion for growth |
| 10-20 points | Moderate. Monitor by segment. | Segment the GRR; find which cohort is pulling it down |
| 20-30 points | Elevated risk. Expansion is primarily covering churn. | Churn root-cause analysis; customer success investment |
| > 30 points | Structural fragility. Business model sustainability question. | Board-level conversation; product-market fit review |
An NRR of 115% with a GRR of 82% means you need 33 percentage points of expansion just to reach positive retention. That is not a land-and-expand motion - that is a treadmill. When expansion slows (and it does), the NRR converges toward GRR, and the growth story unwinds quickly.
The compounding cost of low GRR
The chart below shows why a 10-point GRR difference compounds into a material revenue problem within a few years - even before modeling new logo acquisition.
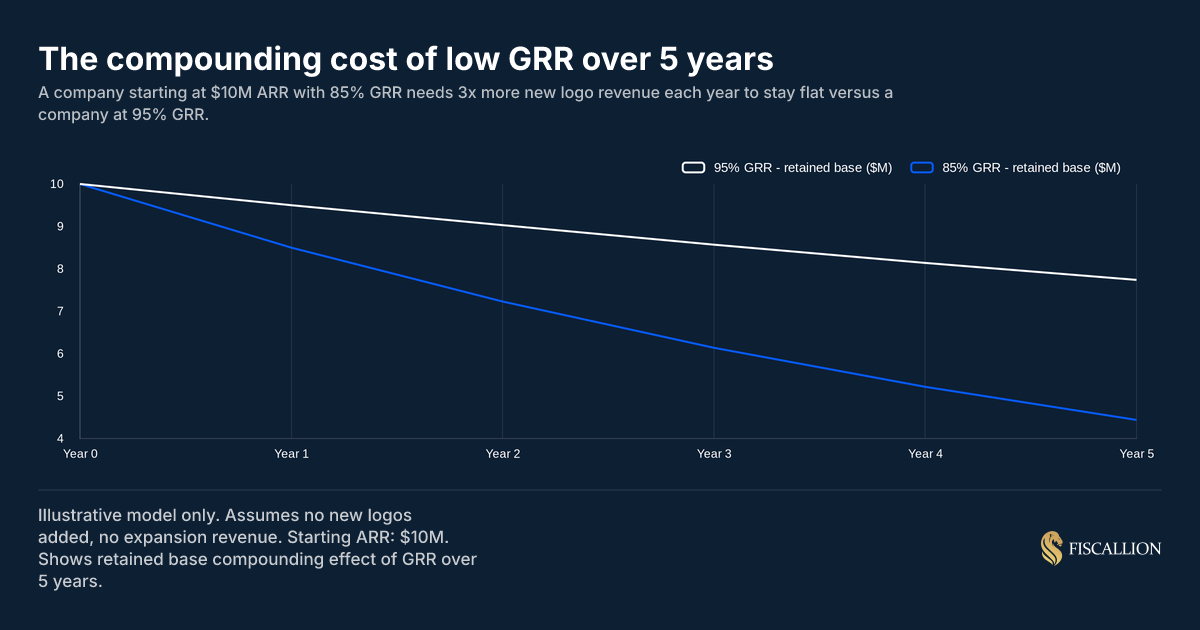
Starting from $10M ARR:
- 95% GRR: Retained base reaches $7.74M after 5 years (needs $2.26M in new logos just to stay flat)
- 85% GRR: Retained base reaches $4.44M after 5 years (needs $5.56M in new logos just to stay flat)
The company with 85% GRR is running a fundamentally different sales capacity requirement to post the same growth rate as the company at 95% GRR. That difference shows up in CAC payback, burn multiple, and headcount requirements - not just a line item in the board deck.
Segment GRR before you act on the aggregate
A company-level GRR of 89% can mean several different things:
- Enterprise at 96%, SMB at 78% - product is great for enterprise, wrong fit for SMB
- All segments at 89% - broad retention problem, likely product or onboarding
- Mid-market at 82%, everything else at 93% - specific segment misalignment, possibly a GTM or pricing issue
- Q1 cohorts at 94%, Q3 cohorts at 81% - onboarding process change or seasonal demand mismatch
The aggregate number tells you there is a problem. The segmented view tells you where. Never act on aggregate GRR alone.
What to do when GRR is below your benchmark
Five actions, ordered by impact. Each has a clear owner.
1. Identify the churn concentration (FP&A + CS owner, week 1)
Before any intervention, map where the losses are. Pull your churned and contracted MRR for the last 12 months and segment it by:
- Customer ACV tier (enterprise / mid-market / SMB)
- Acquisition cohort (quarterly)
- Product line or pricing tier
- Time-to-churn (how many months after signing)
Most companies find that 60-70% of their GRR loss comes from 20-30% of their customer segments. Fixing the right segment is worth 3-4x the effort of broadly improving everything.
2. Fix the onboarding gap before adding customer success headcount (CS + Product, month 1-2)
Time-to-value is the most consistent predictor of retention. Customers who do not reach a clear activation milestone within the first 30-60 days churn at a materially higher rate. The fix is often not a new CSM hire - it is a defined activation milestone, tracked in your product analytics, with a triggered intervention when customers fall behind.
The data on this is unambiguous. Amplitude's 2025 Product Benchmark Report, analyzing over 2,600 companies, shows that products lose nearly half their activated users in the first week alone - decisions to stay or leave are made in days, not months. Separately, OnRamp's 2025 onboarding research across 161 SaaS CS leaders found that 57% of companies that cut onboarding investment saw churn increase within six months, and 65% of companies using digital onboarding reduced time-to-value by at least 25%.
Onboarding interventions cost a fraction of the incremental CSM headcount that most companies default to when GRR falls.
3. Create a downgrade prevention protocol before it becomes a churn event (CS, month 1)
Contraction MRR is often ignored because it does not show up as logo churn. But it is GRR-destructive and it is frequently a leading indicator of eventual full churn. A customer who halves their seat count has signaled dissatisfaction. Most companies have no process to catch this signal and act on it.
A 45-day downgrade review cadence - triggered when a customer reduces spend by more than 20% - is a straightforward process change that reduces the probability of the subsequent full churn.
4. Model what a 3-point GRR improvement is worth before setting CS headcount budgets (FP&A, month 1)
This is a calculation most finance teams at $5M-$50M ARR companies have not done explicitly. Run it:
- Current ARR: $15M
- Current GRR: 87%
- Annual churn cost: $15M × 13% = $1.95M per year
- At 90% GRR: annual churn cost = $1.5M per year
- Annual churn reduction: $450K
- Cumulative over 3 years (compounded): approximately $1.4M in retained base
At a 6x ARR multiple, $450K in annually retained revenue is worth $2.7M in enterprise value. A CS hire at $120K-$150K OTE paying for itself is a decision that math makes easy. The mistake is making the CS headcount decision without running this model first.
5. Enforce a churn post-mortem process with revenue-weighted priority (CS + Product, ongoing)
Most companies track churn. Very few track it with enough discipline to close the loop between churn reasons and product or process changes. A rigorous churn post-mortem - the kind Gainsight documented from their own internal practice - requires cross-functional attendance (CS, product, sales), a structured root-cause taxonomy, and explicit action ownership. Without all three elements, you produce anecdotes, not decisions.
A useful post-mortem process has three requirements:
- It covers 100% of churned MRR above $X (set a threshold - typically top 50% of churned revenue by value)
- It classifies churn by root cause with a defined taxonomy (not "budget" as the catch-all)
- It has a product or process owner who receives the findings and commits to a response
Without a defined taxonomy and owner, churn post-mortems produce anecdotes, not decisions.
Common mistakes and what to do instead
Mistake: Reporting only NRR on the board deck
NRR alone rewards expansion performance. GRR alone rewards retention performance. Boards that see only NRR cannot distinguish between a healthy business (high GRR + high NRR) and a structurally fragile one (low GRR + high NRR through aggressive upselling).
Replace with: Present both metrics together, with the gap stated explicitly. "Our NRR is 112% and our GRR is 89% - we are recovering 23 points of expansion from churn. Here is where the churn is concentrated and what we are doing about it." That framing presents a trade-off, which is what a board deck should do.
Mistake: Setting a single GRR target for the whole business
A uniform 90% GRR target treats your $2K ACV SMB self-serve segment the same as your $80K ACV enterprise segment. The benchmarks, the intervention strategies, and the economics of customer success investment are fundamentally different across those segments.
Replace with: Segment-specific GRR targets. SMB at 85%+, mid-market at 91%+, enterprise at 95%+. Report them separately. Build your CS headcount model against segment-specific targets.
Mistake: Treating logo retention and revenue retention as interchangeable
A company can have 95% logo retention (losing 5% of customers) and 82% GRR if the churning accounts are disproportionately large. The inverse is also possible: 80% logo retention with 91% GRR if the churning accounts are small.
Replace with: Track both, but make revenue retention the primary decision metric. Logo retention matters for understanding cohort patterns, but GRR is what drives the revenue model and the valuation conversation.
Mistake: Calculating GRR from CRM data
CRM records signed contracts. Billing records actual charges. For companies with monthly or usage-based contracts, mid-cycle amendments, invoice-based customers, or any degree of billing complexity, the gap between CRM ARR and billing MRR is typically 3-8%. When investors calculate GRR independently from your billing data during diligence, that gap becomes a credibility problem.
Replace with: Pull GRR inputs from your billing system. Reconcile billing and CRM quarterly. The process of reconciling these two sources is often where the most significant revenue data problems are discovered.
Mistake: Improving GRR by removing low-ACV customers from the base
Some companies boost reported GRR by deliberately not renewing or churning out the lowest-revenue customers, concentrating the retained base in higher-ACV accounts. The GRR percentage improves. The underlying business is not improving - you are shrinking the customer base to make the retention rate look better.
Replace with: Track GRR on the full cohort. Report separately if you are making deliberate decisions to exit low-value customer segments, and frame those as go-to-market decisions, not retention improvements.
GRR in your FP&A model and board reporting
Where GRR belongs in your revenue model
GRR is the anchor of your SaaS revenue forecasting model. It defines the retention floor before any expansion or new logo contribution is layered on. A revenue forecast that does not start with an explicit GRR assumption is implicitly assuming 100% retention - which inflates the baseline and makes every scenario look more favorable than it is.
The correct model structure:
Starting ARR
× GRR assumption = Retained base ARR
+ Expansion ARR assumption = NRR-driven ARR
+ New logo ARR = Total ARR at period end
Each assumption has an owner. GRR is owned by the head of customer success or the COO. Expansion ARR is owned by the account management lead. New logo ARR is owned by sales. When the forecast is wrong, you know which assumption failed and who owns the conversation.
What GRR signals in a board or investor context
In a Series B or Series C data room, investors calculate GRR independently from your billing data. The sequence is: pull Stripe or Chargebee exports, build the cohort table, calculate GRR and NRR, compare to your board deck. If the numbers diverge by more than 2-3 percentage points, it becomes a diligence conversation - not a valuation conversation.
The metrics investors evaluate together:
| What they see | What they infer |
|---|---|
| High GRR (93%+) + High NRR (115%+) | Healthy retention base + productive expansion motion |
| High GRR (93%+) + Moderate NRR (105-115%) | Solid core product; expansion motion has room to grow |
| Moderate GRR (87-93%) + High NRR (115%+) | Expansion masking moderate churn; monitor segment mix |
| Low GRR (<85%) + High NRR (115%+) | Structural fragility; expansion is churn repair |
| Low GRR (<85%) + Low NRR (<100%) | Product-market fit or customer success systemic issues |
GRR below 85% with high NRR is the pattern that experienced investors recognize immediately as a risk pattern. The expansion is fragile - it requires continuously expanding wallet share from customers who may not have unlimited appetite for that. When expansion plateaus, NRR converges toward GRR, and the growth story unwinds quickly.
The relationship between GRR and SaaS valuation multiples is direct: improving GRR from 87% to 93% - a 6-point move - at a $20M ARR company running a 6x multiple represents approximately $7.2M in implied enterprise value from the retained base improvement alone.
GRR and the net revenue retention benchmark relationship
GRR sets the floor. NRR is the ceiling on what your expansion motion produces above that floor. They should be reported and modeled together as a pair, not as alternatives to each other. The decision GRR enables is different from the decision NRR enables:
- GRR decision: Do we have a retention problem? Is it product, onboarding, segment fit, or customer success capacity?
- NRR decision: Is our expansion motion generating real growth or covering churn? Is our upsell motion working in the right segments?
Running both through your monthly operating review - segmented by ACV tier, with quarter-over-quarter trend - gives you the signal set to make those decisions with confidence.
GRR tracking checklist
Use this as your monthly operating baseline before you add dashboards or reporting infrastructure:
- GRR calculated from billing system data, not CRM
- Cohort defined correctly - existing customers at period start only
- Expansion MRR excluded from the numerator
- GRR segmented by ACV tier (SMB / mid-market / enterprise)
- GRR segmented by acquisition cohort (quarterly)
- GRR-NRR gap calculated and owner assigned
- Churned MRR and contraction MRR tracked separately (not combined)
- Monthly churn post-mortem process in place for top 50% of churned MRR by value
- GRR assumption documented in revenue forecast model with a named owner
- Segment-specific GRR targets set and reviewed quarterly in board reporting
The goal is not a clean dashboard. The goal is a retention number you can defend, a gap you understand, and an owner for each assumption in the model.
Conclusion
GRR is not a substitute for NRR, and it is not a more important metric. It is a different question. NRR tells you whether your existing base is growing. GRR tells you whether the base is sound.
At $5M-$50M ARR, the companies that get this wrong are not the ones that fail to track GRR - they are the ones that track it as a reporting exercise without connecting it to a decision. The retention number sits in the deck, the expansion number looks fine, and nobody owns the input assumption in the forecast.
The more useful framing: your GRR is a forecast input with a human owner, not a score. When it moves, someone needs to explain why it moved and what changes as a result in the revenue model, the CS headcount plan, and the fundraising narrative.
Know your GRR by segment before your next board meeting. Know what your GRR assumption is in your revenue forecast. And know what a 3-point improvement is worth in retained ARR before you decide whether the CS investment to achieve it makes sense.
If you want to audit your retention metrics definitions and make sure your GRR, NRR, and churn calculations are consistent across your billing system, CRM, and board deck - Fiscallion runs a focused metrics audit session designed specifically for this.
