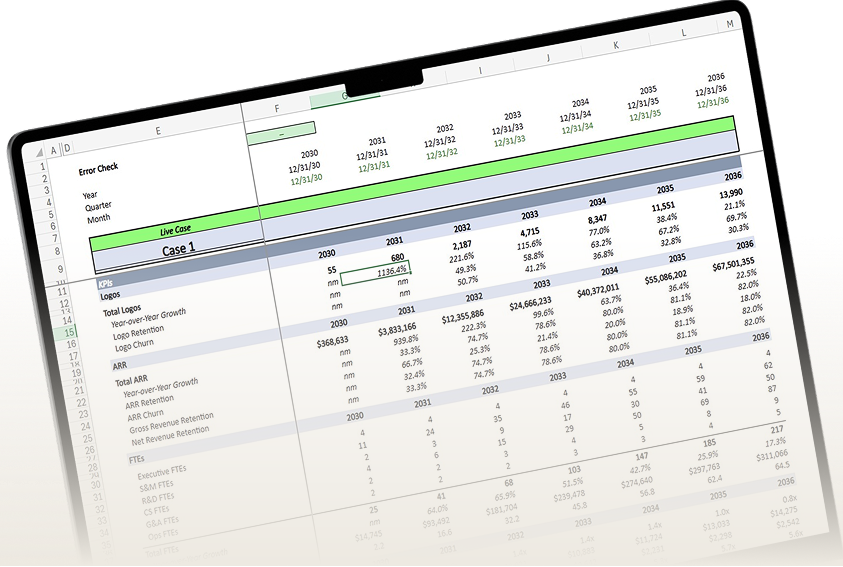


An AI inference cost calculator converts token prices, request volume, retries, and caching into the monthly variable cost of serving one customer. That number is the COGS input your price floor has to clear.
Use the worksheet below to make one decision: what is the minimum price at which an AI customer, or an AI tier, still earns a positive contribution margin. You will leave with three outputs: cost per request, cost per customer, and a price floor stated with explicit assumptions.
This article extends our existing coverage of SaaS unit economics, gross margin, and contribution margin. It does not repeat it. The focus here is one mechanical problem: turning an API invoice into a per-customer number you can price against.
What you will build
- A dated input table where every assumption has a named owner.
- A four-step formula chain: per-request cost, retry and cache adjustment, per-customer monthly cost, price floor.
- A worked example using placeholder inputs, so you can see the arithmetic before you enter your own.
- A tier view that shows where a flat price quietly loses money.
Inference spend is variable COGS, not an engineering line
"Inference cost scales with usage, so it belongs in cost of goods sold and in contribution margin. Contribution margin is what remains after subtracting the variable costs of serving a customer, and API spend is a textbook variable cost."
— Aleksandar Stojanovic, CEO & Founder at FiscallionThe common failure is classification. We have seen a roughly $20M ARR company carry vendor API spend in an engineering budget line. Moving it into COGS cut reported gross margin materially, and every benchmark comparison changed once the number was honest.
Our existing guides cover what gross margin investors expect for AI-native and consumption-heavy products. This article covers the step before that: getting a defensible per-customer cost so the margin you report is the margin you actually earn.
The worksheet: inputs and who owns them
Every cell below is an assumption. Provider prices change, so the price cells should be swappable inputs with an access date beside them, not constants buried in a formula. Pull current rates directly from the OpenAI API pricing page, Anthropic pricing, or the Google Gemini API documentation, and record the date you read them.
The prices in the worked example later in this article are placeholders, not quotes from any provider.
| Input group | Input | Where it comes from | Owner |
|---|---|---|---|
| Provider price | Input price per 1M tokens | Provider pricing page, with access date | Finance |
| Provider price | Output price per 1M tokens | Provider pricing page, with access date | Finance |
| Provider price | Cached-input read price per 1M tokens | Provider pricing page, with access date | Finance |
| Workload | Average input tokens per request | Request logs | Engineering |
| Workload | Average output tokens per request | Request logs | Engineering |
| Workload | Requests per customer per month, by tier | Product analytics | Product |
| Workload | Share of requests per model tier | Routing configuration | Engineering |
| Waste | Retry rate | Error and timeout logs | Engineering |
| Waste | Cache-hit share of input tokens | Provider usage reports | Engineering |
| Waste | Output overshoot (tokens generated beyond what is used) | Request logs | Engineering |
| Ancillary | Embeddings, vector storage, retrieval per request | Vendor invoices | Engineering |
| Ancillary | Router, guardrail, and summarization calls per request | Routing configuration | Engineering |
| Ancillary | Observability and per-customer hosting | Vendor invoices | Finance |
If you cannot fill a cell from logs or invoices, mark it as an estimate and assign someone to replace it. An unowned assumption is how a pricing model drifts away from reality.
How to calculate cost per request, per customer, and the price floor
Four steps, each feeding the next. The running example uses these placeholder inputs: input price $2.00 per 1M tokens, output price $8.00 per 1M tokens, cached-input price $0.50 per 1M tokens, 3,000 input tokens and 600 output tokens per request, 40% of input tokens served from cache, a 10% retry rate, and $0.0010 of ancillary cost per request.
Step 1: price a single request at list rates
Base cost per request = (uncached input tokens x input price) + (cached input tokens x cache price) + (output tokens x output price).
In the example: 1,800 uncached tokens cost $0.0036, 1,200 cached tokens cost $0.0006, and 600 output tokens cost $0.0048. The base request costs $0.0090.
Step 2: adjust for retries and add ancillary cost
Effective cost per request = base cost x (1 + retry rate) + ancillary cost per request.
A retry replays the full request, so a 10% retry rate multiplies cost by 1.10. The example becomes $0.0099 plus $0.0010, or $0.0109 per request.
Step 3: scale to one customer per month
Monthly cost per customer = effective cost per request x requests per customer per month + other variable cost per customer.
At 1,200 requests, inference costs $13.08 per customer per month. Add $4.00 of other variable cost (hosting, storage, attributable support) and the fully burdened variable cost is $17.08.
Step 4: derive the price floor
Price floor = monthly variable cost per customer / (1 - target contribution margin).
At a 70% target, the inference-only floor is $13.08 / 0.30 = $43.60. The fully burdened floor is $17.08 / 0.30 = $56.93. State which one you mean every time you quote a floor. The inference-only floor is a lower bound, not a price.
This floor is separate from the 2.0x fully burdened labor-cost rule we use for services-heavy delivery. API cost behaves differently from labor cost, so the floor is built from a target margin rather than a flat multiple.
Read the result by tier, not as a blended average
A blended cost per customer hides the accounts that lose money. Break the model out by usage tier and test the same flat price against each.
The table below holds the example constant and varies only requests per month, against a flat $49 price and inference-only cost.
| Tier | Requests per month | Inference cost per customer | Contribution after inference | Margin after inference |
|---|---|---|---|---|
| Light | 300 | $3.27 | $45.73 | 93.3% |
| Core | 1,200 | $13.08 | $35.92 | 73.3% |
| Heavy | 5,000 | $54.50 | -$5.50 | negative |
"The blended customer looks healthy. The heavy tier is subsidized by the light tier, which is the same subsidy pattern that shows up when services are priced below delivery cost."
— Aleksandar Stojanovic, CEO & Founder at FiscallionMargin also feeds payback. As gross margin falls, gross-profit-based CAC payback lengthens, so a weak inference margin slows how quickly each new customer repays acquisition cost.
Stress the assumptions that move the number most
Run each sensitivity one at a time against the base case. The goal is to find which assumption deserves an owner and a monthly review.
| Scenario (change from base) | Inference cost per customer | Inference-only floor at 70% target |
|---|---|---|
| Base case | $13.08 | $43.60 |
| Retry rate rises from 10% to 25% | $14.70 | $49.00 |
| Cache-hit share falls from 40% to 0% | $15.46 | $51.52 |
| Output tokens double to 1,200 per request | $19.42 | $64.72 |
In this example, output length moves the floor more than retries or caching. That is a property of the placeholder prices, where output tokens cost four times input tokens. With your real rates, the ranking may differ, which is the reason to run the table rather than assume.
The open inference-cost worksheet is the set of tables above. Copy the input table into a spreadsheet, replace the placeholders with dated provider prices and your own logs, and the floor calculates itself. If you want a CFO-level review of the result, our financial modeling and board reporting service covers how we build and own models like this.
What to do with the number
The floor is an input to packaging, not the price itself. Once you have it by tier, these are the decisions it should drive:
- Usage caps or metered add-ons for tiers where requests per month push cost past the floor.
- Model routing that sends low-value requests to a cheaper model. Model the blended cost as the sum of each model's request share times its cost per request, plus the router's own call cost.
- Caching for repetitive context such as system prompts and shared documents. Cache only pays when the hit share is measured, so treat the hit rate as a tracked metric.
- A retry budget with an owner, so timeouts and regenerations do not silently inflate cost.
- A quarterly rebuild of the price cells. Provider rates move, so a frozen floor goes stale.
The same cost per request also tells you which customers to move to a higher tier first. Start with the accounts whose margin after inference is already negative.
Common mistakes and the replacement move
- Pricing from list token prices alone. Replace with the full chain: caching, retries, and ancillary calls included.
- Leaving API spend outside COGS. Replace with a COGS line for inference before you benchmark gross margin.
- One blended cost per customer. Replace with a tier view and a heavy-user test.
- Treating the floor as the price. The floor is the minimum. Price above it based on value, then check the margin it leaves.
- Estimating retry and cache rates once. Replace with logged rates reviewed on a set cadence by an engineering owner.
- Not knowing what the cloud bill contains. Cost visibility is a known gap: CloudZero research cited in our gross-margin guide found that more than 20% of engineering teams have little or no visibility into cloud spend. Assign per-customer cost tagging before you trust any per-customer number.
Frequently asked questions
How do I calculate the inference cost per customer for my AI product?
Price one request, adjust it, then multiply by usage. Start with input tokens times the input price, plus cached tokens times the cache price, plus output tokens times the output price. Multiply by one plus your retry rate, add ancillary cost per request, and multiply by requests per customer per month. Add any other variable cost per customer to get the fully burdened figure. Do this by usage tier, not as one blended average.
What inputs should an AI inference cost calculator include beyond input and output token prices?
Include request volume per customer, cache-hit share, retry and failure rate, output overshoot, and the share of traffic routed to each model. Add ancillary costs such as embeddings, vector storage, router and guardrail calls, observability, and per-customer hosting. Each input should have a source and an owner. Provider price cells should carry the date you read them from the provider's pricing page.
How do retries, caching, and routing affect the true cost per inference request?
Retries raise cost because a retry replays the whole request, so cost scales by one plus the retry rate. Caching lowers cost on the share of input tokens served from cache at the provider's cached rate. Routing lowers blended cost when cheaper models handle low-value requests, but the router call itself adds cost. Model all three together, because they interact: a retry on an expensive model with a low cache hit rate is the costliest case.
What price floor should I set so my AI product covers inference costs and maintains a positive contribution margin?
Divide monthly variable cost per customer by one minus your target contribution margin. At a 70% target, a customer costing $13.08 in inference needs at least $43.60 per month, and a customer costing $17.08 fully burdened needs at least $56.93. Those figures are placeholders from the worked example. Say whether your floor covers inference only or all variable costs, set it per tier, and treat it as the minimum rather than the price.
Make the floor a standing input
Build the worksheet once, then rerun it whenever a provider changes rates, a model is swapped, or a tier is repackaged. The value is not the single number. It is the habit of pricing AI features against a dated, owned cost model.
If you want a senior review of your own version, every Fiscallion client works directly with Aleksandar Stojanovic at the CFO layer: a senior partner on every engagement, not an account-manager or junior-team handoff. His FP&A leadership experience was gained through the growth of a SaaS company to €100M ARR, and the work is built for B2B SaaS companies at $5-100M ARR. Start with the financial modeling and board reporting service when you want the model owned, not just built.