A SaaS spend optimization case study is a vendor-published account of cost reduction. Treat it as a claim to reconcile to cash, not as a result you can plan around.
Before you commit to a vendor consolidation or renegotiation, you need to know which part of a published savings number is cash that left the bank account, which part is a price increase that never happened, and which part is a discount quoted but not yet paid for. This article audits five published cases to show where those three get blended, then gives you a worksheet to separate them.
Key takeaways
- Published case studies are marketing claims, not audited results. The useful question is what each one can prove.
- Wording drifts between a vendor's case page, its social posts, and third-party aggregators. In the cases below, "potential" became "saved" and platform averages became a client outcome.
- A headline total is only as good as its itemization. One case itemizes $200,000 of a $271,200 claim.
- Realized cash savings equal the drop in cash paid against a defensible baseline, minus implementation cost.
- You can apply the worksheet later in this article to any case study, or to your own vendor's proposal.
Why a case study cannot prove cash savings on its own
A case study proves what the vendor chose to publish. It rarely shows invoices, contract dates, baseline assumptions, or the cost of getting the savings.
Three different numbers hide inside most headline figures:
| Term | Definition | Does it reduce cash out? |
|---|---|---|
| Quoted discount | The gap between a list or prior price and a new quoted price | Only once the new contract is signed and paid |
| Avoided spend | An increase you would have faced and did not | No. It lowers the forecast, not the bank balance |
| Realized cash savings | Cash paid after the change, compared with cash paid before it, net of implementation cost | Yes |
Avoided spend is legitimate, but it depends on a baseline someone chose. SpendHound's Kyruus Health case page cites routine annual vendor price uplifts of 5-10%. If a claimed saving is measured against a baseline that includes such an uplift, part of it exists only on paper.
This is the same classification discipline you would apply in a forecast: one bucket per number, with the assumption owned by a named person.
Five published cases rest on five different evidence bases
I reviewed five vendor-published cases. Only two have a first-party case page I could read directly. The other two rest on social posts. The fifth contains no client-specific savings figures at all.
| Case | Claim as published | Evidence base | What is missing |
|---|---|---|---|
| Kyruus Health (SpendHound) | $100K-$400K annual savings potential, up to 50% fewer Monday.com licenses, implementation in about three weeks | Vendor case page | Which part is realized cash; the baseline |
| WellDyne (SaaSrooms) | $271,200 verified in 90 days against a $300,000 two-year target | Vendor case page, published August 7, 2024 | $71,200 of the total is not itemized |
| Qliro (Viio, a Matrix42 company) | Qualitative: license visibility, less over-licensing, standardized purchasing | Vendor case page | Any Qliro-specific number |
| Simpplr (Spendflo) | About $100K saved "in the first few months" | Vendor LinkedIn post, 2026-08-17 | Case page, baseline, defined period |
| Unnamed 300-person company (Spendbase) | $400K annual savings, 6-week implementation | One account executive's LinkedIn post, 2026-03-03 | Named client, documents, cost basis for the stated ROI |
"The point is not that these vendors are wrong. The point is that none of these records lets you verify cash. Each one needs a provenance label before you reuse its numbers in a board deck or a budget."
— Aleksandar Stojanovic, CEO & Founder at FiscallionThree discrepancies show where headline numbers drift
The most useful finding in this review is not any savings figure. It is how the same story changes as it moves between channels.
"Savings potential" became "saved"
The Kyruus Health case page headline and summary say "annual expense avoided," and its results section says "savings potential" of $100K-$400K. SpendHound's LinkedIn post of 2025-12-09 says Kyruus "saved up to $400K in annual SaaS expenses."
Those are three different claims: avoided, potential, and saved. Only the last one is cash, and the post uses the top of a range as the headline.
The page does give useful mechanics. SpendHound used Okta login data over 30-, 60-, and 90-day windows, and the page reports about 1.5 hours per month saved coordinating renewals. That is a usage-based rightsizing method you can copy, even though the dollar figure stays unproven.
Platform averages were attributed to a client
Viio's Qliro page shows three stat icons: 25% average savings, 7x average return on investment, and 90 days average payback. These are Viio and Matrix42 platform-wide averages, not Qliro outcomes. The page itself describes only qualitative Qliro results.
A third-party aggregator page then wrote that Viio helped Qliro achieve "an average of 25% savings with a 7x return on investment." That sentence converts a marketing average into a named client result. If you cite the aggregator, you inherit the error.
An old case was republished as new
SaaSrooms' LinkedIn post of 2026-10-06 repeats the WellDyne figures but describes the customer only as "a leading pharmacy benefits company." The figures date to a case published on August 7, 2024.
Recycling is not dishonest in itself. It does mean a social post in late 2026 may describe 2024 contract conditions. Always date the measurement window before you compare it with current pricing.
The WellDyne case shows why itemization matters
SaaSrooms describes WellDyne as a pharmacy benefits provider with a SaaS budget above $4M. The page claims $271,200 in verified savings within 90 days, equal to 90% of a $300,000 two-year target.
The page itemizes three levers:
| Lever | Claimed savings (USD) | Note on the page |
|---|---|---|
| AWS | $130,000 | None beyond the amount |
| Microsoft 365 | $35,000 | None beyond the amount |
| Tableau | $35,000 | 35% of Tableau seats unused |
| Itemized total | $200,000 | Derived sum |
| Unitemized remainder | $71,200 | Derived: $271,200 minus $200,000 |
| Claimed total | $271,200 | Vendor claim |

The remainder is not necessarily wrong. It is simply not explained on the page. A reader who sees only the headline cannot tell whether it is cash, a renewal discount, or avoided spend.
Notice also that "verified" is the vendor's word. The page does not say who verified it or against which invoices.
A neat reconciliation still needs independent evidence
The Spendbase example reconciles cleanly, which makes it a good contrast. An account executive's LinkedIn post describes an unnamed 300-person company with $400K in annual savings.
| Lever | Claimed annual savings (USD) |
|---|---|
| Unused subscriptions eliminated | $180,000 |
| 28 over-licensed tools right-sized | $95,000 |
| 5 project tools consolidated into 2 | $75,000 |
| 8 contracts renegotiated | $50,000 |
| Total | $400,000 |

The levers add up exactly. The same post reports 187 active subscriptions found against 85 assumed, 34% of licenses with zero logins in 90 days, and 12 tools with overlapping functionality. It also states "ROI: 12x in the first year."
Source: one Spendbase enterprise account executive's social post, 2026-03-03. It is not independently verified, and the client is unnamed.
A clean sum is not evidence. It shows internal consistency, nothing more. The 12x figure also gives no cost basis, so you cannot check the denominator. Keep this case as a pattern for where to look (unused seats, over-licensing, overlap, renewal terms), not as a benchmark for your savings.
What each case proves, mapped to the optimization lifecycle
Vendors such as Matrix42 describe a four-stage lifecycle: Discover, Manage, Optimize, Procure. The mapping below is my own synthesis from the case facts above, not a vendor claim.
| Stage | What it means in practice | Where the cases illustrate it |
|---|---|---|
| Discover | Find every tool, contract, and usage signal | Kyruus (login data), Spendbase client (subscription count) |
| Manage | One system of record, named owners, renewal calendar | Kyruus (renewal workflow), Simpplr (single agreement repository) |
| Optimize | Cut unused and duplicate tools, right-size licenses | Kyruus, WellDyne, Spendbase client |
| Procure | Negotiate renewals against a benchmark | WellDyne, Simpplr (renewals negotiated via ticket), Spendbase client |
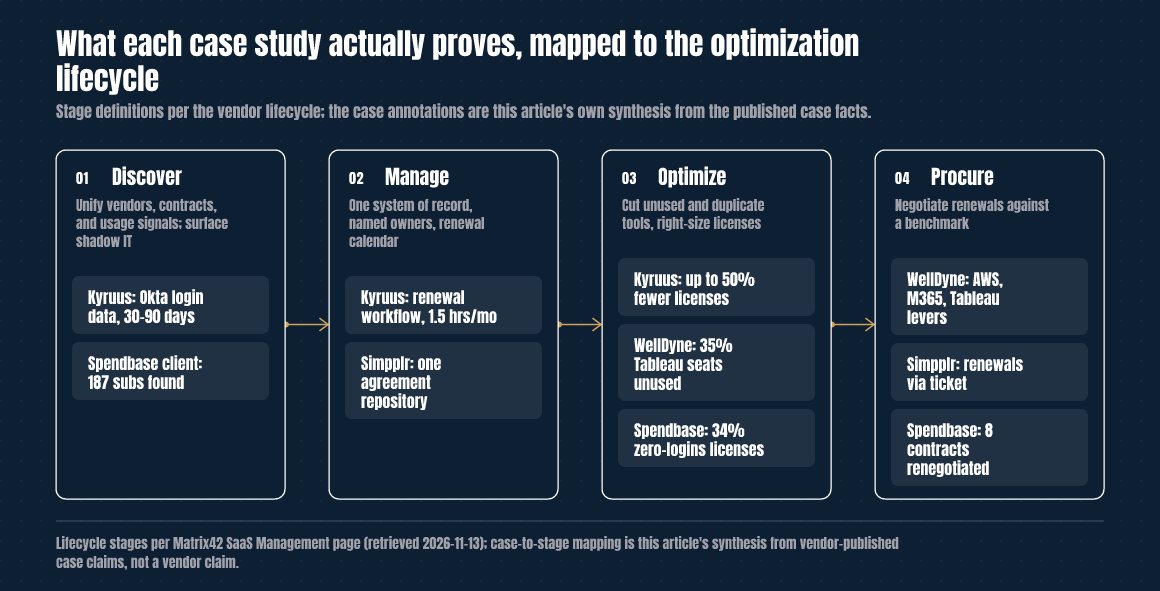
Each case shows activity at a stage. None shows the full chain from invoice to cash. That chain is what you need to build yourself.
The discovery stage carries the most risk for founders. If you cannot list your tools, contracts, and owners in one place, any savings number sits on a weak baseline. The finance version of this is the export, upload, ask, stale, repeat loop: each question gets a fresh spreadsheet that is out of date by the next meeting. Vendor sprawl, in my experience, erodes margin quietly, because no single report ever shows it.
How to calculate realized cash savings
Use one formula, applied to a defined window, with each input tied to a document.
- Step 1: Set the baseline. Use the contract terms in force before the change, including any scheduled uplift you have already agreed to. Do not use list price.
- Step 2: Measure cash paid after the change. Use invoices and bank payments over the same length of time as the baseline period.
- Step 3: Adjust for volume. If headcount or usage changed, restate the baseline at the new volume. Otherwise you credit the negotiation for a change that came from hiring or attrition.
- Step 4: Subtract implementation costs. Include tool fees, internal hours, migration work, and any overlap period when you paid for both tools.
- Step 5: Separate avoided spend. Report it on its own line, never inside the cash total.
The result: realized cash savings equal baseline cash minus actual cash, less implementation cost. Annualize only after the savings have appeared in at least one full invoice cycle.
Savings-validation worksheet
Apply this to any case study, vendor proposal, or internal savings claim. Fill the right-hand column from documents, not from the summary.
| Line | What to enter | Evidence required |
|---|---|---|
| 1. Quoted discount | New quoted price versus prior price | Signed quote |
| 2. Contract status | Signed, pending, or verbal; effective date | Executed contract |
| 3. Avoided spend | Increase you would have faced (for example a scheduled uplift) | Prior contract clause or vendor notice |
| 4. Seats or tiers removed | Count and unit price | Admin console export and invoice |
| 5. Cash paid before | Invoiced and paid amounts over the baseline window | Invoices, bank record |
| 6. Cash paid after | Same window length, restated for volume | Invoices, bank record |
| 7. Implementation costs | Tool fees, internal hours, migration, overlap payments | Billing and time records |
| 8. Unitemized remainder | Claimed total minus the sum of itemized levers | Reconciliation |
| 9. Realized cash savings | Line 5 minus line 6 minus line 7 | All of the above |
| 10. Evidence grade | Invoice-backed, usage-backed, or vendor claim only | Your judgment, stated explicitly |
Run each lever through the sheet separately. A lever with no document in the right-hand column stays out of the forecast.
Use the savings-validation worksheet above on your next vendor proposal or case study. If you want a senior review of the assumptions before you sign, the fractional CFO service is the secondary option.
How to interpret the result and what to do next
Read the output as a range with three tiers, not a single number.
- Invoice-backed savings go into the forecast and runway model.
- Usage-backed savings (seats unused, logins at zero) go in as likely, with an owner and a date for the contract action.
- Vendor-claim-only savings stay out of the model until a document supports them.
Then take these steps:
- Assign an owner to each lever and a renewal date by which the action must happen.
- Compare implementation cost against first-year realized savings before approving a consolidation.
- Re-run the worksheet after one invoice cycle and replace estimates with actuals.
- Report the board a trade-off, such as "we are cutting these tools and reinvesting here," rather than a savings headline.
"A savings figure that cannot be tied to a payment will not survive a board question."
— Aleksandar Stojanovic, CEO & Founder at FiscallionCommon mistakes and replacement moves
| Mistake | Why it fails | Replacement move |
|---|---|---|
| Citing the top of a range as the result | "Up to" is a ceiling, not an outcome | Use the low end for planning and the invoice-backed amount for reporting |
| Mixing avoided spend with cash savings | The bank balance does not change | Report avoided spend on a separate line |
| Reusing a vendor's average as a benchmark | Platform averages cover different customers and periods | Use your own usage and invoice data |
| Trusting a headline total with no itemization | The unitemized part may be anything | Require a lever-by-lever reconciliation |
| Ignoring implementation cost | Overlap payments and internal hours reduce net savings | Subtract them on line 7 |
| Citing an aggregator page | It may copy and distort the vendor's wording | Go to the vendor's own page and note its date |
FAQ
How do SaaS spend optimization case studies separate quoted discounts from actual cash savings?
Most do not separate them clearly, so you have to do it yourself. A quoted discount is a price on a quote, avoided spend is an increase that did not happen, and cash savings are lower payments that appear in your bank record. In the cases reviewed here, the Kyruus Health page itself moves between "expense avoided" and "savings potential," while a social post said "saved." Use lines 1, 3, and 9 of the worksheet to keep the three apart.
What should I look for in a SaaS spend optimization case study to know if it applies to my company size and stack?
Look for a named client, a stated period, and a lever-by-lever breakdown. Then compare the tools involved with yours. WellDyne's page describes a SaaS budget above $4M and levers in AWS, Microsoft 365, and Tableau. Spendbase's unnamed 300-person company shows unused and overlapping tools. If a case has no named client or no itemization, treat it as a pattern to test, not a benchmark.
Do SaaS spend optimization case studies account for implementation and switching costs, or only headline savings?
In the cases reviewed, the published pages mostly emphasize headline savings. Implementation is mentioned as a timeline (about three weeks for Kyruus, 6 weeks for the Spendbase client), not as a cost line. The Spendbase post states a 12x first-year ROI without showing its cost basis. Add your own tool fees, internal hours, and overlap payments before you accept any net figure.
Can a fractional CFO help validate SaaS spend reduction claims before we commit to a vendor consolidation or renegotiation?
Yes, because the work is financial judgment more than software selection. A fractional CFO can set the baseline, classify each lever as discount, avoided spend, or cash, and show the effect on runway and the forecast before you sign. Every Fiscallion client works directly with Aleksandar Stojanovic at the CFO layer, with senior-partner ownership on every engagement. Fiscallion works above the ledger and alongside your existing accountant or bookkeeper, not in place of one.
The decision to make before the next renewal
Treat every savings claim as a hypothesis with a baseline, an owner, and a document. The cases above show how quickly "potential" turns into "saved" and how a platform average can end up attached to a client.
The commercial question is simple: which of your savings are paid, which are likely, and which are only quoted? Answer that on the worksheet before the contract is signed, not after the first invoice. My own FP&A leadership experience gained through the growth of a SaaS company to €100M ARR taught me that the forecast only improves when each number has an owner.