

A SaaS forecast variance analysis template compares actual results against your forecast, then splits the gap into named drivers, such as timing, volume, price, mix, one-offs, and classification, so each variance points to a decision instead of a debate.
Most founders track forecast accuracy as a single percentage: we missed revenue by 8%. That number alone tells you nothing. An 8% miss caused by delayed onboarding is a different problem than an 8% miss caused by churn, and the two require opposite responses. This article gives you the variance bridge structure, the formulas behind it, the cadence to run it on, and the traps that make variance reviews a waste of a finance leader's time.
What you'll learn
- The variance bridge template: columns, rows, and the sign convention that keeps a board deck consistent.
- The calculation logic behind price, volume, and mix variance, with a worked SaaS example.
- How to interpret each driver category so the variance resets the next forecast instead of just explaining the last one.
- A monthly, weekly, and quarterly cadence built around decision lead time, not habit.
- The mistakes that turn variance analysis into theater, and what to do instead.
A variance number alone triggers the wrong response
A $45,000 revenue miss looks like one problem. It is usually five.
In a worked example from Kudwa's variance guide, a $45,000 shortfall breaks into $20,000 from delayed onboarding, $15,000 from churn, $7,000 from foreign exchange movement, and $3,000 from a classification error. Each of those four causes demands a different fix. Delayed onboarding is a scheduling problem. Churn is a retention problem. FX is a hedging or pricing-currency conversation. Classification is a bookkeeping correction, not a business problem at all.
"Report the $45,000 as a single number and the natural reaction is to tighten the sales forecast across the board. That is the wrong move for three of the four causes."
— Aleksandar Stojanovic, CEO & Founder at FiscallionThis is why CIMA's definition of variance analysis, cited in BPR Global's guide, frames it as the systematic comparison of actual performance against plan, decomposed into root causes that inform a corrective decision, not just a comparison of two totals.
The plan is supposed to be wrong. What matters is what the gap tells you about how the business actually behaves this quarter versus how you assumed it would behave when you built the forecast.
The practice gap here is wide. Fewer than 25% of mid-sized companies perform systematic price-volume-mix decomposition on their variances, according to IMA research cited by Onetribe. Most teams stop at the headline number and move on.
The variance bridge: the template structure
The template is a table, not a narrative. Each row is a line item; each column forces a decision-relevant answer.
| Line item | Plan | Actual | Variance ($, %) | Driver category | Owner | Action |
|---|---|---|---|---|---|---|
| New ARR | Timing / volume | Sales lead | ||||
| Expansion ARR | Volume / mix | CS lead | ||||
| Contraction ARR | Price / mix | CS lead | ||||
| Churned ARR | Volume | CS lead | ||||
| COGS | Volume / price | Ops lead | ||||
| Opex, headcount | Timing / volume | Head of finance | ||||
| Opex, non-headcount | Price / one-off | Head of finance | ||||
| Net burn / runway impact | Composite | Founder/CFO |
Split revenue into new, expansion, contraction, and churned ARR rather than one blended revenue line. A revenue miss driven by churn and a revenue miss driven by slow new-logo bookings look identical on a single top-line number and require completely different responses.
Split opex into headcount and non-headcount. Headcount variance is almost always a timing issue (a hire slipped a month) rather than a budget failure, while non-headcount variance is more often a genuine price or one-off event.
State your sign convention once and use it everywhere: positive variance means favorable to the plan, negative means unfavorable. Every column, every month, every deck. A board that has to relearn your sign convention every quarter will not trust the number underneath it.
How to calculate each driver
Four formulas cover most of what a SaaS variance bridge needs, drawn from Grove FP's variance analysis guide:
- Price variance = (Actual price − Planned price) × Actual volume
- Volume variance = (Actual volume − Budget volume) × Budget price
- Mix variance = the portion of the gap attributable to a shift in the composition of what sold (segment, plan tier, or product), holding price and volume constant
- FX variance = (Actual rate − Budget rate) × Actual FX-denominated amount
Grove FP's worked example shows a company budgeting £500,000 in revenue and landing at £475,000 actual. The £25,000 gap decomposes into discounting driving down realized price, a lower deal count than planned, and a shift toward a lower-value contract mix, partially offset by unplanned expansion revenue. None of those four components would be visible from the £25,000 headline alone.
Not every variance deserves a driver breakdown. Set a materiality threshold, in dollars and in percentage of the line item, below which you note the variance and move on. Onetribe's guidance is direct on this: thresholds exist so a team doesn't spend a meeting explaining a $500 gap while a $200,000 trend goes unaddressed in the same deck.
Keep the variance bridge template open and reusable. Copy the table structure above into your own model and run it every close cycle.
For help building the underlying forecast model and board-ready variance reporting, see Fiscallion's financial modeling and board reporting service.
How to interpret each driver category
The driver category tells you what kind of decision the variance is asking for. Treating all categories the same is the single fastest way to make a variance review useless.
- Timing. A deal closed in month two of a quarter instead of month one. This is not weak demand. Do not cut the pipeline forecast because of a timing variance; check whether the deal still closed within the quarter.
- Volume. Fewer units, seats, or deals than planned. This is a real signal about demand or sales execution and usually should flow into next month's forecast.
- Price. Realized price differs from planned price, often through discounting. This is a pricing and deal-desk conversation, not a forecasting one.
- Mix. The composition of what you sold shifted, tier mix, segment mix, or product mix. Mix variance often explains "we hit the revenue number but missed the margin" months.
- One-off. A single non-recurring event, a refund, a settlement, a one-time credit. Exclude one-offs from trend analysis; including them in a run-rate forecast is a common way founders overstate or understate momentum.
- Classification. An accounting or categorization error, not a business event. Fix the ledger entry and move on; a classification variance should never change a forward assumption.
Named assumptions matter as much as named drivers. If next quarter's forecast assumes 40% pipeline conversion and this quarter actually converted at 28%, that gap is not a rounding error you smooth over. It is a decision about whether you believe conversion improves, and why.
Headcount plans add a second layer of ambiguity here. Approved headcount, in-process headcount, and modeled headcount can diverge by 10 to 15% in a fast-growing company at any given moment. Your burn forecast needs to state explicitly which version of the headcount plan it is using, because the gap between those three numbers alone can explain a meaningful chunk of a burn variance.
Cadence: what to run monthly, weekly, and quarterly
Cadence should be set by how fast the business changes and how long it takes you to act on a decision, not by calendar habit. Model Reef's guidance frames this as choosing cadence by decision lead time and volatility, with named owners, clear definitions, and explicit rules for when a number gets locked versus reforecast.
| Cadence | What runs | Who it's for |
|---|---|---|
| Weekly | Cash and ARR check against the direct forecast | Under 12 months runway, or mid-fundraise |
| Monthly | Full variance bridge plus forecast rebuild | Standard for growth-stage SaaS |
| Quarterly | Full reforecast across revenue and cost lines | Minimum standard for every company |
Quarterly reforecasting is the floor, not the target. Grove FP's reforecasting guidance treats quarterly as the minimum acceptable cadence, with monthly as the better fit for fast-growth SaaS, and a rolling 12 to 18 month forecast horizon so you are never planning against a fixed calendar-year wall.
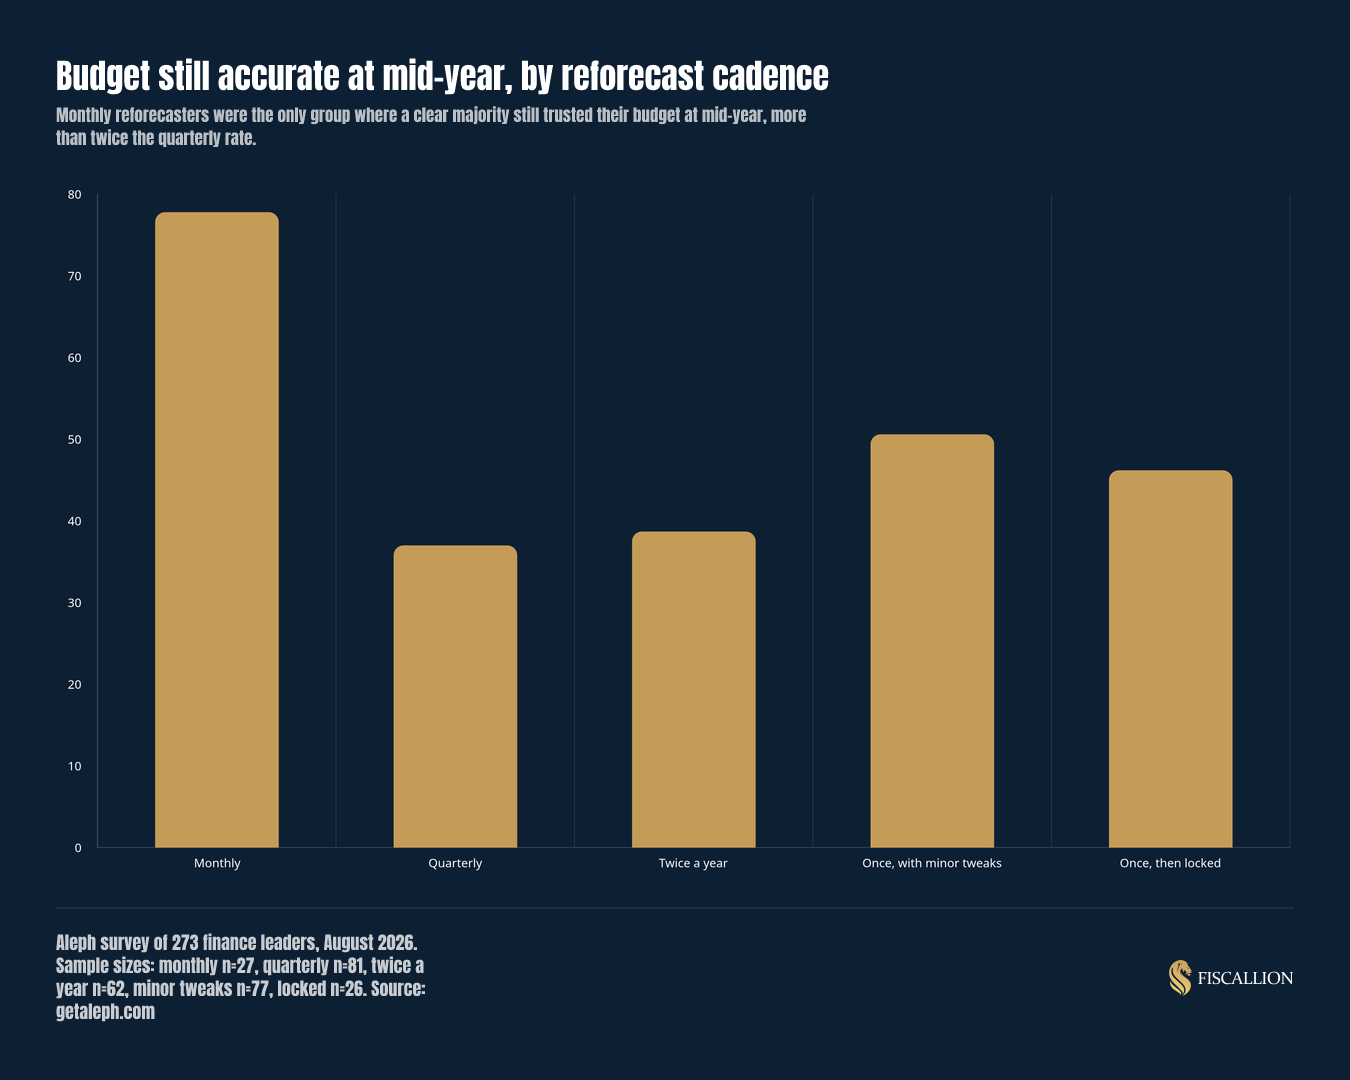
The cadence gap has a measurable cost. An Aleph survey of 273 finance leaders found that 53.9% report having a stale budget by mid-year. Monthly reforecasters were more than twice as likely to still trust their budget's accuracy at mid-year compared to quarterly reforecasters, 77.8% versus 37.0%. The monthly cohort in that survey was a smaller sample (n=27) than the quarterly cohort (n=81), so treat it as a strong directional signal rather than a precise benchmark, but the direction is consistent with every other cadence source in this space.
"Update assumptions when reality diverges more than 15% from projection on any component; below that threshold, hold the assumption and keep collecting evidence. Reforecast both revenue and cost lines together, since a revenue shift cascades through gross margin, headcount timing, and cash within the same close cycle."
— Aleksandar Stojanovic, CEO & Founder at FiscallionEvery Fiscallion client works directly with Aleksandar Stojanovic at the CFO layer on this cadence, senior partner on every engagement, not an account manager handing the model to a junior analyst. That judgment comes from FP&A leadership experience gained through the growth of a SaaS company to €100M ARR, where the forecast rebuild and the variance bridge ran on the same monthly clock described here.
Aleksandar makes the same point about reforecasting in a recent LinkedIn post: the failure is not having built a wrong forecast, it is reporting against a budget nobody updated.
Common mistakes and the replacement move
- Mistake: comparing two totals without decomposing them. Replacement: run every material variance through the driver categories above before you write a single sentence of narrative.
- Mistake: no named owner on any driver. Replacement: assign an owner to every row in the bridge template. A variance with no owner gets explained by whoever is in the room, which is how bad narratives survive.
- Mistake: explaining every variance the same way. Replacement: match the response to the driver, timing gets a check-in, volume gets a forecast update, one-offs get excluded from trend.
- Mistake: smoothing assumptions when actuals start diverging. The plan is supposed to be wrong; smoothing the gap away removes the signal the variance was supposed to give you.
- Mistake: reporting revenue growth without margin and cash context. A revenue beat driven by heavy discounting is not the win the headline suggests.
- Mistake: mixing gross and net burn without saying which one you're using. The basis mismatch between gross and net burn can create a headline gap of two to four months of apparent runway, entirely from a definitional inconsistency rather than a real change in cash position.
The practical asset: keep the bridge open and reusable
The table structure in this article is the asset. Copy it into your own model, wire it to your actual chart of accounts and ARR bridge, and run it every close cycle rather than rebuilding it from scratch each time. The value compounds: month over month, the driver history becomes a record of which assumptions your business consistently gets wrong, and that record is worth more than any single month's variance number.
Frequently asked questions
What is a SaaS forecast variance analysis template and how does it work?
A SaaS forecast variance analysis template is a table that compares your planned figures against actuals for each line item, calculates the dollar and percentage gap, and assigns each gap to a driver category, timing, volume, price, mix, one-off, or classification. It works by forcing a named owner and a specific next action for every material variance rather than a single blended explanation. The output is not the variance percentage itself; it is the decision the variance points to, whether that's a pricing fix, a hiring delay, or an assumption reset in next month's forecast.
What metrics should a SaaS variance bridge track to explain forecast gaps?
Split revenue into new, expansion, contraction, and churned ARR rather than one revenue line, since each behaves differently and points to a different team. Track COGS and gross margin alongside revenue, since a revenue beat driven by discounting often erodes margin at the same time. Split opex into headcount and non-headcount, since headcount variance is usually a timing issue while non-headcount variance is more often a genuine price or one-off event. Finally, track net burn and runway impact as a composite row that rolls up the effect of every driver above it, so the board sees the cash consequence, not just the revenue story.
How often should SaaS founders run a forecast vs. actuals variance analysis?
Run a weekly cash and ARR check if you have under 12 months of runway or you're mid-fundraise, since decision lead time is short and errors compound fast. Run the full variance bridge and forecast rebuild monthly for most growth-stage SaaS companies; this is the cadence most consistently associated with keeping the budget accurate through the year rather than going stale by mid-year. Run a full reforecast across revenue and cost lines quarterly at minimum, even if your business is stable enough that monthly feels unnecessary. Update any individual assumption whenever actuals diverge more than 15% from the projection on that specific component, regardless of where you are in the monthly or quarterly cycle.
Can a variance analysis template work alongside my existing bookkeeper or accountant?
Yes, and it should. Your bookkeeper or accountant keeps the ledger accurate, closes the books, and produces the actuals that feed the top half of the variance table. The variance template works above that ledger: it takes the clean actuals your bookkeeper produces and turns them into driver decomposition, owner assignments, and forecast decisions. Fiscallion is not a bookkeeping firm and does not replace that function; the FP&A layer described in this article assumes your ledger is already accurate and focuses entirely on what the numbers mean for your next forecast, hiring plan, and board conversation.
The variance is the least useful number in the model, until you decompose it
A forecast miss reported as a single percentage tells you that something happened. A forecast miss run through a driver decomposition tells you what happened, who owns the response, and what to change in next month's forecast. That difference is the entire discipline of variance analysis.
Keep the variance bridge template above open and reusable every close cycle. If you want help building the forecast model underneath it and the board-ready reporting on top of it, Fiscallion's financial modeling and board reporting service is built around exactly this cadence.