

SaaS forecast accuracy metrics measure how close a forecast lands to what actually happened, using error size (MAPE, WMAPE), error direction (bias), value added versus a naive baseline (FVA), and how error grows as the forecast horizon extends. Together they answer one question the board actually cares about: can you trust this number, or are you presenting a guess with a decimal point.
Most founders find out their forecast is wrong the hard way, at the board meeting, when someone asks why revenue landed 20% under plan. The fix is not a better dashboard. It is tracking the right accuracy metrics before the miss happens, so you know which forecast to trust and which one needs a caveat.
This is common. Fewer than 25% of sales leaders report forecasts accurate within 10% of actuals, according to Gartner's 2024 research, and 80% of sales and finance leaders missed a quarterly forecast at least once in the past year per Xactly's 2024 benchmark report. If your forecast misses, you are not an outlier. The question is whether you know it is missing, by how much, and in which direction, before the board does.
What you'll learn
- The six metrics that define forecast accuracy, with formulas
- How to calculate them without a data team
- Stage-adjusted benchmark bands so you know which range applies to you
- How far out a forecast stays reliable before it decays
- The scorecard to run this quarter, and the mistakes that quietly wreck accuracy
Forecast accuracy is a system property, not a spreadsheet property
"A forecast is not accurate or inaccurate because of the model. It is accurate or inaccurate because of the definitions, cadence, and assumptions feeding it."
— Aleksandar Stojanovic, CEO & Founder at FiscallionTwo companies can run the identical financial model and get different accuracy results, because one reconciles CRM, billing, and finance data before reporting and the other does not. The spreadsheet is rarely the problem.
This matters because most founders respond to a forecast miss by rebuilding the model. That fixes nothing if the underlying definitions were never anchored. Before you calculate a single metric, three anchors need to be fixed:
- Period: are you comparing monthly, quarterly, or annual actuals to forecast
- Revenue basis: new bookings, total ARR, billed revenue, or cash collected are four different numbers with four different error rates
- Submission point: the forecast made on day 1 of the quarter and the forecast made on day 60 are not the same forecast
Skipping this step is why two people in the same company can report wildly different "accuracy" for the same quarter. It is not incompetence. It is an undefined comparison.
The six metrics that define SaaS forecast accuracy
Accuracy has four distinct dimensions: how big the error is, which direction it runs, whether your process added value over a naive guess, and how fast error compounds as the horizon extends. One number cannot carry all four.
| Metric | Formula | What it catches | SaaS-specific trap |
|---|---|---|---|
| MAPE (Mean Absolute Percentage Error) | Average of |actual - forecast| / actual, as a % | Overall error size | Undefined or distorted when actuals are near zero, or on new-logo segments with small denominators |
| WMAPE (Weighted MAPE) | Sum of absolute errors / sum of actuals | Error size, weighted by revenue size | The board-defensible version of MAPE; use this over raw MAPE for company-level reporting |
| Forecast bias | Signed sum of (forecast - actual) | Direction of error, over- or under-forecasting | A near-zero MAPE can hide a bias problem if positive and negative misses cancel out |
| FVA (Forecast Value Added) | Accuracy of your forecast vs. a naive baseline (e.g., last period's actual) | Whether your process is adding value at all | Manual overrides frequently make the forecast worse than the naive baseline, not better |
| Error by horizon | Same error formulas, segmented by how far out the forecast was made | How fast confidence should decay as horizon extends | Treating a 24-month projection with the same confidence as a next-quarter number |
| Definition drift | Variance between data sources feeding the same line item | Whether "accuracy" is even measuring the same thing twice | Approved, in-process, and modeled headcount figures alone can diverge by 10-15%, each producing a different burn forecast |
FVA is the metric most companies skip and the one that catches the most expensive mistake. Gilliland's original FVA research defines it as the change in forecast accuracy attributable to a specific step or participant in the process, measured against a naive forecast, and found that manual overrides frequently make forecasts worse, not better.
"If next quarter's revenue forecast assumes 40% pipeline conversion and the current quarter's conversion rate is 28%, that assumption is not conservative, it's a decision."
— Aleksandar Stojanovic, CEO & Founder at FiscallionThat is the point of naming assumptions before you calculate accuracy: an unexamined input is not a forecast, it is a placeholder wearing a forecast's clothing.
How to calculate WMAPE and bias in one worked example
Take a quarter with three monthly forecasts and actuals for new bookings.
- Month 1: forecast $400K, actual $380K, absolute error $20K
- Month 2: forecast $420K, actual $460K, absolute error $40K
- Month 3: forecast $450K, actual $430K, absolute error $20K
WMAPE = (20K + 40K + 20K) / (380K + 460K + 430K) = 80K / 1,270K = 6.3%
Bias = (400K - 380K) + (420K - 460K) + (450K - 430K) = 20K - 40K + 20K = $0K net, but that near-zero bias is misleading. It hides a real swing: one month under-forecast by $40K, two months over-forecast. Reporting only the net bias would tell the board the forecast is fine when the process is actually swinging in both directions.
This is why WMAPE and bias are reported together, never alone. WMAPE tells you the size of the miss. Bias tells you whether it is a pattern (always optimistic, always conservative) or noise (swings in both directions).
Do not run this calculation until period, revenue basis, and submission point are fixed, or the number you get will not be comparable quarter over quarter.
How to interpret your accuracy number against stage-adjusted bands
An 18% MAPE means something different at $3M ARR than it does at $60M ARR. Interpreting your number without adjusting for stage is the single most common misread in forecast reporting.
| Company stage | ARR range | Typical forecast variance |
|---|---|---|
| Early-stage | Under $1M | ±30-50% |
| Seed | $1M-$5M | ±25-35% |
| Growth | $5M-$30M | ±15-25% |
| Scale | $30M-$100M | ±10-20% |
Source: Fairview's 2024 forecast accuracy benchmarks, aggregating Xactly 2024 and stage-based practitioner data.
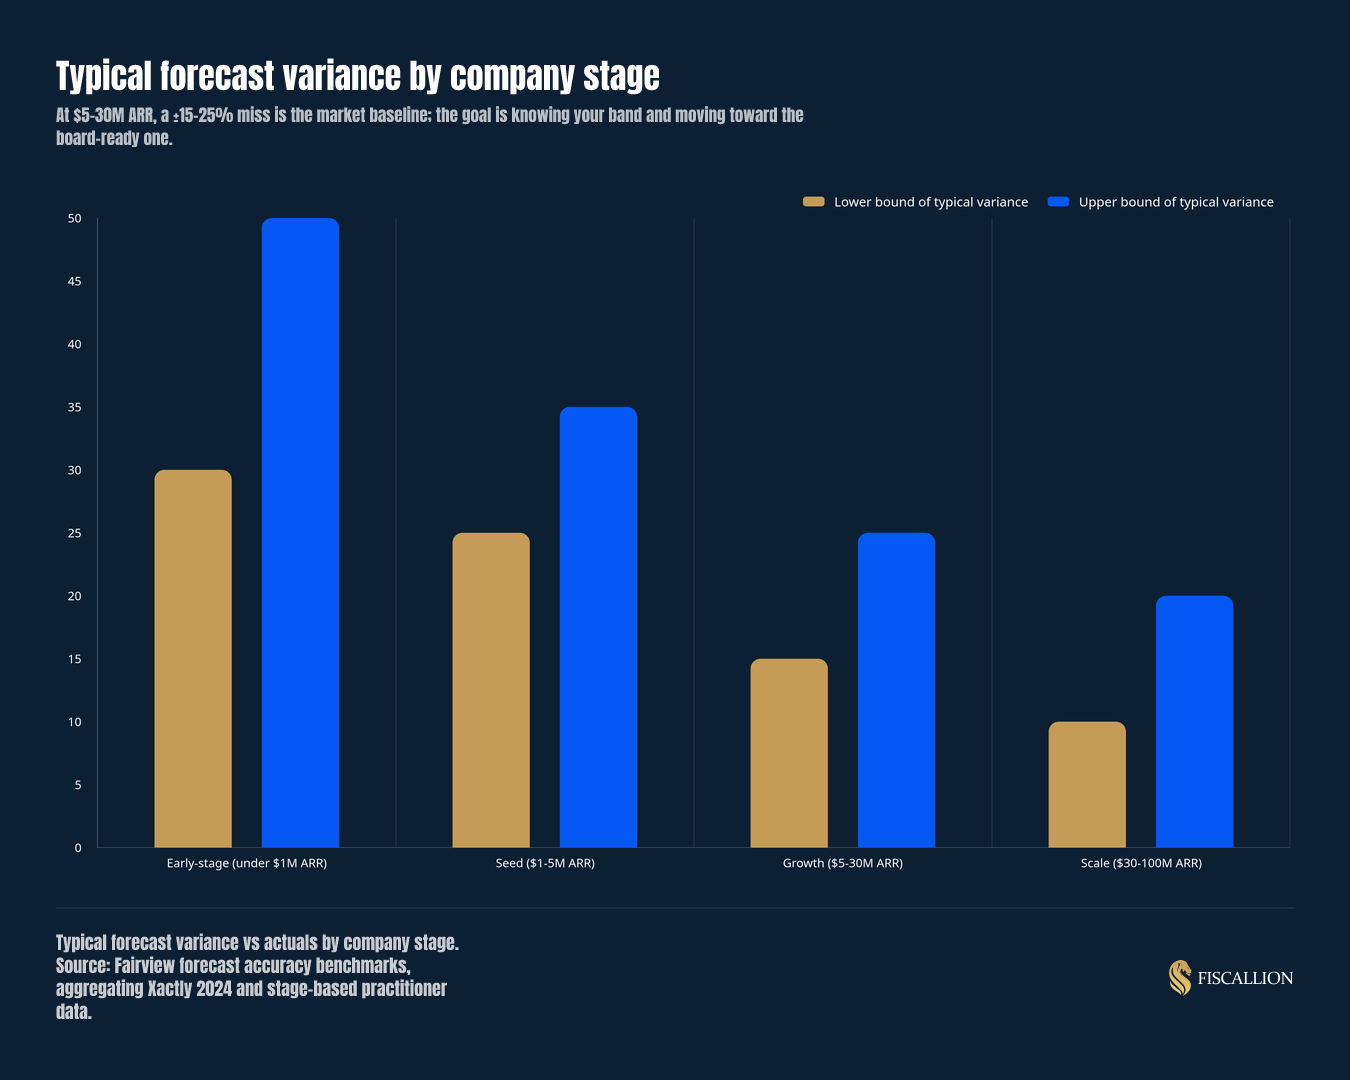
If you are running a $12M ARR SaaS company and your quarterly forecast lands within ±20%, you are inside the market baseline for your stage, not failing. The point of tracking this is not to hit zero error. It is to know which band you are in and move deliberately toward the next one.
Board-ready forecasting at Series B/C typically targets 8-12% WMAPE with a defined cadence and reconciled CRM-billing-finance data, while Series A companies commonly run 25-35% MAPE, per Clari's practitioner benchmarks. Bands also vary by what you are forecasting: B2B SaaS quarterly sales forecasts under 8% are considered excellent, 8-15% good, and above 20% needs work; monthly revenue forecasts run tighter (under 5% excellent), while ARR expansion forecasts run looser (under 10% excellent), according to Fairview's MAPE benchmark breakdown.
Treat every band as a range with a definitions caveat attached, not a universal number. Different sources define "good" differently because they measure different revenue bases and horizons.
How far out a SaaS forecast stays reliable
Error does not grow at a steady rate. It compounds as the horizon extends, which is why a next-quarter number and a next-year number deserve different levels of trust.
Quarterly revenue forecasts typically land within 8-15% of actuals, while annual budgets often miss by 20-30%, per practitioner research on forecast accuracy by horizon. Rolling 12-month forecasts that traverse fiscal years tend to outperform static annual budgets because they get updated with fresh actuals every period, while 24-month rolling horizons "tend to be less accurate, due to the cumulative effect of estimates compounded over an extended length of time".
The practical implication: track error by horizon as its own metric, not as a single company-wide accuracy number. A forecast that is 8% accurate at the quarterly horizon and 25% accurate at the annual horizon is not inconsistent. It is behaving exactly as forecasts do. The mistake is presenting the annual number with quarterly confidence.
What to do next: build the accuracy review into your existing cadence
Accuracy tracking only works if it happens on a schedule, not as a post-mortem after a bad board meeting.
This is the gap the metrics below are designed to close: when sales, finance, and the board each carry a different number, nobody is measuring the same thing.
- Name every assumption before the quarter starts. If your model assumes 40% pipeline conversion and current conversion is running at 28%, write that gap down. That gap is a decision, not a rounding error.
- Track bias by owner, not just by company. If sales consistently over-forecasts and finance consistently under-forecasts, that pattern is more useful than the blended number.
- Run FVA against a naive baseline every quarter. If your forecasting process cannot beat "assume next period looks like this period," the process is not adding value, regardless of how sophisticated the model looks.
- Reconcile CRM, billing, and finance data before you report accuracy, not after. Comparing accuracy across sources that disagree on the underlying numbers produces a result that looks precise and means nothing.
- Measure at the segment level where decisions actually happen, not only at the total-company level, because aggregation flatters accuracy as positive and negative errors in different segments cancel out.
None of this requires new software. It requires a decision to look at the same four or five numbers on the same schedule, every quarter, and to act on what they show.
Common mistakes and the better move
- Mistake: quoting an accuracy number without fixing period, revenue basis, or submission point. Better move: define the three anchors first, in writing, before comparing any two quarters.
- Mistake: reporting MAPE on small or volatile denominators, such as a new segment with few deals. Better move: use WMAPE at the company or segment level where it will not distort from a single outlier.
- Mistake: measuring accuracy only at the total-company level. Better move: break it out by segment or product line, since errors that cancel at the top level are still real errors underneath.
- Mistake: reporting error size without error direction. Better move: track bias by owner alongside MAPE or WMAPE, so you can see whether the miss is a pattern or noise.
- Mistake: never checking whether your process beats a naive guess. Better move: calculate FVA against a simple baseline before crediting the model, or the team, for accuracy that a spreadsheet formula could have produced.
- Mistake: letting manual overrides and internal politics touch the final number without review. Better move: gate every override through an FVA check. If the override does not measurably improve the forecast, it should not go in.
Fixing CRM and data hygiene first, meaning stale close dates and inconsistent stage criteria, typically improves accuracy by 10-15% on its own, per ORM's forecast accuracy research, before you add any statistical overlay.
The forecast-accuracy scorecard
Run this once per quarter. Fill in your current value, compare it to the band for your ARR stage, and assign an owner and a cadence.
| Metric | Current value | Band for your stage | Owner | Cadence | Action rule if out of band |
|---|---|---|---|---|---|
| WMAPE (revenue) | ___ | Growth $5-30M: 15-25%; Scale $30-100M: 10-20% | Finance lead | Monthly | Investigate top 3 line-item misses before next forecast cycle |
| Forecast bias | ___ | Near zero, tracked signed not net | Finance lead + department owner | Monthly | If consistently one-directional for 2+ quarters, recalibrate the input assumption, not just the output |
| FVA vs. naive baseline | ___ | Positive (beats naive forecast) | CFO or fractional CFO | Quarterly | If FVA is negative, remove the manual overlay causing it |
| Error by horizon | ___ | Quarterly 8-15%; annual 20-30% | Finance lead | Quarterly | Present annual numbers with a wider confidence range, not quarterly-level confidence |
| Definition drift (revenue basis or headcount) | ___ | Under 10% variance across sources | CFO or fractional CFO | Monthly | Reconcile CRM, billing, and finance before next report; do not report until resolved |
| Assumption log status | ___ | 100% of forecast inputs named and dated | CFO or fractional CFO | Quarterly | Any unnamed assumption blocks board presentation of that forecast line |
This scorecard is meant to be filled in and used, not filed away. If even two of these rows are consistently out of band, that is the conversation to have before the next board meeting, not during it.
Get help building your forecast-accuracy scorecard into a board-ready model
The judgment layer this scorecard cannot replace
A scorecard tells you which metric is out of band. It does not tell you which assumption to change, which override to reject, or how to explain a bias pattern to your board without sounding defensive. That interpretation is CFO-layer judgment, built through repetition across forecast cycles, not a formula.
Every Fiscallion client works directly with Aleksandar Stojanovic at the CFO layer, drawing on FP&A leadership experience gained through the growth of a SaaS company to €100M ARR, applying that judgment to your specific forecast rather than a generic template.
Frequently asked questions
What metrics should a SaaS company track to measure forecast accuracy?
Track six things: MAPE or WMAPE for error size, forecast bias for error direction, FVA to confirm your process beats a naive guess, error by horizon to know how fast confidence should decay, and definition drift to confirm you are comparing the same revenue basis and period every time. WMAPE is generally the more defensible metric for board reporting than raw MAPE, since it weights errors by revenue size instead of letting a small segment distort the whole number. None of these metrics is useful in isolation; a low MAPE with a hidden bias problem, or a high FVA on an undefined revenue basis, will mislead you.
What is a good MAPE for SaaS revenue and ARR forecasts?
It depends on what you are forecasting and at what stage. B2B SaaS quarterly sales forecasts under 8% are considered excellent, 8-15% good, and above 20% needs work, according to Fairview's benchmark breakdown. Monthly revenue forecasts typically run tighter, and ARR expansion forecasts run looser, with excellent under 10% and needs-work above 22%. At the company level, board-ready forecasting at Series B/C typically targets 8-12% WMAPE, while Series A companies commonly run 25-35% MAPE, per Clari's practitioner benchmarks. Treat every number here as a range tied to a specific definition of revenue and period, not a universal target.
How far out can a SaaS forecast remain reliable?
Reliability decays as the horizon extends, and it does so predictably. Quarterly revenue forecasts typically land within 8-15% of actuals, while annual budgets often miss by 20-30%, per Eagle Rock's forecast accuracy research. Rolling 12-month forecasts tend to outperform static annual budgets because they refresh with actuals every period, while 24-month rolling horizons compound estimation error and should be presented with a wider confidence range than a next-quarter number.
How do you improve SaaS forecast accuracy over time?
Fix the definitions first: lock down period, revenue basis, and submission point so every comparison means the same thing. Then fix CRM and billing data hygiene, meaning stale close dates and inconsistent stage criteria, which typically improves accuracy by 10-15% on its own, per ORM's research. After that, add FVA testing so every manual override earns its place in the forecast, and build a monthly or quarterly accuracy review into your existing operating cadence. Teams that follow this sequence, definitions, hygiene, FVA, cadence, commonly move from median to top-quartile accuracy within three to four quarters.
The decision this scorecard is actually for
Forecast accuracy metrics exist to answer one question before the board asks it: which numbers in your deck can you defend, and which ones need a caveat attached. Six metrics, tracked on a fixed cadence with named assumptions, will tell you that far more reliably than a single accuracy percentage ever will.
Run the scorecard this quarter. If two or more rows land out of band, that is worth a conversation with someone who has sat in the CFO seat through exactly this kind of miss, not another round of rebuilding the spreadsheet.