

Revenue variance commentary is the written explanation attached to each material gap between planned and actual revenue: naming the driver, quantifying its contribution, and stating what is being done about it. Boards do not need help reading a negative number. They need to know which mechanism produced it.
Most board decks fail this test not because the numbers are wrong, but because the commentary next to the numbers restates them instead of explaining them. "NRR declined to 108%" is a fact your board can read off the slide. It is not commentary. Commentary tells the board why it happened, what it means for the forecast, and what you are doing about it.
This article gives you that structure, a way to decide which variances deserve a written paragraph, and several annotated commentary examples you can adapt directly for your next board pack.
What you'll learn in this article
- The 4-part structure every effective variance paragraph follows
- How to set a materiality threshold so you are not writing commentary on noise
- Annotated good-versus-bad commentary examples for new ARR, NRR, CAC, and favorable variances
- The most common mistakes founders make when writing board commentary, and what to do instead
Commentary is a decision document, not a narration
A variance paragraph exists to help the board decide something. If it does not change what the board thinks about your forecast or your runway, it is not commentary. It is filler.
The clearest test comes from a CFO narrative framework built around this question: does the variance change your EBITDA forecast or your runway? If the answer is no, the variance is noise and does not need a paragraph. If the answer is yes, the paragraph has one job: name the mechanism, not the symptom.
Symptoms are what you observe: pipeline stalled, discounting rose, payroll ran over. Mechanisms are what caused it: competitor pricing pressure, a longer close cycle, a territory redesign. The mechanism is what determines whether next quarter is at risk too, which is exactly why naming the mechanism instead of the symptom is the discipline that separates useful commentary from decoration.
This is consistent with how Fiscallion approaches board reporting more broadly: shared metric definitions, named owners for each number, and written decision rules agreed before results come in.
"When a client's NRR dropped below 100% last month, the board did not spend twenty minutes establishing whether that was true. They spent twenty minutes on the retention intervention plan, because the decision rule and the driver ownership were already in place."
— Aleksandar Stojanovic, CEO & Founder at FiscallionHow to calculate the materiality screen
Before you write a single paragraph, decide which variances are worth a paragraph. Without a threshold, you either write commentary on every line (exhausting for you, useless for the board) or you skip commentary on something material because nobody flagged it.
Blended absolute-and-percentage thresholds work better than either measure alone. A worked illustrative example flags variances exceeding $25,000 and 10% of budget simultaneously, so a small percentage move on a large line item and a large percentage move on a small line item both get filtered correctly.
A different published approach uses 5% of plan or $50,000 absolute, whichever is greater, per cost center, with a trend override: items below threshold still get commented on if they constitute a trend across three or more periods. That specific rule was framed for a larger business than most Fiscallion clients, but the trend override is worth borrowing regardless of company size.
The table below shows why a percentage-only threshold misfires in both directions, using a published illustrative quarter (not real company data):
| Line item | Plan | Actual | Variance % of plan | Clears a 5% threshold? |
|---|---|---|---|---|
| Enterprise revenue | $20.0M | $19.95M | -0.25% | No |
| SMB revenue | $4.0M | $3.7M | -7.5% | Yes |
| Marketing opex | $400K | $480K | +20% | Yes |
| Travel | $80K | $92K | +15% | Yes on percentage, immaterial in dollars |
| Engineering payroll | $3.2M | $3.18M | -0.6% | No |
Source: rework.com variance analysis playbook
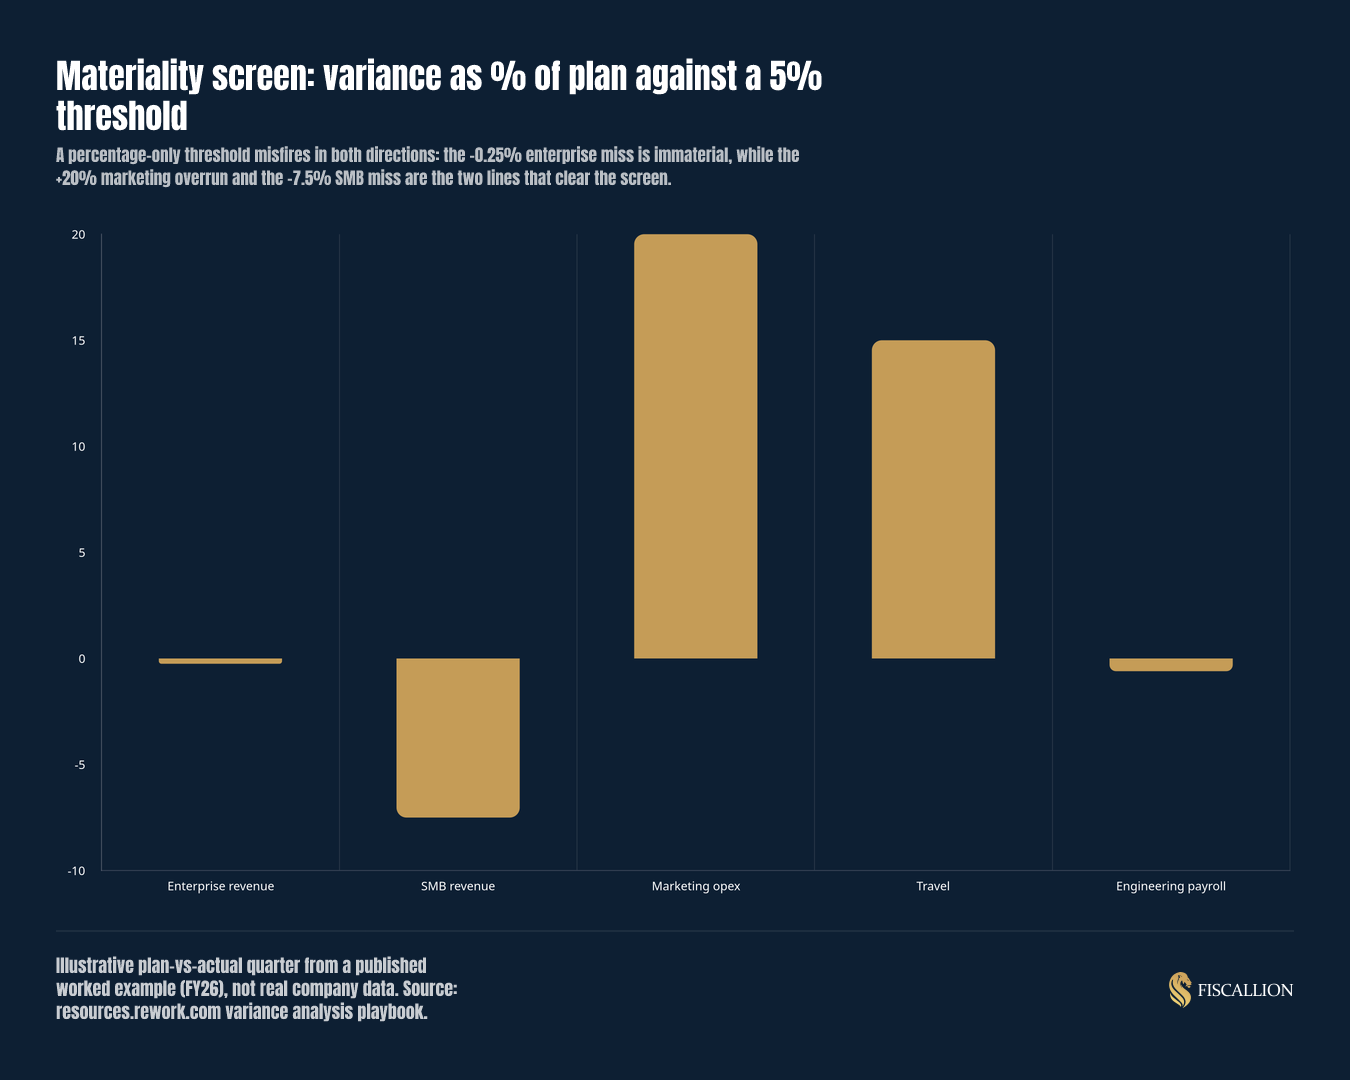
The enterprise line missed by almost nothing and needs no commentary. The SMB line and the marketing overrun are the two that actually clear a reasonable screen and deserve a paragraph each. Travel is a case for judgment: 15% is a large percentage move on a trivial dollar amount, which is exactly the kind of line a blended threshold is meant to filter out.
Set the threshold with your CFO and board chair before the first report goes out, not after someone asks why a line item went unexplained. Numeric's guidance is direct on this: threshold discipline agreed in advance, rather than argued after the fact, can meaningfully reduce commentary volume without cutting anything the board actually needed to see.
The 4-part structure every commentary paragraph follows
Once a variance clears the threshold, the paragraph itself follows a fixed sequence. Skipping any of the four steps is what turns commentary into narration.
- What happened. State the variance in absolute and percentage terms. This is the only part that restates a number, and it should take one sentence.
- Why it happened. Name the driver, quantified where possible. Carl Seidman, known as The FP&A Guy, calls a paragraph that skips this step lazy commentary: no root cause, no forward impact, no action.
- What it means going forward. This is the step boards care about most and the step most controllers skip. Does this variance change next quarter's forecast? Does it change runway?
- What you are doing about it. A named action, or a deliberate decision to hold and monitor with a stated reason. "We are monitoring" on its own is not an action.
The function that owns the driver should write its own line whenever possible. Sales writes the deal-level commentary on new ARR; marketing writes the pipeline-creation commentary; customer success writes the retention commentary. Finance assembles and edits, but finance writing commentary without the operating context behind it is one of the fastest ways a variance paragraph turns vague.
Annotated examples: what weak commentary and strong commentary actually look like
These four examples cover the variances a SaaS board sees most often: a revenue miss, an NRR drop, a CAC overrun, and a favorable variance. Each shows the weak version, the rewritten version, and which part of the 4-part structure each sentence is doing.
Example 1: New ARR miss
Plan vs actual: New ARR plan $1.2M, actual $950K, variance -$250K (-21%)
Weak: "New business was soft this quarter."
Strong: "New ARR came in $250K below plan. Of the shortfall, roughly $150K reflects deals that slipped into next quarter rather than deals that were lost, and roughly $100K reflects deals lost to a competitor's new pricing tier. Slipped deals do not change our full-year forecast; lost deals do, and we are adjusting the full-year new-ARR forecast down by $100K. We are also updating our competitive positioning for that segment before the next renewal cycle."
Annotation: sentence one is what happened. Sentences two and three separate the mechanism (slippage versus loss), because slipped deals are a timing issue and lost deals are a demand issue, and only one of them should move your forecast. Sentence four is forward impact. Sentence five is action.
Example 2: NRR drop
Plan vs actual: NRR plan 112%, actual 108%, variance -4 points
Weak: "NRR declined to 108% this quarter."
Strong: "NRR dropped to 108%, four points below plan. The decline traces to two enterprise downgrades, both from the 2024 cohort, both still on the legacy pricing plan. Because this is a pricing-cohort issue rather than a broad retention problem, we do not expect it to recur across the rest of the base. Here is the migration plan to move remaining 2024-cohort accounts to current pricing before their next renewal."
Annotation: this is the client-authored pattern that separates a symptom (NRR fell) from a mechanism (a specific pricing cohort). Naming the cohort and the plan tells the board whether this is a one-time issue or a trend, which is the forward-impact question the board actually has.
Example 3: CAC and marketing overrun
Plan vs actual: Marketing opex plan $400K, actual $480K, variance +$80K (+20%)
Weak: "The overrun reflects timing of campaign costs."
Strong: "Marketing spend ran $80K over plan. $60K of that is a campaign pulled forward from next quarter to capture a seasonal window; the remaining $20K is a genuine overrun on paid acquisition costs. Pulling the campaign forward does not change the full-year marketing budget, but the $20K overrun, if it continues at this rate, adds roughly $80K to full-year spend. We are holding the channel flat next month rather than scaling it further while we confirm the CAC trend."
Annotation: "timing" alone is the vague version of a real reason. The rewrite quantifies how much of the variance is genuinely timing versus how much is a real cost increase, states the full-year forecast impact, and makes an explicit hold decision rather than a vague monitoring statement.
Example 4: Favorable variance
Plan vs actual: New ARR plan $1.0M, actual $1.15M, variance +$150K (+15%)
Weak: (no commentary written, because the number beat plan)
Strong: "New ARR beat plan by $150K. Of that, $100K reflects two deals that were originally forecast for next quarter and closed early; $50K reflects genuine in-quarter pipeline creation above plan. Next quarter's forecast is adjusted down by $100K to reflect the pulled-forward deals, so the board should not expect this quarter's beat to repeat in full."
Annotation: Skipping commentary on a beat is how unexplained upside becomes next quarter's shortfall, because the board has no way to tell a pulled-forward deal from durable, repeatable growth.
"A favorable variance still needs the full structure."
— Aleksandar Stojanovic, CEO & Founder at FiscallionHow to interpret: good commentary versus bad commentary
The pattern across all four examples above is consistent. Use this table to check any commentary paragraph you write before it goes into the deck.
| Element | Weak commentary | Strong commentary |
|---|---|---|
| What happened | Restates the number on the slide | States the number once, briefly, then moves on |
| Why | Symptom only ("soft demand", "timing") | Named, quantified mechanism |
| Forward impact | Missing entirely | Explicit effect on forecast or runway |
| Action | "We are monitoring" | A named decision: adjust, hold, migrate, invest |
| Coverage | Favorable variances go unexplained | Both misses and beats get a paragraph |
| Authorship | Finance writes every line alone | Driver-owning function writes its own line |
What to do next
Three moves turn this framework into a repeatable habit rather than a one-time rewrite:
- Publish a one-page materiality memo. Write the threshold rule down, agree it with your board chair, and reuse it every quarter so the threshold is never a live argument in the meeting.
- Send a 48-hour department-input prompt. Ask each driver-owning function two questions before the deck is built: what drove this, and what is the go-forward expectation? Sales, marketing, and customer success answer for their own lines.
- Track whether your explanations held up. Revisit last quarter's stated actions against this quarter's actual result. If you said a variance was timing and it recurred, that is a mechanism you misdiagnosed, and the board should see that you caught it.
If you want a working structure to start from, Fiscallion's free SaaS board reporting template pairs with this framework: shared metric definitions and named owners on one side, this commentary structure on the other.
Common mistakes and what to do instead
- Restating the P&L instead of explaining it. Replace with a single sentence stating the number, followed by the mechanism.
- Writing commentary on every line item. Replace with the materiality threshold, applied consistently before results come in.
- Skipping the forward impact. Replace with an explicit statement of what the variance does to next quarter's forecast or to runway.
- Apologizing instead of acting. Replace the tone with a named decision: what you are doing, or a deliberately stated hold with a reason.
- Leaving favorable variances unexplained. Replace silence with the same 4-part structure, because unexplained upside becomes next quarter's shortfall when the board cannot tell a pull-forward from durable growth.
- Finance writing every line without operating context. Replace with driver-owner authorship: sales writes deal-level commentary, marketing writes pipeline-creation commentary, customer success writes retention commentary.
Every Fiscallion client works directly with Aleksandar Stojanovic at the CFO layer on board decks and the commentary that goes with them: a senior partner reviewing the model with you before the meeting, not a delivery team handing off a template.
If you want a second read on your next board pack before it goes out, Fiscallion's financial modeling and board reporting service is the place to start that conversation.
FAQ
What should a SaaS variance commentary include for a board report?
A complete variance commentary paragraph includes four elements in sequence: what happened (the variance in dollars and percent), why it happened (a named, quantified driver rather than a general symptom), what it means for the forecast or runway going forward, and what action is being taken or deliberately held. A paragraph missing any of these four is incomplete, no matter how well it is written.
How do you write variance commentary for SaaS metrics like ARR, churn, and CAC?
The same 4-part structure applies to every metric, but the mechanism you name differs by metric. For new ARR, separate slipped deals (timing) from lost deals (demand), and use a price-volume-mix breakdown when the driver is genuinely revenue mix. For churn and NRR, name the cohort or account segment behind the change rather than the aggregate number. For CAC, separate genuine cost overruns from pulled-forward or timing-shifted spend, and state the full-year forecast effect of whichever portion is real.
What does a good vs. bad variance explanation look like in a SaaS board deck?
A bad explanation restates the number that is already on the slide and stops there, for example "NRR declined to 108%" or "the overrun reflects timing." A good explanation names the specific mechanism behind the number, quantifies its contribution, states the effect on the forecast or runway, and closes with a named action rather than a statement that the team is monitoring the situation.
How much variance should trigger written commentary in a SaaS board report?
Set a blended threshold combining a dollar amount and a percentage of plan, agreed with your CFO and board chair before results come in, rather than relying on either measure alone. One published example flags variances exceeding both $25,000 and 10% of budget; another uses 5% of plan or $50,000 absolute, whichever is greater. Add a trend override so that any line item recurring below threshold for three or more consecutive periods still gets a written paragraph, since a small variance that keeps repeating is a mechanism worth naming even if no single period clears the threshold on its own.
The decision this framework supports
A board that reads narrated numbers spends its meeting time re-deriving facts it could have read off a slide. A board that reads commentary built on this 4-part structure spends its time on the decision the variance actually calls for, whether that is a retention intervention, a pricing migration, or a hold on a marketing channel.
Write the threshold rule down once, assign driver ownership once, and the commentary in every future board pack gets faster to write and more useful to read.