
SaaS board reporting software requirements are the criteria that determine whether a reporting stack can produce a decision-ready board pack, not just a prettier version of last quarter's numbers. Written correctly, they cover four layers: data (one source of truth, connected to your actual systems), controls (audit trails, versioned metric definitions, named owners), narrative (variance tied to drivers, scenario speed, a repeatable pack structure), and ownership (who updates the number and who defends it on the call). Get these four layers right and the software choice becomes secondary. Get them wrong and no vendor demo will fix it.
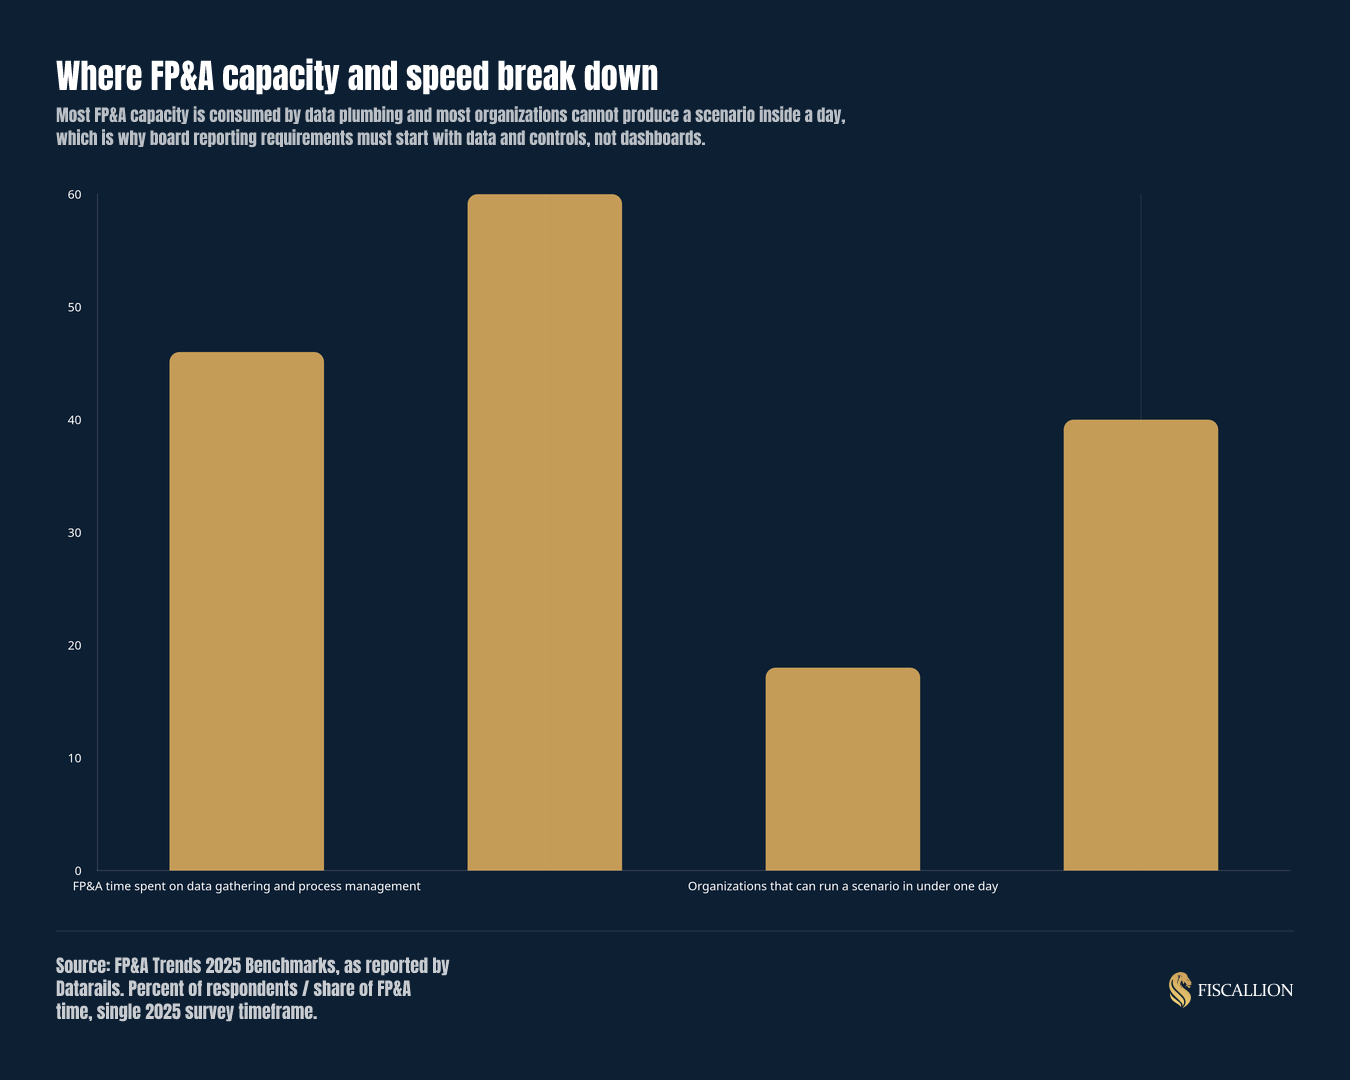
This matters because most requirements lists are written backwards. Founders list features they saw in a demo, then discover in the boardroom that the tool cannot answer a scenario question live, or that nobody actually owns the number a director is questioning. According to FP&A Trends 2025 Benchmarks, 46% of FP&A time still goes to gathering data and managing process rather than analysis, and only 18% of organizations can run a financial scenario in under a day. That is not a dashboard problem. It is a requirements problem, and it gets solved before you sign a contract, not after.
Why feature checklists fail before the board even asks a question
Most software evaluations start with a feature list pulled from a vendor's homepage: dashboards, integrations, AI insights, drill-down. The list looks thorough. It rarely predicts what happens when a board member asks "what does this look like if we miss the renewal by two months" and the room goes quiet.
"Requirements fail as feature lists because they describe capability, not decision readiness."
— Aleksandar Stojanovic, CEO & Founder at FiscallionA tool can have scenario modeling and still leave the board underserved if nobody owns the assumptions behind the scenario, or if the definitions of the metrics being modeled shift from deck to deck.
decision-grade board reporting is not a software category. It is an outcome: the board leaves the meeting with a clear view of trade-offs and a recommendation, not just a status update. Software is the delivery mechanism. The requirements you write should describe the decision system the software has to serve, not the interface it has to display.
This is also why "board reporting software" is a confusing shopping term. ClearPoint's category breakdown draws a useful line: governance portals such as Diligent, OnBoard, and Boardable manage agendas, board books, and minutes, while performance-reporting platforms generate the actual numbers from live data. A portal displays a decision. A reporting platform is supposed to produce the evidence behind it. Buying the wrong category solves the wrong problem.
The four requirement layers, defined
Before scoring anything, define what each layer actually has to do. This is the direct answer to "what does a SaaS board reporting tool need to do."
- Data: a single source of truth that connects to the systems you already run, refreshes on a known schedule, and lets anyone drill from a board-pack number down to the source transaction.
- Controls: an audit trail, version history on the model, and one documented definition per metric that does not change between board meetings.
- Narrative: plan-versus-actual variance that names the driver behind the gap, scenario output fast enough to use live in a meeting, and a pack structure that survives quarter over quarter without being rebuilt from scratch.
- Ownership: a named data owner and a named decision owner for every metric that appears in the pack, with a refresh service level and a documented trigger for when a number changes the recommendation.
Fiscallion's board reporting framework treats ownership as the layer most software vendors skip entirely: every metric needs a data owner who keeps the number current and a decision owner who is accountable for what it means for the business. Software can automate the first role. It cannot substitute for the second.
The requirements scorecard: score your current stack across all four layers
Use this table as a working scorecard. Score each row 1 (not met) to 5 (fully met) against your current tool or the tool you are evaluating. A pattern of low scores in one column tells you where the real gap sits, which matters more than the total.
| Layer | Requirement | What "5" looks like | Your score (1-5) |
|---|---|---|---|
| Data | Single source of truth | One number per metric, no competing spreadsheet versions in circulation | |
| Data | Native connection to your actual stack | Pulls from your billing, CRM, and GL without manual export/import | |
| Data | Automatic refresh on a known cadence | Numbers update on a defined schedule, not on someone remembering to run it | |
| Data | Drill-down to source | Any board-pack figure traces to the underlying transaction in a few clicks | |
| Controls | Audit trail | Every change to a number or assumption is logged with who and when | |
| Controls | Version control on the model | Prior board-pack versions are retrievable and comparable | |
| Controls | Documented metric definitions | Every metric has one written definition that does not shift between decks | |
| Controls | Named input owners | Each assumption in the model has one person accountable for it | |
| Narrative | Variance tied to drivers | Plan-vs-actual gaps are explained by cause, not just restated as a number | |
| Narrative | Scenario speed | A new scenario can be produced and reviewed inside the meeting, not the following week | |
| Narrative | Repeatable pack structure | The board pack format holds from quarter to quarter without a rebuild | |
| Ownership | Data owner assigned | Every metric has one person responsible for keeping it current | |
| Ownership | Decision owner assigned | Every metric has one person accountable for what it means and what to do next | |
| Ownership | Refresh SLA documented | There is a written expectation for how current the numbers must be before a board meeting | |
| Ownership | Decision trigger documented | It is written down what change in a number changes the recommendation |
If your total score clusters low in the Data row, your bottleneck is ingestion and close, not the reporting layer sitting on top of it. As The Finance Chiefs' buyer's guide puts it plainly, if your pain is data ingestion and close, no modeling platform will fix it. Fix the plumbing before you shop for a nicer view of it.
How to run the evaluation without buying the best demo
Software evaluations go wrong when they start with a demo instead of a problem statement. Aleph's FP&A evaluation framework lays out a sequence worth adapting directly to board reporting:
- State the problem with a baseline number. Not "our reporting is slow" but "our reforecast takes nine days and the board sees numbers three weeks stale."
- Map requirements by use case, using the four-layer scorecard above, not a generic feature list.
- Shortlist two to four vendors that fit your architecture, not every tool with a good landing page.
- Model three-year total cost of ownership, including implementation and the analyst time to maintain it.
- Run a two-to-four-week proof of concept on your own general ledger data, not the vendor's sample dataset.
- Score finalists on the weighted rubric you built in step two, before anyone signs anything.
Aleph's own framing is blunt about the failure mode: teams that skip straight to demos end up buying the best demo, not the best tool. The scorecard above is meant to be the rubric you build in step two.
One architectural distinction is worth deciding early. Aleph's evaluation guide splits the market into spreadsheet-native tools (Aleph, Cube, Datarails, Vena), which tend to win on time-to-value and adoption, and web-based platforms (Planful, Pigment, Anaplan, Abacum), which tend to win on complex multi-entity workflow. Neither is universally correct; the right fit depends on how many entities and consolidation layers your business actually has.
Interpreting a failing scorecard: what the gaps actually tell you
A low score is diagnostic, not just a grade. Read it by column.
- Low Data scores mean your close and ingestion process is the bottleneck. No reporting tool fixes a slow, manual close.
- Low Controls scores mean your numbers are not defensible under questioning, because there is no audit trail or locked definition behind them.
- Low Narrative scores mean your pack reports history without framing a decision, which is the single most common reason boards ask "so what do we do."
- Low Ownership scores mean nobody is accountable for the number, and that gap does not close with better software. ClearPoint's data across 562 public-sector organizations and 7,776 strategic plans found that 76.5% of assigned KPI owners never update their data on their own initiative. The context is public-sector, but the pattern generalizes: assigning an owner on paper and building actual ownership are different things, and no dashboard closes that gap by itself.
Board Intelligence data relayed by Fastio reinforces the same point from the other direction: board packs at larger organizations regularly exceed 300 pages, and 54% of board members say finding the key message in board papers feels like searching for a needle in a haystack. More pages and more dashboard tabs are not the fix. A tighter narrative layer, scored honestly against the table above, is.
The same four gaps show up in practice, not just in benchmarks. In this post, Aleksandar breaks down the root cause behind most broken board meetings and the four things that fix it:
Where the software's job ends and CFO-level judgment starts
Software can automate data pulls, enforce version control, and generate a scenario output in seconds.
"It cannot decide which scenario is worth presenting, defend an assumption when a director pushes back, or reframe a variance into a recommendation."
— Aleksandar Stojanovic, CEO & Founder at FiscallionThat is judgment, and it sits above the tool regardless of which vendor you choose.
Cube positions its executive reporting layer as running alongside the stack you already trust, without a rip-and-replace of your ERP, Excel, or BI tools, with every board-pack line drilling to source transactions so follow-up questions get answered in the room. That is a sound requirement for the data layer. It still leaves open who decides what the follow-up answer should recommend.
This is the layer Fiscallion's Financial Modeling & Board Reporting service is built to occupy: driver-based models, investor-ready board packs, and scenario support for B2B SaaS companies. Every Fiscallion client works directly with Aleksandar Stojanovic at the CFO layer, so the person building the forecast is the same person defending it to the board, which matters most exactly when a director asks the scenario question your software cannot answer alone.
If you want to see where your current setup actually stands before deciding whether the gap is a tooling problem or an ownership problem, work through the requirements scorecard with Fiscallion's financial modeling and board reporting service.
Common mistakes and the better move
- Mistake: copying requirements from a vendor's feature list. Replacement: write requirements from your own decision system first, using the four-layer scorecard, then evaluate vendors against it.
- Mistake: buying the best demo instead of the best fit. Replacement: run a proof of concept on your own general ledger data before signing, per the Aleph sequence above.
- Mistake: treating a governance portal as board reporting. Replacement: confirm whether you need a portal (agendas, minutes, board books) or a reporting platform (the numbers themselves) before you shop, since ClearPoint's category split shows these solve different problems.
- Mistake: one number per metric with no written definition. Replacement: document a single definition per metric and version it, so the number does not silently shift between board meetings.
- Mistake: assuming the software will create ownership. Replacement: assign a named data owner and decision owner for every metric before implementation starts, not after the first broken board meeting.
The narrative layer is also where the day-to-day time savings show up first. In this post, Aleksandar describes how a founder went from a three-day, 42-slide board deck to a compact pack built on a metric-with-driver format:
Frequently asked questions
Do I need to replace our existing accounting tool or BI stack to use a board reporting service?
No. A board reporting service is meant to sit on top of your existing accounting system and BI tools, not replace them. As the Cube executive-reporting positioning cited above shows, even purpose-built reporting software is designed to coexist with your existing stack. The same logic applies to CFO-led board reporting: the value comes from turning your existing, reliable accounting data into forecasts, scenarios, and board-ready narrative, not from swapping out the ledger or the dashboard tool you already use. If a vendor or advisor tells you the fix requires ripping out your current stack, treat that as a signal the requirements were never mapped to your actual systems in the first place.
How is a board reporting service different from what our bookkeeper or controller already produces?
A bookkeeper or controller produces accurate historical numbers: closed books, reconciled accounts, a clean trial balance. That is essential and it is not the same job as board reporting. Board reporting takes those clean numbers and turns them into a forward-looking pack that frames trade-offs: what the runway looks like under two scenarios, which segment's CAC payback is drifting, what headcount plan the cash position actually supports. Fiscallion's framework requires two roles per metric, a data owner and a decision owner, and a controller typically fills the first role well while the second requires FP&A judgment about what a number means for the next quarter's decisions. A board reporting service does not compete with your bookkeeper or controller; it works above the ledger, using their output as the input.
What happens when the board asks a scenario question on the call: can the numbers hold up in real time?
This is the moment most reporting setups fail, and the data explains why: per FP&A Trends 2025 Benchmarks, only 18% of organizations can run a financial scenario in under a day. If your scenario capability takes a week to turn around, a live question in the boardroom gets answered with "we'll follow up," which erodes confidence regardless of how good the underlying model is. Two things need to be true before the call: the model needs to be able to change one driver and show downstream effects quickly (Drivetrain's vendor evaluation framework suggests testing this directly by asking a vendor to rebuild a simple model live and change one input in under 30 minutes), and someone in the room needs the authority and familiarity with the assumptions to interpret the output on the spot. Software handles the first requirement. A CFO-layer owner who built the model, rather than someone reading a printout, handles the second.
How long does it take before the first board pack ships on a new reporting format?
Timelines vary by vendor, data cleanliness, and how many systems need to be connected, so treat any generic promise skeptically. As a first-party reference point, Fiscallion's board reporting framework runs on a 10-business-day implementation plan built around one internal process owner and two short leadership working sessions, after which the cadence settles into roughly 20 to 30 minutes weekly and about 60 minutes monthly. Separately, if you are evaluating new software rather than a reporting service, Aleph's evaluation framework recommends a two-to-four-week proof of concept on your own general ledger data before committing, which is a reasonable planning window if your team is starting from a feature-list requirements process rather than a decision-grade one.
Board reporting software requirements are ultimately a proxy for a harder question: does your organization know who owns each number and who is accountable for what it means. Score your current stack honestly against the four layers above before renewing or replacing anything, because a low score in Data or Controls points to a plumbing problem no dashboard fixes, and a low score in Ownership points to a governance gap no software vendor can sell you out of.
The scorecard is meant to be used, not filed away. Run it against your current board pack this quarter, and where the gaps sit in narrative and ownership rather than data connections, that is the layer where CFO-level judgment, not another tool purchase, closes the distance.